

Anticipating infectious disease re-emergence and elimination: a test of early warning signals using empirically based models
- PMID: 35919978
- PMCID: PMC9346357
- DOI: 10.1098/rsif.2022.0123
Anticipating infectious disease re-emergence and elimination: a test of early warning signals using empirically based models
Abstract
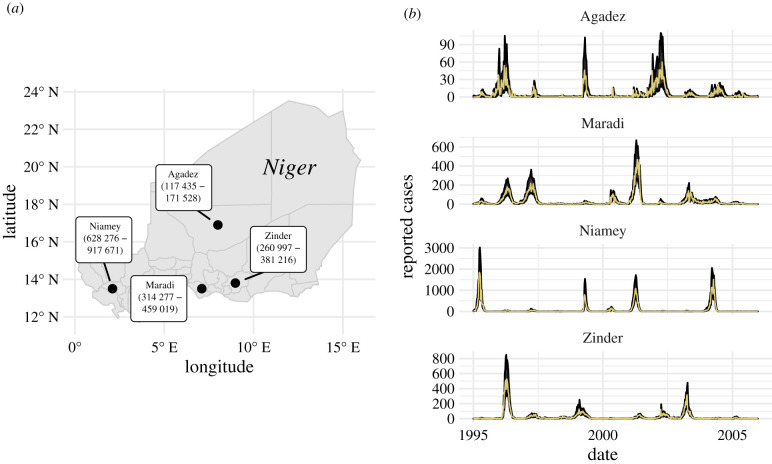
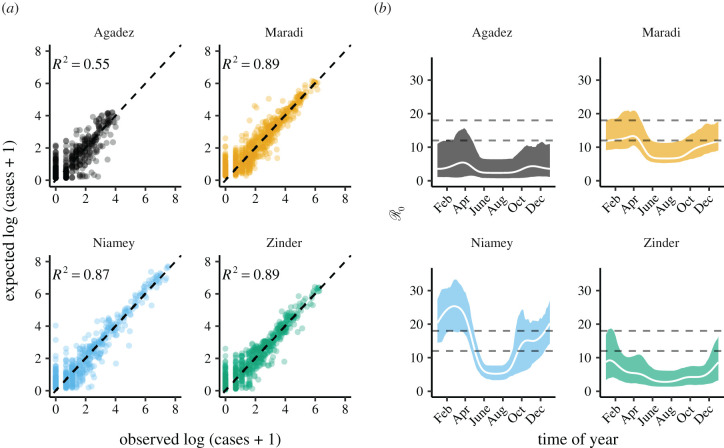
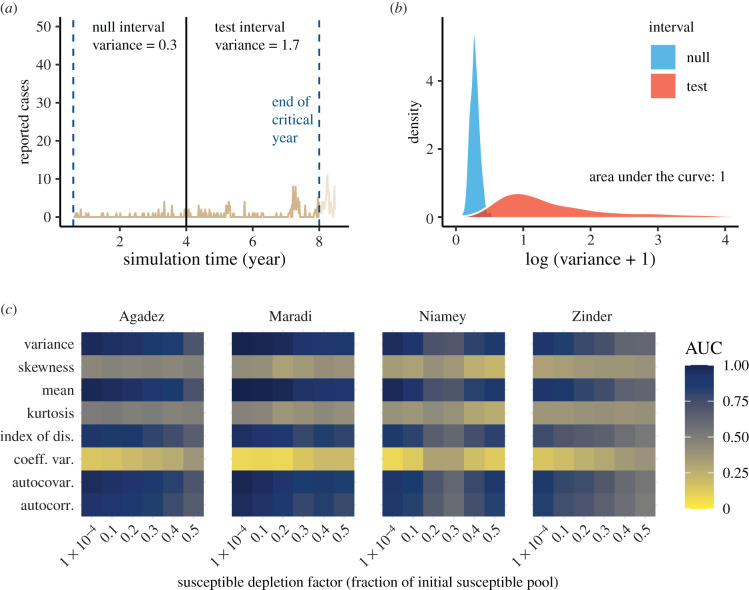
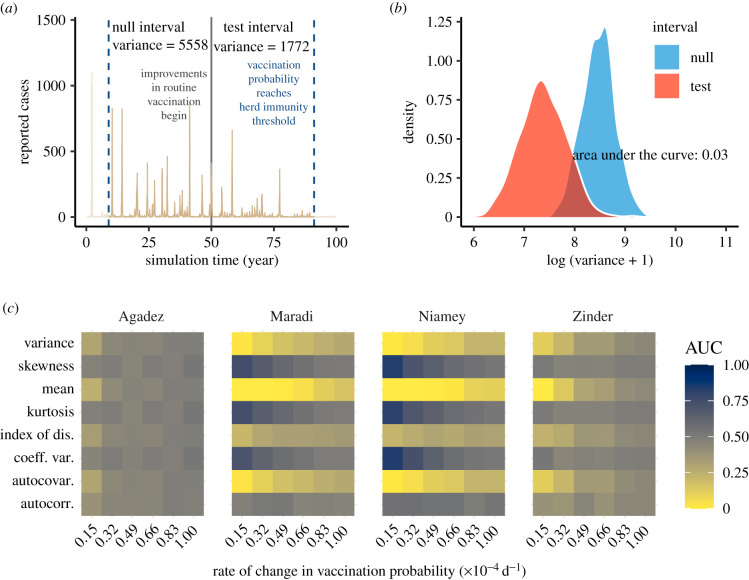
Timely forecasts of the emergence, re-emergence and elimination of human infectious diseases allow for proactive, rather than reactive, decisions that save lives. Recent theory suggests that a generic feature of dynamical systems approaching a tipping point-early warning signals (EWS) due to critical slowing down (CSD)-can anticipate disease emergence and elimination. Empirical studies documenting CSD in observed disease dynamics are scarce, but such demonstration of concept is essential to the further development of model-independent outbreak detection systems. Here, we use fitted, mechanistic models of measles transmission in four cities in Niger to detect CSD through statistical EWS. We find that several EWS accurately anticipate measles re-emergence and elimination, suggesting that CSD should be detectable before disease transmission systems cross key tipping points. These findings support the idea that statistical signals based on CSD, coupled with decision-support algorithms and expert judgement, could provide the basis for early warning systems of disease outbreaks.
Keywords: critical slowing down; early warning signals; epidemiology; infectious disease; measles.
Figures
Similar articles
-
Reviewing the progress of infectious disease early warning systems and planning for the future.BMC Public Health. 2024 Nov 7;24(1):3080. doi: 10.1186/s12889-024-20537-2. BMC Public Health. 2024. PMID: 39511577 Free PMC article.
-
Detecting critical slowing down in high-dimensional epidemiological systems.PLoS Comput Biol. 2020 Mar 9;16(3):e1007679. doi: 10.1371/journal.pcbi.1007679. eCollection 2020 Mar. PLoS Comput Biol. 2020. PMID: 32150536 Free PMC article.
-
Forecasting infectious disease emergence subject to seasonal forcing.Theor Biol Med Model. 2017 Sep 6;14(1):17. doi: 10.1186/s12976-017-0063-8. Theor Biol Med Model. 2017. PMID: 28874167 Free PMC article.
-
Spatial early warning signals of social and epidemiological tipping points in a coupled behaviour-disease network.Sci Rep. 2020 May 6;10(1):7611. doi: 10.1038/s41598-020-63849-0. Sci Rep. 2020. PMID: 32376908 Free PMC article.
-
Early warning signals of infectious disease transitions: a review.J R Soc Interface. 2021 Sep;18(182):20210555. doi: 10.1098/rsif.2021.0555. Epub 2021 Sep 29. J R Soc Interface. 2021. PMID: 34583561 Free PMC article. Review.
Cited by
-
Overlapping timescales obscure early warning signals of the second COVID-19 wave.Proc Biol Sci. 2022 Feb 9;289(1968):20211809. doi: 10.1098/rspb.2021.1809. Epub 2022 Feb 9. Proc Biol Sci. 2022. PMID: 35135355 Free PMC article.
-
The potential of resilience indicators to anticipate infectious disease outbreaks, a systematic review and guide.PLOS Glob Public Health. 2023 Oct 10;3(10):e0002253. doi: 10.1371/journal.pgph.0002253. eCollection 2023. PLOS Glob Public Health. 2023. PMID: 37815958 Free PMC article.
-
Early detection of disease outbreaks and non-outbreaks using incidence data: A framework using feature-based time series classification and machine learning.PLoS Comput Biol. 2025 Feb 13;21(2):e1012782. doi: 10.1371/journal.pcbi.1012782. eCollection 2025 Feb. PLoS Comput Biol. 2025. PMID: 39946412 Free PMC article.
-
Reviewing the progress of infectious disease early warning systems and planning for the future.BMC Public Health. 2024 Nov 7;24(1):3080. doi: 10.1186/s12889-024-20537-2. BMC Public Health. 2024. PMID: 39511577 Free PMC article.
-
Development of environmental loop-mediated isothermal amplification (eLAMP) diagnostic tool for Bulinus truncatus field detection.Parasit Vectors. 2023 Feb 28;16(1):78. doi: 10.1186/s13071-023-05705-4. Parasit Vectors. 2023. PMID: 36855192 Free PMC article.
References
Publication types
MeSH terms
Grants and funding
LinkOut - more resources
Full Text Sources
Medical
