

Orthovoltage X-Rays Exhibit Increased Efficacy Compared with γ-Rays in Preclinical Irradiation
- PMID: 35919990
- PMCID: PMC9354647
- DOI: 10.1158/0008-5472.CAN-22-0656
Orthovoltage X-Rays Exhibit Increased Efficacy Compared with γ-Rays in Preclinical Irradiation
Abstract
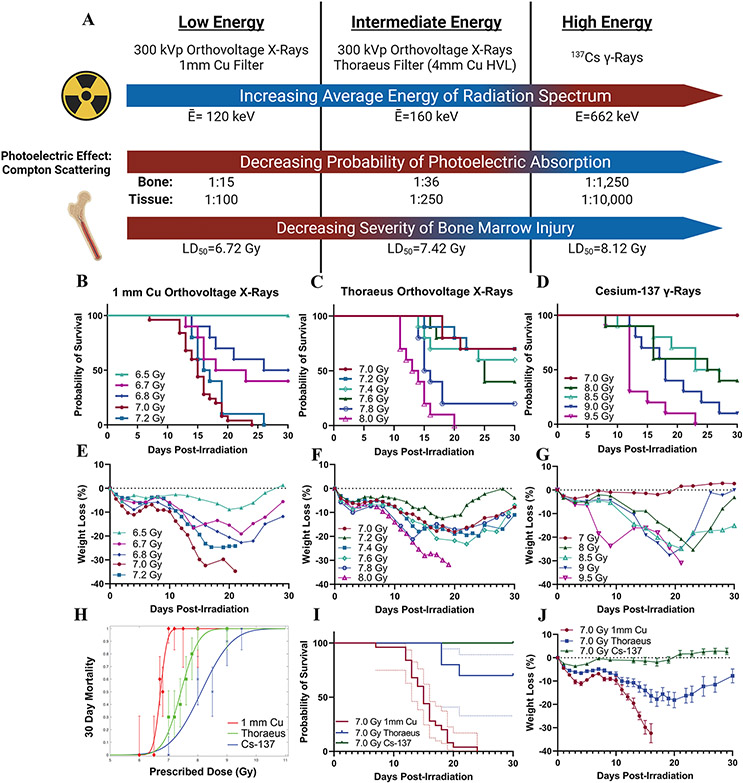
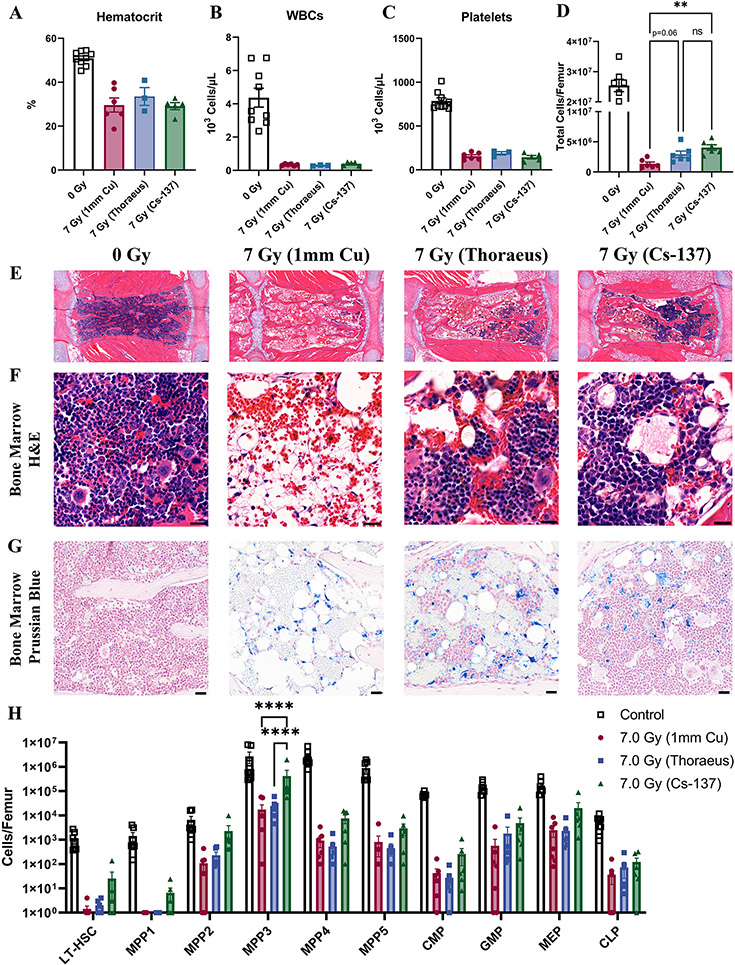
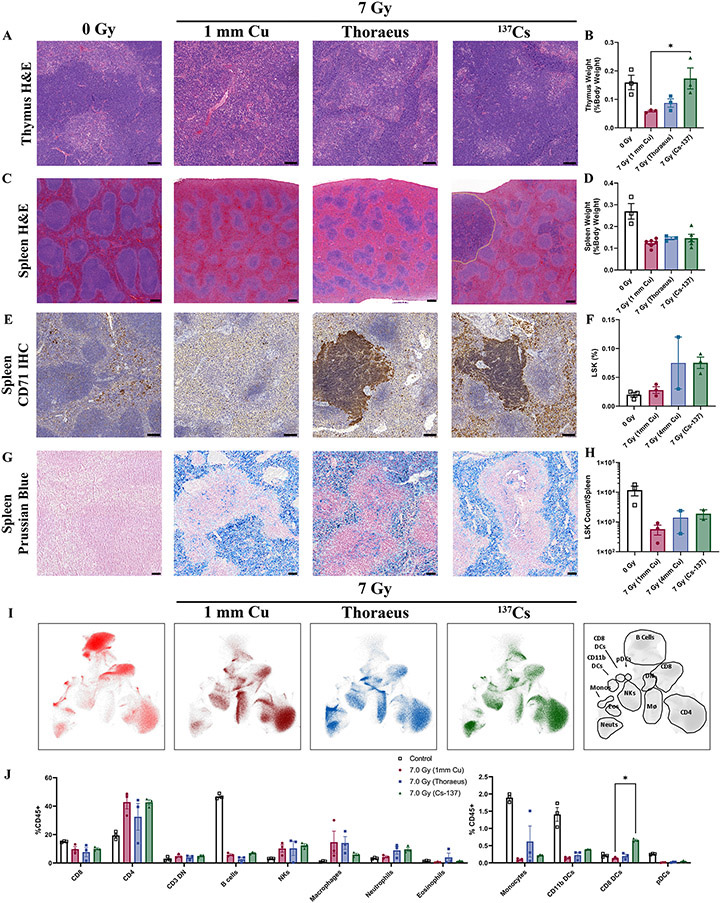
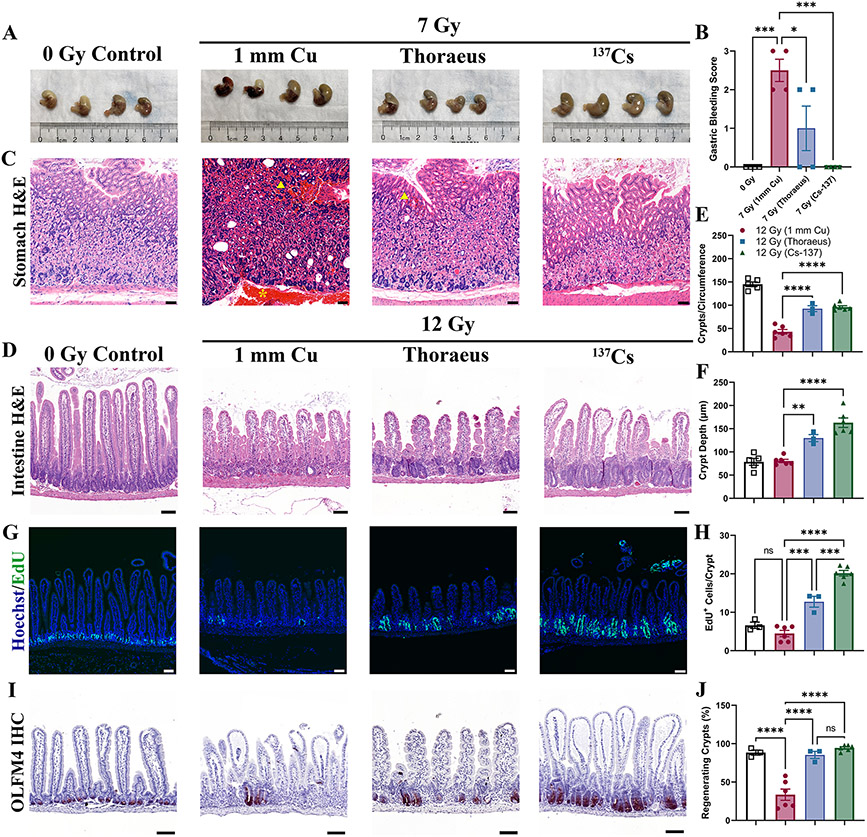
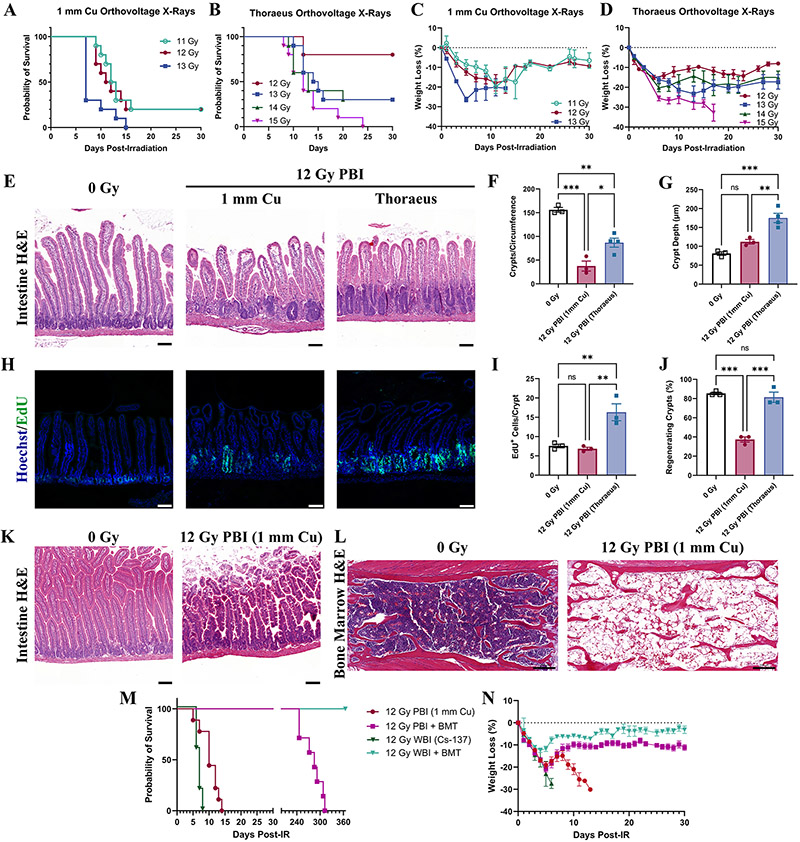
Radionuclide irradiators (137Cs and 60Co) are commonly used in preclinical studies ranging from cancer therapy to stem cell biology. Amidst concerns of radiological terrorism, there are institutional initiatives to replace radionuclide sources with lower energy X-ray sources. As researchers transition, questions remain regarding whether the biological effects of γ-rays may be recapitulated with orthovoltage X-rays because different energies may induce divergent biological effects. We therefore sought to compare the effects of orthovoltage X-rays with 1-mm Cu or Thoraeus filtration and 137Cs γ-rays using mouse models of acute radiation syndrome. Following whole-body irradiation, 30-day overall survival was assessed, and the lethal dose to provoke 50% mortality within 30-days (LD50) was calculated by logistic regression. LD50 doses were 6.7 Gy, 7.4 Gy, and 8.1 Gy with 1-mm Cu-filtered X-rays, Thoraeus-filtered X-rays, and 137Cs γ-rays, respectively. Comparison of bone marrow, spleen, and intestinal tissue from mice irradiated with equivalent doses indicated that injury was most severe with 1-mm Cu-filtered X-rays, which resulted in the greatest reduction in bone marrow cellularity, hematopoietic stem and progenitor populations, intestinal crypts, and OLFM4+ intestinal stem cells. Thoraeus-filtered X-rays provoked an intermediate phenotype, with 137Cs showing the least damage. This study reveals a dichotomy between physical dose and biological effect as researchers transition to orthovoltage X-rays. With decreasing energy, there is increasing hematopoietic and intestinal injury, necessitating dose reduction to achieve comparable biological effects.
Significance: Understanding the significance of physical dose delivered using energetically different methods of radiation treatment will aid the transition from radionuclide γ-irradiators to orthovoltage X-irradiators.
©2022 American Association for Cancer Research.
Conflict of interest statement
Conflict of Interest Disclosures
C.G. is a consultant for Varian Medical Systems and Janssen Pharmaceuticals and has received research support from Janssen Pharmaceuticals and Celldex Therapeutics. R.K. is co-founder of Ceramedix Holdings Inc. W.T. has received research support from Varian Medical Systems. The other authors declare no potential conflicts of interest.
Figures
Similar articles
-
Comparison of gamma and x-ray irradiation for myeloablation and establishment of normal and autoimmune syngeneic bone marrow chimeras.PLoS One. 2021 Mar 17;16(3):e0247501. doi: 10.1371/journal.pone.0247501. eCollection 2021. PLoS One. 2021. PMID: 33730087 Free PMC article.
-
Transitioning from Gamma Rays to X Rays for Comparable Biomedical Research Irradiations: Energy Matters.Radiat Res. 2020 Jun 1;193(6):506-511. doi: 10.1667/RADE-20-00039.1. Radiat Res. 2020. PMID: 32315248
-
Effect of Pseudomonas contamination or antibiotic decontamination of the GI tract on acute radiation lethality after neutron or gamma irradiation.Radiat Res. 1985 Dec;104(3):395-405. Radiat Res. 1985. PMID: 3909210
-
Replacement of 137Cs irradiators with x-ray irradiators.Health Phys. 2009 Feb;96(2 Suppl):S27-30. doi: 10.1097/01.HP.0000334555.78657.bc. Health Phys. 2009. PMID: 19125053
-
Deciding between an X-Ray and 137Cs Irradiator - It's not just about Energy Spectra.Radiat Res. 2019 Nov;192(5):493-506. doi: 10.1667/RR15395.1. Epub 2019 Sep 10. Radiat Res. 2019. PMID: 31502907
Cited by
-
Minimum Reporting Standards Should be Expected for Preclinical Radiobiology Irradiators and Dosimetry in the Published Literature.Radiat Res. 2023 Sep 1;200(3):217-222. doi: 10.1667/RADE-23-00119.1. Radiat Res. 2023. PMID: 37590483 Free PMC article. No abstract available.
-
Thrombopoietin mimetic stimulates bone marrow vascular and stromal niches to mitigate acute radiation syndrome.Stem Cell Res Ther. 2024 Apr 29;15(1):123. doi: 10.1186/s13287-024-03734-z. Stem Cell Res Ther. 2024. PMID: 38679747 Free PMC article.
-
Determination of Lethality Curve for Cobalt-60 Gamma-Radiation Source in Rhesus Macaques Using Subject-Based Supportive Care.Radiat Res. 2022 Dec 1;198(6):599-614. doi: 10.1667/RADE-22-00101.1. Radiat Res. 2022. PMID: 36279323 Free PMC article.
-
Gastrointestinal Acute Radiation Syndrome: Mechanisms, Models, Markers, and Medical Countermeasures.Radiat Res. 2024 Jun 1;201(6):628-646. doi: 10.1667/RADE-23-00196.1. Radiat Res. 2024. PMID: 38616048 Free PMC article.
-
Whole Abdominal Pencil Beam Scanned Proton FLASH Increases Acute Lethality.Int J Radiat Oncol Biol Phys. 2025 Feb 1;121(2):493-505. doi: 10.1016/j.ijrobp.2024.09.006. Epub 2024 Sep 18. Int J Radiat Oncol Biol Phys. 2025. PMID: 39299552 Free PMC article.
References
-
- Poirier Y, Belley MD, Dewhirst MW, Yoshizumi TT, Down JD, Poirier Y, et al. Transitioning from Gamma Rays to X Rays for Comparable Biomedical Research Irradiations: Energy Matters. RADIATION RESEARCH [Internet]. 2020. [cited 2022 Jan 5];193:506–11. - PubMed
-
- Nuclear Regulatory Commission. The 2018 Radiation Source Protection and Security Task Force Report. Washington, D.C.; 2018.
-
- Hall EricJ. The Relative Biological Efficiency of X Rays Generated at 220 kVp and Gamma Radiation from a Cobalt 60 Therapy Unit. The British Institute of Radiology ; 2014. [cited 2022 Jan 5];34:313–7. - PubMed
-
- Ting TP, Johns HE, Jaques LB. Relative Biological Effectiveness of Betatron and Conventional X-Radiation on the Regression of Mouse Tumours. Nature 1952. 170:4331 [Internet]. Nature Publishing Group; 1952 [cited 2022 Jan 30];170:752-3. - PubMed
-
- Sugiura K. The Biological Measurement of Gamma Rays in “Equivalent Roentgens” with Mouse Sarcoma 180 as the Test Object. The American Journal of Cancer [Internet]. American Association for Cancer Research Journals; 1939. [cited 2022 Jan 30];37:445–52.
Publication types
MeSH terms
Substances
Grants and funding
- U01 AI138324/AI/NIAID NIH HHS/United States
- R01 CA198095/CA/NCI NIH HHS/United States
- U01 AI133608/AI/NIAID NIH HHS/United States
- U24 DK085532/DK/NIDDK NIH HHS/United States
- P30 CA008748/CA/NCI NIH HHS/United States
- U01 DK103155/DK/NIDDK NIH HHS/United States
- S10 OD026852/OD/NIH HHS/United States
- U01 DK085532/DK/NIDDK NIH HHS/United States
- R01 CA257509/CA/NCI NIH HHS/United States
- S10 OD019961/OD/NIH HHS/United States
- R01 AG057429/AG/NIA NIH HHS/United States
- R01 CA226861/CA/NCI NIH HHS/United States
- P30 CA013330/CA/NCI NIH HHS/United States
- U01 AI133598/AI/NIAID NIH HHS/United States
- S10 OD026833/OD/NIH HHS/United States
LinkOut - more resources
Full Text Sources
Research Materials
Miscellaneous
