. 2022 Aug 10;289(1980):20220581.
doi: 10.1098/rspb.2022.0581. Epub 2022 Aug 3.

A tale of two plasmids: contributions of plasmid associated phenotypes to epidemiological success among Shigella

Affiliations

A tale of two plasmids: contributions of plasmid associated phenotypes to epidemiological success among Shigella

P Malaka De Silva et al. Proc Biol Sci. .

Abstract

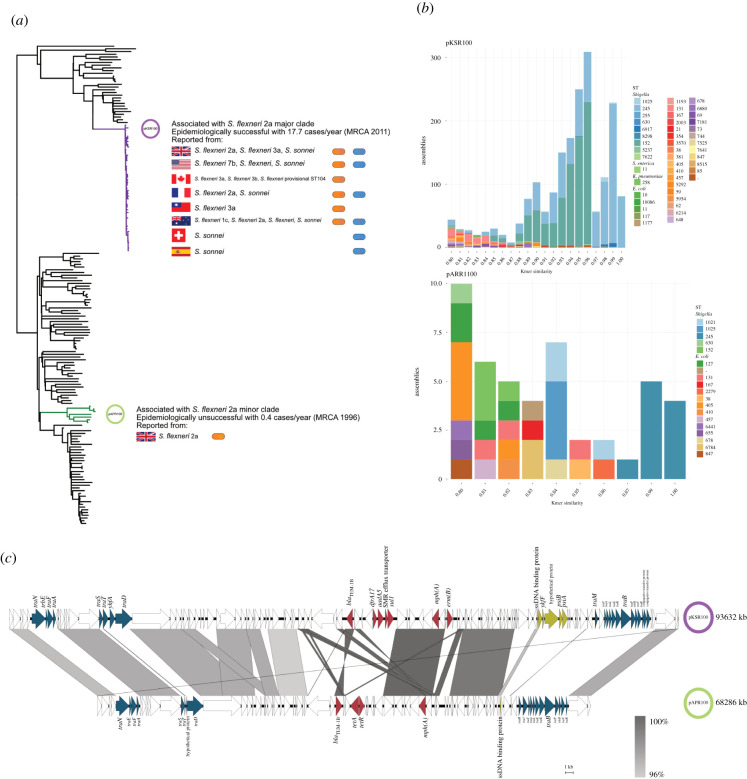
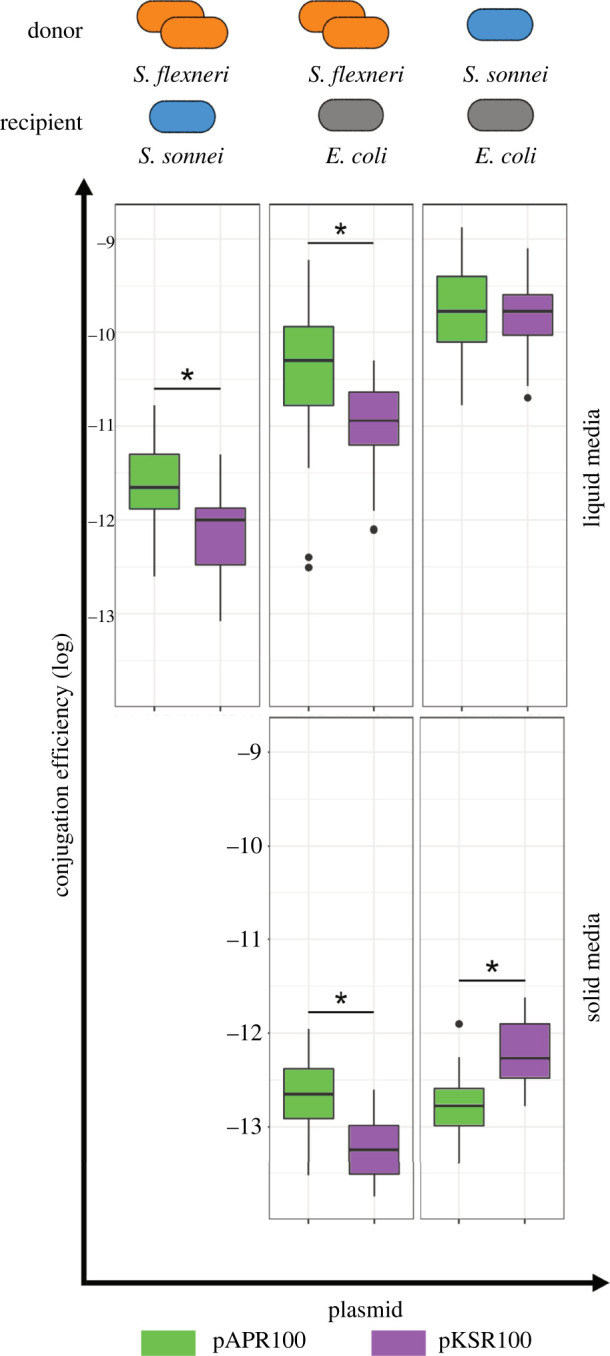
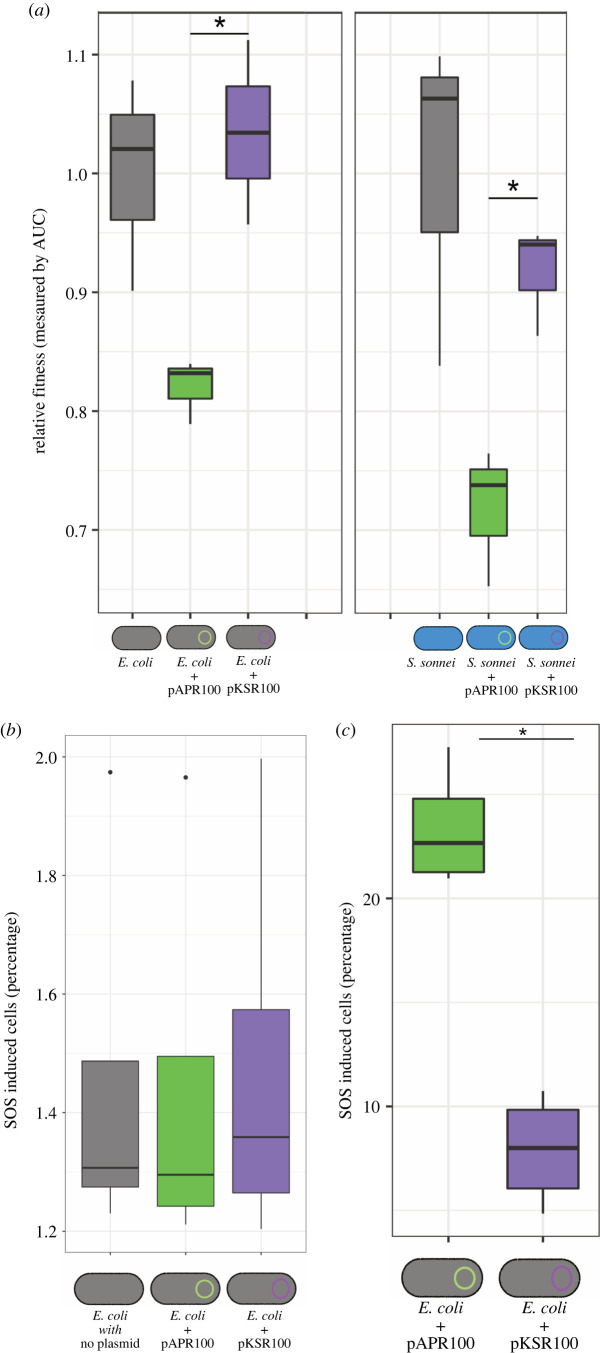
Dissemination of antimicrobial resistance (AMR) genes by horizontal gene transfer (HGT) mediated through plasmids is a major global concern. Genomic epidemiology studies have shown varying success of different AMR plasmids during outbreaks, but the underlying reasons for these differences are unclear. Here, we investigated two Shigella plasmids (pKSR100 and pAPR100) that circulated in the same transmission network but had starkly contrasting epidemiological outcomes to identify plasmid features that may have contributed to the differences. We used plasmid comparative genomics to reveal divergence between the two plasmids in genes encoding AMR, SOS response alleviation and conjugation. Experimental analyses revealed that these genomic differences corresponded with reduced conjugation efficiencies for the epidemiologically successful pKSR100, but more extensive AMR, reduced fitness costs, and a reduced SOS response in the presence of antimicrobials, compared with the less successful pAPR100. The discrepant phenotypes between the two plasmids are consistent with the hypothesis that plasmid-associated phenotypes contribute to determining the epidemiological outcome of AMR HGT and suggest that phenotypes relevant in responding to antimicrobial pressure and fitness impact may be more important than those around conjugation in this setting. Plasmid phenotypes could thus be valuable tools in conjunction with genomic epidemiology for predicting AMR dissemination.

Keywords: antimicrobial resistance; bacterial SOS response; conjugation; plasmid fitness cost.


Conflict of interest statement

Authors declare no competing interests

Figures

Figure 1.
Figure 1.
Relative epidemiological success and comparative genomics of pKSR100 and pAPR100. The disparate epidemiological success of pKSR100- and pAPR100- bearing clades in a cross section of 179 Shigella isolates from UK surveillance data between 2008 and 2014 [26]. The pKSR100-bearing major clade is highlighted in purple and the pARP100-bearing minor clade is highlighted in green (a). The pKSR100 associated major clade had a higher case rate despite a more recent MRCA (most recent common ancestor) compared to the lower case rate and older MRCA of the minor clade, highlighting the more rapid spread of the major clade through the UK. The information alongside the clades depict the disparate global and species distribution of other pKSR100 bacterial hosts being reported in multiple countries across multiple Shigella subtypes (as determined by BLASTn against the NCBI non-redundant database and literature review). pKSR100 and pKSR100-like plasmids have been detected in and reported from eight countries and in multiple Shigella subtypes. By contrast, pAPR100 has only been detected in S. flexneri 2a in the UK. (b) Species and sequence type distribution of genomes sharing kmer similarities of greater than 0.80 with pKSR100 or pAPR100 from across greater than 600 000 publicly available bacterial genomes (in the 661 K COBS data structure). (c) Comparison of the genetic content of both plasmids. Areas of synteny (using a cut-off of 95% BLAST identity) are shown intervening grey bars coloured according to the inlaid legend. Regions with variation between the two plasmids are broadly categorized into three main groups; (i) conjugation machinery related (blue), (ii) SOS response alleviation related (green) and (iii) AMR related (red). (Online version in colour.)
Figure 2.
Figure 2.
Conjugation efficiencies of pKSR100 and pAPR100 among different donors, recipients and media conditions. Different donor strains included native S. flexneri hosts (orange) and clinical isolate S. sonnei 216 as an isogenic donor (blue) while the recipient strains were either E. coli MG1655 (in grey) or S. sonnei 216 (in blue). Results for each plasmid are coloured according to the inlaid key. Results from liquid media are shown upper while solid is shown lower. Each box plot represents the combined results of all the time points used in LM models, where there are 12 replicates (four biological, three technical) for each time point. The asterisks denote significance as determined LMs. The p-values for each of the panels from left to right are as follows: top row, p = 0.043, p < 0.000; bottom row, p = 0.026, p = 0.025. Note: conjugations between S. flexneri donors and S. sonnei recipients are not shown here as no transconjugants were recovered until 3 h after mating, making it difficult to control for the growth rates of strains involved. Therefore, our main claims are based on liquid media conjugations where first transconjugants were recovered within 15 min of mating. (Online version in colour.)
Figure 3.
Figure 3.
Relative fitness cost and SOS response induction during conjugation and antimicrobial exposure of pKSR100 and pAPR100. (a) Relative fitness of E. coli MG1655 (grey icons) and S. sonnei 216 (blue icons) carrying either pKSR100 (purple) or pAPR100 (green) compared to plasmid-free wild-type (grey bars in the graph). Asterisks denote significance where p = 0.01071 for E. coli strains and p = 0.009971 for S. sonnei strains as determined by two sample t-test. (b,c) SOS response levels by plasmid as a proportion of cells in which SOS is induced (measured by GFP expression using a reporter plasmid, see methods) during conjugation (b) and following a 2 h exposure to sub-inhibitory concentrations of ciprofloxacin (c). Individual box plots represent the median, range and IQR of four independent biological replicate data points adjusted to a negative control for each replicate (see methods, electronic supplementary material, figure S3). No statistically significant difference was observed between the two plasmids during conjugation (p = 0.7864), but there was a marked level of SOS response alleviation in cells carrying pKSR100 (p = 0.000237) as determined by a two-sample t-test. (Online version in colour.)

References

    1. Frost LS, Leplae R, Summers AO, Toussaint A. 2005. Mobile genetic elements: the agents of open source evolution. Nat. Rev. Microbiol. 3, 722-732. (10.1038/nrmicro1235) - DOI - PubMed
    1. Norman A, Hansen LH, Sorensen SJ. 2009. Conjugative plasmids: vessels of the communal gene pool. Phil. Trans. R. Soc. B 364, 2275-2289. (10.1098/rstb.2009.0037) - DOI - PMC - PubMed
    1. Wang R, et al. 2018. The global distribution and spread of the mobilized colistin resistance gene mcr-1. Nat. Commun. 9, 1179. (10.1038/s41467-018-03205-z) - DOI - PMC - PubMed
    1. Liu Y-Y, et al. 2016. Emergence of plasmid-mediated colistin resistance mechanism MCR-1 in animals and human beings in China: a microbiological and molecular biological study. Lancet Infect. Dis. 16, 161-168. (10.1016/S1473-3099(15)00424-7) - DOI - PubMed
    1. Snesrud E, He S, Chandler M, Dekker JP, Hickman AB, Mcgann P, Dyda F. 2016. A model for transposition of the colistin resistance gene mcr-1 by ISApl1. Antimicrob. Agents Chemother. 60, 6973-6976. (10.1128/AAC.01457-16) - DOI - PMC - PubMed

Publication types

MeSH terms

Substances