

TOP3A amplification and ATRX inactivation are mutually exclusive events in pediatric osteosarcomas using ALT
- PMID: 35920001
- PMCID: PMC9549729
- DOI: 10.15252/emmm.202215859
TOP3A amplification and ATRX inactivation are mutually exclusive events in pediatric osteosarcomas using ALT
Abstract
In some types of cancer, telomere length is maintained by the alternative lengthening of telomeres (ALT) mechanism. In many ALT cancers, the α-thalassemia/mental retardation syndrome X-linked (ATRX) gene is mutated leading to the conclusion that the ATRX complex represses ALT. Here, we report that most high-grade pediatric osteosarcomas maintain their telomeres by ALT, and that the majority of these ALT tumors are ATRX wild-type (wt) and instead carry an amplified 17p11.2 chromosomal region containing TOP3A. We found that TOP3A was overexpressed in the ALT-positive ATRX-wt tumors consistent with its amplification. We demonstrated the functional significance of these results by showing that TOP3A overexpression in ALT cancer cells countered ATRX-mediated ALT inhibition and that TOP3A knockdown disrupted the ALT phenotype in ATRX-wt cells. Moreover, we report that TOP3A is required for proper BLM localization and promotes ALT DNA synthesis in ALT cell lines. Collectively, our results identify TOP3A as a major ALT player and potential therapeutic target.
Keywords: ATRX; TOP3A; alternative lengthening of telomeres; osteosarcomas; telomeres.
© 2022 The Authors. Published under the terms of the CC BY 4.0 license.
Figures
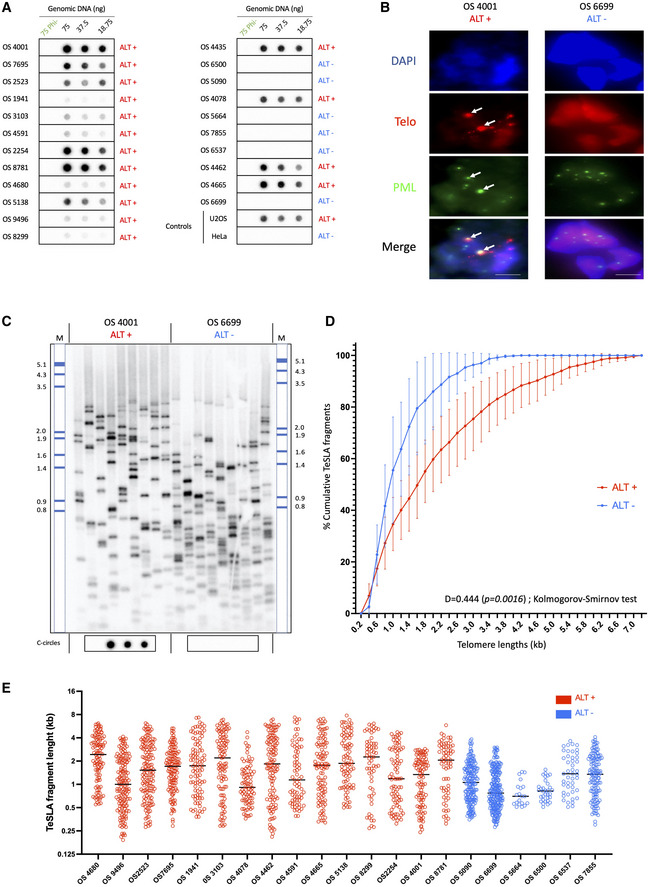
C‐circle assay for tumor samples. The presence of C‐circles was tested in 22 osteosarcomas by Rolling Circle Amplification (RCA) assay using Φ29 DNA polymerase. Φ29 DNA polymerase negative controls and Φ29 DNA polymerase‐based reactions starting, respectively, with 75, 37.5, and 18.75 ng of DNA were applied to dot blots and C‐circles were detected by hybridization with a 32P‐(CCCTAA)4 telomeric probe. U2OS and HeLa cells correspond to positive and negative control samples, respectively.
Representative images of telomere fluorescence in‐situ hybridization (FISH; red) and promyelocytic leukemia (PML) immunofluorescence IF (green) colocalizations (ALT‐associated PML body [APBs]) in osteosarcoma tumor samples. DNA is counterstained blue with DAPI. APBs are indicated by white arrows. Scale bars are 5 μm.
Representative image of telomere shortest length assay (TeSLA) Southern Blot of two representative samples of ALT‐positive (left) and telomerase‐positive (right) osteosarcomas. Nine TeSLA polymerase chain reactions (PCRs; 30 pg each reaction) were done for each DNA sample. DIG‐labeled MW ladder has been added a posteriori.
Plot of cumulative TeSLA fragment sizes (in kb) in ALT‐positive (n = 16) and ALT‐negative (n = 6) osteosarcomas. Points and error bars (±SEM) represent cumulative percentage of TeSLA fragments from all the TeSLA PCRs (n = 9 per tumor sample) from all the patients in both groups (n = 16 in ALT‐positive group, and n = 6 in ALT‐negative group). The Kolmogorov–Smirnov test was applied to identify statistical differences in TeSLA fragments distributions (P = 0.0016).
Individual TeSLa fragment lengths in ALT‐positive (n = 16) and ALT‐negative (n = 6) osteosarcomas. Each dot represents a TeSLA fragment, bars represent the median value for individual patient's samples.
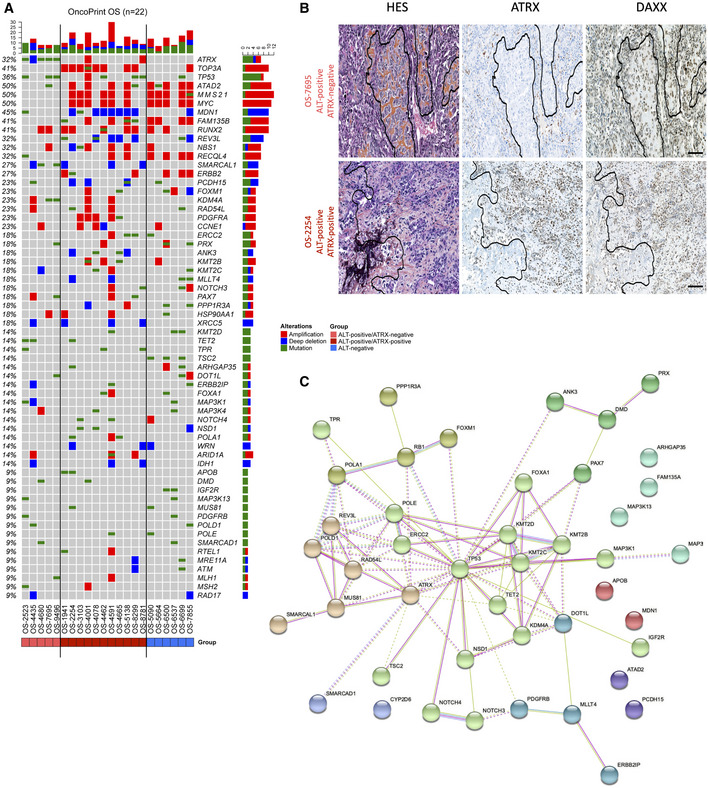
Oncoprint graph showing the distribution of mutations (green rectangles) and copy number variations (red rectangle, amplification; blue rectangle, copy loss) in all samples. Tumors are distributed according to ALT positivity (ALT+) or ALT negativity (ALT−) and ATRX status (ATRX‐mutated or ATRX‐wt).
Tissue sections of two representative high‐grade osteosarcomas with hematoxylin eosin saffron (HES) staining (left panel), anti‐ATRX (HPA064684) immunochemistry (middle panel), and anti‐DAXX (HPA008736) immunochemistry (right panel), showing ATRX protein expression in two ALT‐positive samples. In the top panel, intratumoral ATRX expression is negative (positive control osteoclasts are shown). In the bottom panel, intratumoral ATRX expression is high. Scale bars are 250 μm.
STRING network showing mutated gene‐clusters with related functions.
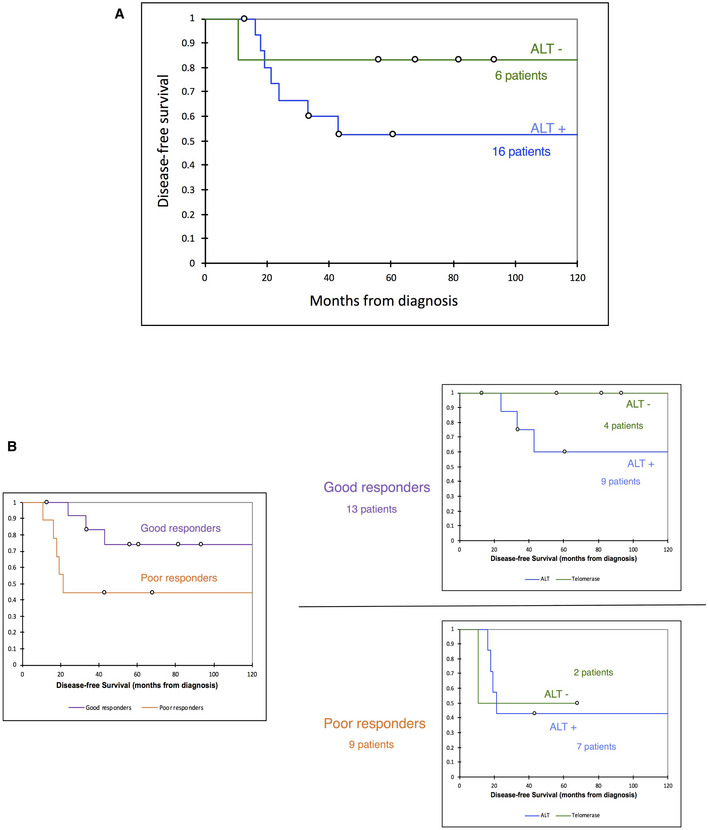
Disease‐free survival curves of patients with ALT‐positive and ALT‐negative tumors.
Disease‐free survival curves of good and poor responders to neoadjuvant chemotherapy (left panel), then dichotomized according to ALT status of tumors (right panel).
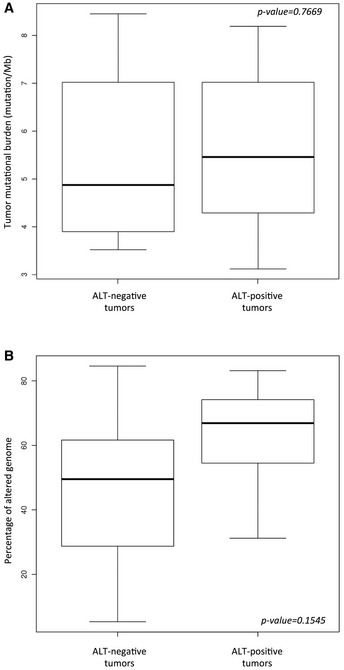
Tumor mutational burden in ALT‐negative (n = 6) and ALT‐positive (n = 16) tumors. Box‐and‐whisker plot were defined with default parameters by median value (central band at the 50th percentile), interquartile ranges (IQR, box limited by 25th and 75th percentile) and whisker boundaries defined by minimum and maximum value. Wilcoxon test was used to compare modalities.
Percentage of altered genome using array‐comparative genomic hybridization (aCGH) in ALT‐negative (n = 6) and ALT‐positive (n = 16) tumors. Box‐and‐whisker plot were defined with default parameters by median value (central band at the 50th percentile), interquartile ranges (IQR, box limited by 25th and 75th percentile) and whisker boundaries defined by minimum and maximum value. Wilcoxon test was used to compare modalities.
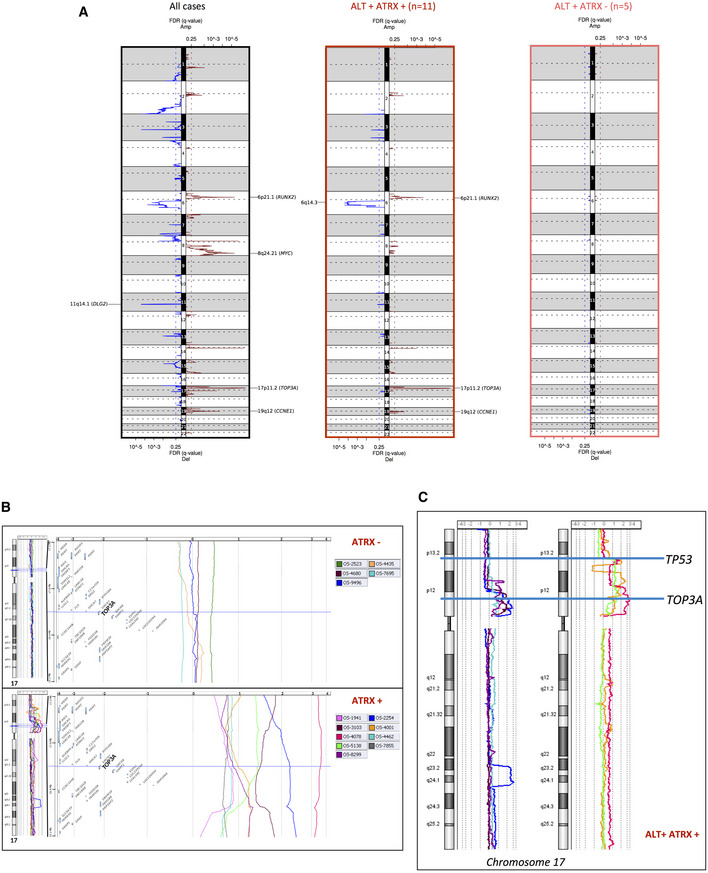
Copy number alteration (CNA) profiles of osteosarcomas. Representation of the GISTIC analysis with false discovery rate (FDR (q‐value)) for all cases (n = 22; left panel), ALT‐positive/ATRX wild‐type (wt) cases (n = 11; middle panel), and ALT‐positive/ATRX‐mutated cases (n = 5; right panel).
Gain/amplification of TOP3A gene region (17p11) is a genomic signature of ATRX‐wt osteosarcomas. For each ATRX‐mutated (top part) and ATRX‐wt (bottom part) case, from the left to the right, the chromosome 17 and regional genomic profiles were established, with CGH Analytics software. A focus was made within the genomic interval (17.25–19.11 Mb) of the short arm of chromosome 17 (hg38 human genome mapping; Build 38 from NCBI, December 2013 version) including TOP3. Color profiles corresponding to the different tumors are defined at the top of each group. Most ATRX‐wt cases show gain or amplification of this region (bottom part), whereas no ATRX‐mutated cases display this alteration (top part).
Chromosome 17 copy number variation analysis showing amplification/gain of the TOP3A region that do not extend into the TP53 gene in ALT ATRX‐wt tumors (left panel), and amplification of the TOP3A region for which TP53 region is at the edge of the amplification/gain in ALT‐positive ATRX‐wt tumors (right panel).
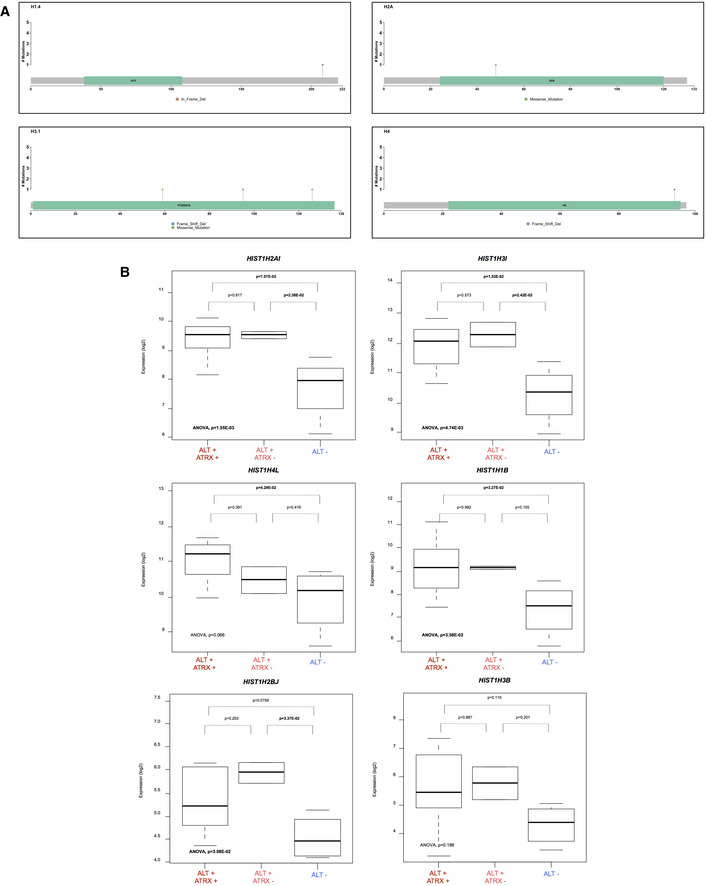
Lollipop plots of H1.4, H2A, H3.1, and H4 genes showing histone mutations detected by tNGS.
Expression of histone genes according to ALT and ATRX status: ALT+/ATRX+ (n = 7), ALT+/ATRX− (n = 2) et ALT− (n = 3). Box‐and‐whisker plot were defined with default parameters by median value (central band at the 50th percentile), and interquartile ranges (IQR, box limited by 25th and 75th percentile) and whisker boundaries were defined by minimum and maximum value. An ANOVA statistical test, and Tukey's range test were used to compare modalities.
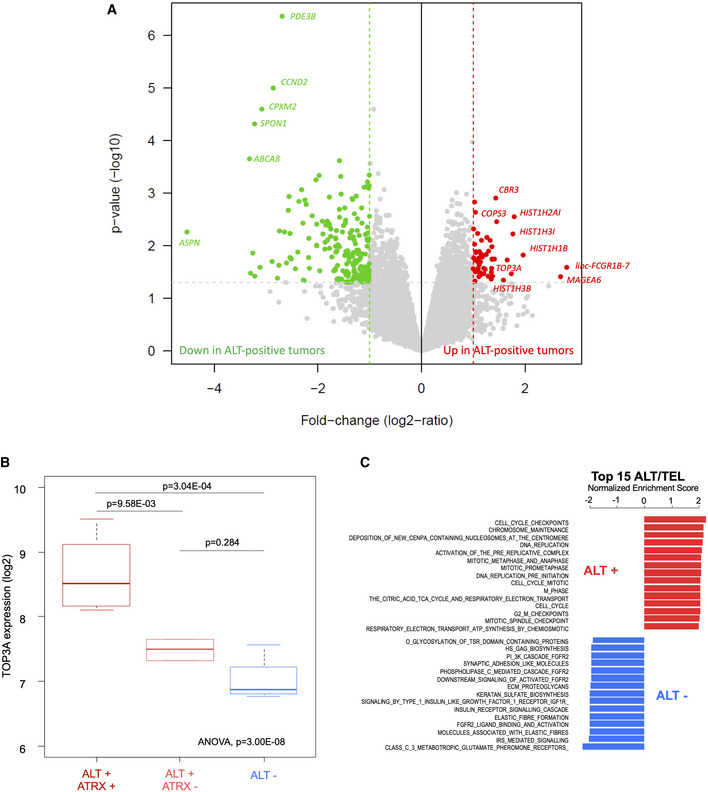
Volcano plot of the supervised analysis of mRNA expression profiles of osteosarcomas according to ALT‐positive vs. ALT‐negative samples, showing upregulated (in red) and downregulated (in green) genes. In all, 12 tumors had sufficient RNA quality to be analyzed: seven ALT‐positive ATRX‐wt, two ALT‐positive/ATRX‐mutated and three ALT‐negative.
TOP3A gene expression according to ALT and ATRX status: ALT+/ATRX‐wt (n = 7), ALT+/ATRX‐mut (n = 2) and ALT− (n = 3). Box‐and‐whisker plot was defined with default parameters by median value (central band at the 50th percentile), interquartile ranges (IQR, box limited by 25th and 75th percentiles) and whisker boundaries defined by minimum and maximum value. An ANOVA statistical test and Tukey's range test were used to compare modalities.
Normalized enrichment score bar plot of top 15 significant REACTOME gene sets according to ALT‐positive vs. ALT‐negative GSEA analysis. Ontologies associated with ALT positivity are in red and those associated with ALT negativity are in blue.
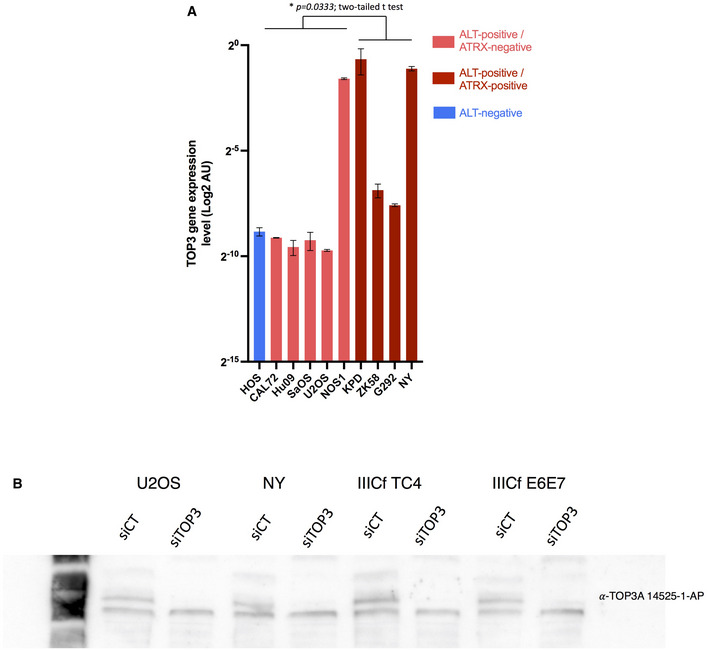
TOP3A expression (by RT‐qPCR) in human osteosarcoma cell lines. Mean expression level of three technical replicates; error bars represent the mean ± SEM.
TOP3A Western blots validating siRNA knockdowns in the indicated cell lines (U2OS, NY, IIIcf TC4, IIICf E6E7).
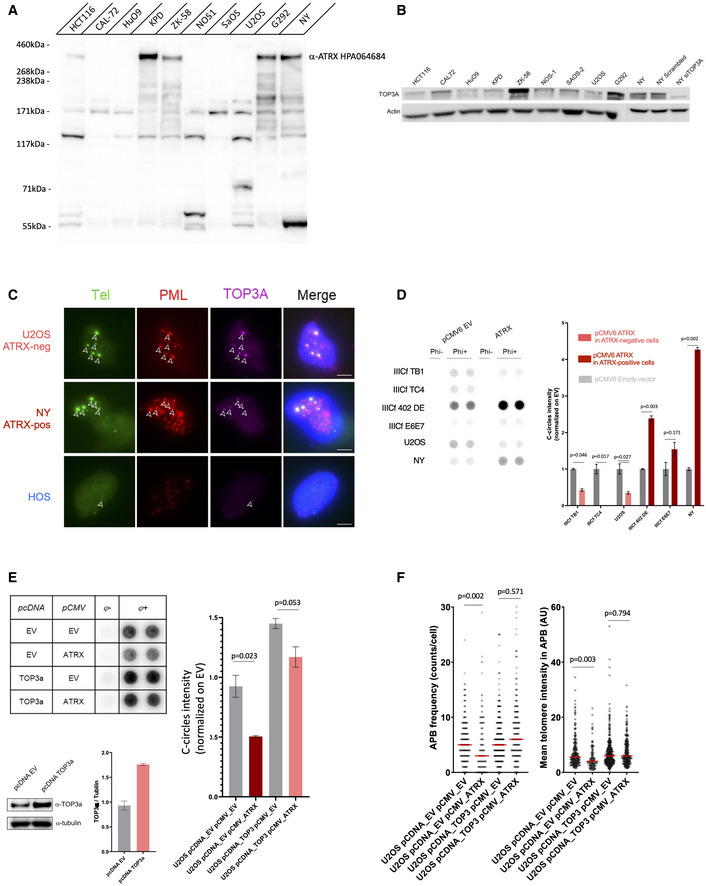
Western blot showing ATRX protein expression in nine osteosarcoma cell lines and HTC116 as positive control.
Western blot showing TOP3A protein expression in nine osteosarcoma cell lines and NY siTOP3A as control.
Telomere fluorescence in‐situ hybridization (FISH; green), and promyelocytic leukemia (PML; red) and TOP3A (purple) immunofluorescence (IF), showing TOP3A localization at APBs in both ATRX‐wt and ATRX‐mutated ALT‐positive cells. TOP3A foci are indicated by white arrows. Scale bars are 5 μm.
C‐circle assay showing inverse effect of ATRX ectopic expression on C‐circle levels in ATRX‐mutated and ATRX‐wt cell lines. Error bars represent the mean ± SEM from n = 2 experiments, n.s. = non‐significant, *P < 0.05, Mann–Whitney test.
C‐circle assay showing rescue of ATRX ectopic expression by TOP3A overexpression in U2OS osteosarcoma cells. Error bars represent the mean ± SEM from n = 2 experiments, n.s. = non‐significant, *P < 0.05, Mann–Whitney test. Western blot and quantification of TOP3A expression is shown for U2OS cells overexpressing TOP3A.
ALT‐associated PML body (APB) frequency and mean telomeric DNA intensity in APBs according to TOP3A overexpression and ATRX transient expression; n = 150 cells scored per treatment, n.s., non‐significant, *P < 0.05; Mann–Whitney test.
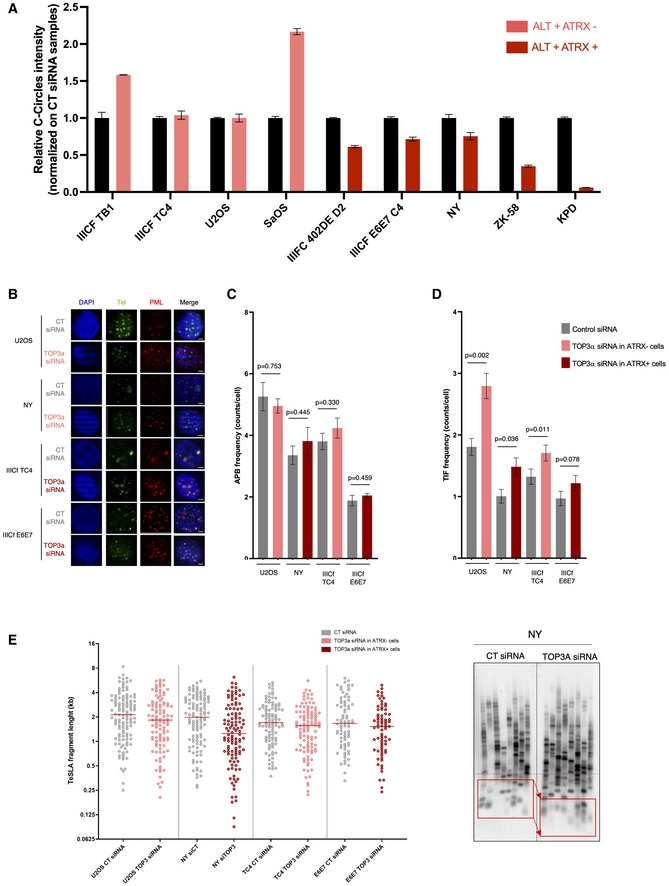
Relative C‐circle intensity according to
TOP3A KD inALT ‐positiveATRX ‐mutated orATRX wild‐type (wt) cell lines. Error bars represent the mean ±SEM from n = 2 experiments.Representative images of telomeric
DNA (green) and promyelocytic leukemia(PML) protein (red) colocalizations (ALT‐associated PML body[APBs] ) in osteosarcoma and in vitro‐immortalizedATRX ‐mutated orATRX ‐wt cell lines according toTOP3A KD . Scale bars are 5 μm.Quantification of
APB frequency in osteosarcoma and in vitro‐immortalizedATRX ‐mutated orATRX ‐wt cell lines according toTOP3A KD ; Error bars represent the mean ±SEM from n = 3 experiments, n = 150 cells scored per treatment, n.s., non‐significant; Mann–Whitney test.Effect of
TOP3A KD on telomeredysfunction‐induced foci (TIFs ) in osteosarcoma and in vitro‐immortalized cell lines; Error bars represent the mean ±SEM from n = 3 experiments, n = 150 cells scored per treatment, *P < 0.05, **P < 0.005; Mann–Whitney test.Distributions of telomere shortest length assay
(TeSLA) fragments in osteosarcoma and in vitro‐immortalizedATRX ‐mutated orATRX ‐wt cell lines according toTOP3A KD (left panel; each dot represents aTeSLA fragment), and representativeTeSLA Southern Blot image forNY (right panel).
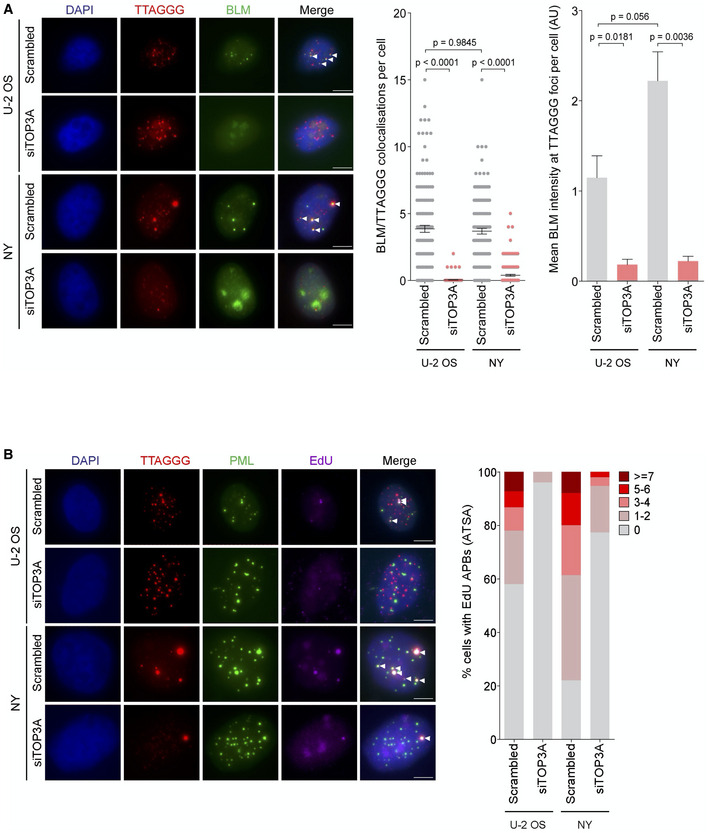
Fluorescence in‐situ hybridization
‐ immunofluorescence (FISH‐IF) of telomeres (in red) andBLM (in green) inTOP3A ‐depleted cellsBLM foci at telomeres are indicated by white arrows. Error bars represent the mean ±SEM from n = 3 experiments, n = 150 cells scored per treatment, n.s. = non‐significant, **P < 0.01, Mann–Whitney test. Scale bars are 5 μm.ATSA assay assessingALT ‐mediated telomericDNA synthesis (telomere in red,EdU in purple) in promyelocytic leukemia(PML; in green) according toTOP3A KD .EdU signal atAPB (telomere/PML ) are indicated by white arrows. Approximately 150 cells were divided into five groups (0, 1–2, 3–4, 5–6n, and ≥ 7) based on the number ofEdU +APBs . Scale bars are 5 μm.
References
-
- Adélaïde J, Finetti P, Bekhouche I, Repellini L, Geneix J, Sircoulomb F, Charafe‐Jauffret E, Cervera N, Desplans J, Parzy D et al (2007) Integrated profiling of basal and luminal breast cancers. Cancer Res 67: 11565–11575 - PubMed
-
- Bayani J, Zielenska M, Pandita A, Al‐Romaih K, Karaskova J, Harrison K, Bridge JA, Sorensen P, Thorner P, Squire JA (2003) Spectral karyotyping identifies recurrent complex rearrangements of chromosomes 8, 17, and 20 in osteosarcomas. Genes Chromosomes Cancer 36: 7–16 - PubMed
Publication types
MeSH terms
Substances
LinkOut - more resources
Full Text Sources
Molecular Biology Databases
