Elp3-mediated codon-dependent translation promotes mTORC2 activation and regulates macrophage polarization
- PMID: 35920020
- PMCID: PMC9475509
- DOI: 10.15252/embj.2021109353
Elp3-mediated codon-dependent translation promotes mTORC2 activation and regulates macrophage polarization
Abstract
Macrophage polarization is a process whereby macrophages acquire distinct effector states (M1 or M2) to carry out multiple and sometimes opposite functions. We show here that translational reprogramming occurs during macrophage polarization and that this relies on the Elongator complex subunit Elp3, an enzyme that modifies the wobble uridine base U34 in cytosolic tRNAs. Elp3 expression is downregulated by classical M1-activating signals in myeloid cells, where it limits the production of pro-inflammatory cytokines via FoxO1 phosphorylation, and attenuates experimental colitis in mice. In contrast, alternative M2-activating signals upregulate Elp3 expression through a PI3K- and STAT6-dependent signaling pathway. The metabolic reprogramming linked to M2 macrophage polarization relies on Elp3 and the translation of multiple candidates, including the mitochondrial ribosome large subunit proteins Mrpl3, Mrpl13, and Mrpl47. By promoting translation of its activator Ric8b in a codon-dependent manner, Elp3 also regulates mTORC2 activation. Elp3 expression in myeloid cells further promotes Wnt-driven tumor initiation in the intestine by maintaining a pool of tumor-associated macrophages exhibiting M2 features. Collectively, our data establish a functional link between tRNA modifications, mTORC2 activation, and macrophage polarization.
Keywords: Elp3; mTORC2; macrophage polarization; mitochondrial translation; tRNA modifications.
© 2022 The Authors. Published under the terms of the CC BY 4.0 license.
Figures
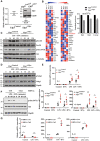
- A
Generation of myeloid cells genetically inactivated for Elp3. Elp3 mRNA and protein levels were assessed by Real‐Time PCR with extracts isolated from peritoneal macrophages of Elp3 Control and Elp3 ΔMye mice. mRNA levels in Elp3Control mice were set to 1 and levels in other experimental conditions were relative to that after normalization with Gapdh mRNA levels (n = 3 mice; mean ± SD, Student t‐test, ***P < 0.001). An anti‐Elp3 western blot (WB) is also illustrated. The anti‐Gapdh blot is shown for normalization purposes.
- B
Myeloid cells lacking Elp3 show decreased levels of mcm5S2 U34 tRNA modifications. Multiple tRNA modifications in BMDMs from both Elp3 Control and Elp3 ΔMye mice were quantified by Mass Spectrometry (see Methods for details).
- C, D
Defective mTORC2 signaling upon Elp3 deficiency in myeloid cells. Peritoneal macrophages from Elp3 Control and Elp3 ΔMye mice were isolated and cultured ex‐vivo. They were untreated or stimulated with a combination of LPS (100 ng/ml) and IFNγ (50 ng/ml) for the indicated periods of time and the resulting cell extracts were subjected to WB analyses.
- E
Enhanced mRNA levels of pro‐inflammatory cytokines upon Elp3 inactivation in myeloid cells subjected to LPS or to both LPS and IFNγ stimulations. Peritoneal macrophage from Elp3 Control or Elp3 ΔMye mice were unstimulated (« Control ») or treated with IFNγ (50 ng/ml), LPS (100 ng/ml) or with both IFNγ and LPS for 24 h and the resulting mRNAs of the listed pro‐inflammatory cytokines were assessed by Real Time PCR. mRNA levels in Elp3 Control mice were set to 1 and levels in other experimental conditions were relative to that after normalization with Gapdh mRNA levels (n = 6 mice; mean ± SD, Student t‐test, **P < 0.01, *P < 0.05).
- F
mTORC2 activation by M1 polarization signals relies on Ctu2. Control and Ctu2‐depleted bone marrow‐derived macrophages (BMDMs; SiRNA‐mediated depletions) were treated or not with IFNγ (50 ng/ml) and LPS (100 ng/ml) and the resulting cell extracts were subjected to WB analyses.
- G
Ctu2 deficiency potentiates M1 macrophage polarization. Control and Ctu2‐depleted BMDMs were treated or not with IFNγ (50 ng/ml) and LPS (100 ng/ml) for 24 h and the resulting mRNAs of the listed pro‐inflammatory cytokines were assessed by Real Time PCR. mRNA levels in control BMDMs were set to 1 and levels in other experimental conditions were relative to that after normalization with Gapdh mRNA levels. Experiments were conducted in triplicates (mean ± SD, Student t‐test, *P < 0.05, **P < 0.01, ***P < 0.001).
- A, B
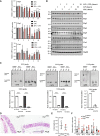
M1 polarization signals downregulate the expression of tRNA‐modifying enzymes at both mRNA (A) and protein (B) levels. Peritoneal macrophages were untreated or stimulated with IFNγ (50 ng/ml), LPS (100 ng/ml) or with both IFNγ and LPS ex‐vivo for the indicated periods of time and mRNA levels of the indicated candidates were assessed in all experimental conditions by Real‐Time PCR (A). mRNA levels in unstimulated cells were set to 1 and levels in other experimental conditions were relative to that after normalization with Gapdh mRNA levels (n = 3 mice; mean ± SD, Student t‐test, *P < 0.05; **P < 0.01; ***P < 0.001). Protein levels (B) were assessed by western blot analyses using the indicated antibodies.
- C
BMDMs and intestinal epithelial cells (IECs) lacking Elp3 show decreased thiolated tRNA levels. Northern blots were carried out with enriched small RNAs extracted from BMBMs of Elp3 Control and Elp3 ΔMye mice or with total RNAs from IECs of Elp3 Control and Elp3 ΔIEC mice, using the indicated probes. Values are from three independent measurements (mean ± SD, ****P < 0.0001, Welch one‐way Anova test).
- D
Elp3 expression in myeloid cells is dispensable in the architecture of intestinal crypts. Colons from both Elp3 Control and Elp3 ΔMye mice were subjected to IHC analyses.
- E
Colon length is not altered upon Elp3 deficiency in myeloid cells. Data at day 6 from 8 mice per group are illustrated (mean ± SD, Student t‐test, nonsignificant).
- F
mRNA levels of pro‐inflammatory cytokines in peritoneal macrophages lacking Elp3 do not change in unstimulated mice. mRNAs of the listed pro‐inflammatory cytokines in peritoneal macrophage from Elp3 Control or Elp3 ΔMye mice were assessed by Real Time PCR. mRNA levels in Elp3 Control mice were set to 1 and levels in other experimental conditions were relative to that after normalization with Gapdh mRNA levels (n = 5 mice; mean ± SD, nonsignificant).
- A
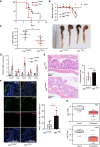
Decreased survival of mice lacking Elp3 expression in myeloid cells upon DSS administration (n = 10 mice per genotype; mean ± SD, Student t‐test, *P < 0.05).
- B, C
Elp3 deficiency in myeloid cells exacerbates the weight loss and the decrease of colon length upon DSS administration (n = 7 mice; mean ± SD, **P < 0.01).
- D
Elp3 deficiency in myeloid cells potentiates the production of cytokines and chemokines upon DSS administration. mRNA levels of the indicated candidates in Elp3 Control mice were set to 1 and levels in other experimental conditions were relative to that after normalization with Gapdh mRNA levels (n = 5 mice per genotype; mean ± SD, Student t‐test, *P < 0.05, **P < 0.01, ***P < 0.001).
- E
More severe histological score in mice lacking Elp3 in myeloid cells upon DSS administration. Representative intestinal crypts from the indicated genotypes are illustrated. The histological score was established as described in methods (n = 5 mice per genotype; mean ± SD, Student t‐test, *P < 0.05).
- F
Increased infiltration of iNOS+/CD68+ cells upon DSS administration in Elp3 ΔMye mice. The percentage of iNOS+ in CD68+ cells was established in both genotypes treated with DSS (n = 7 mice per genotype; mean ± SD, Student t‐test, **P < 0.01). Anti‐iNOS and ‐CD68 immunofluorescence analyses carried out in intestinal crypts from both genotypes are illustrated.
- G
Patients suffering from ulcerative colitis (UC) show reduced levels of both Elp1 and Elp3. The central band represents the mean value of relative expression in the investigated cohort. Boxes represent 75th and 25th percentile. Whiskers represent maximum and minimum values before the upper and lower fence, respectively (**P < 0.01, ***P < 0.001; GSE9452‐GEO DataSets, Definition of an ulcerative colitis preinflammatory state).
- A
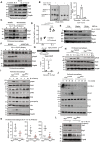
IL‐4 and IL‐13 induce the expression of tRNA‐modifying enzymes in macrophages. Peritoneal macrophages were untreated (« Control ») or stimulated with IL‐4 (10 ng/ml), IL‐13 (10 ng/ml) or with both cytokines for 24 h and cell extracts from the resulting cells were subjected to WB analyses.
- B
The pool of thiolated tRNAs in macrophages is enhanced by IL‐4/IL‐13 but decreased by LPS/IFNγ. On the left, Northern blot analysis assessing t:Q(UUG) tRNA thiolation in Thioglycollate‐elicited peritoneal macrophages subjected to the indicated treatments for 24 h. On the right, quantification of t:Q(UUG) tRNA thiolation, calculated as the ration of thiolated over nonthiolated t:Q(UUG), in the indicated experimental conditions.
- C
Elp3 induction by IL‐4/IL‐13 occurs through a PI3K‐dependent pathway. Peritoneal macrophages were pretreated with DMSO (control vehicle) or with Wortmannin (200 nM) for 1 h and subsequently left untreated or stimulated with IL‐4 (10 ng/ml)/IL‐13 (10 ng/ml) for the indicated periods of time. Cell extracts from the resulting cells were subjected to WB analyses.
- D
PI3K inhibition does not impact on Elp3 mRNA levels. Peritoneal macrophages were pretreated with DMSO (control vehicle) or with Wortmannin (200 nM) for 1 h and subsequently left untreated or stimulated with IL‐4 (10 ng/ml) for 24 h. Elp3 mRNA levels were quantified in all experimental conditions by Real‐Time PCR. Elp3 mRNA levels in unstimulated cells were set to 1 and levels in other experimental conditions were relative to that after normalization with Gapdh mRNA levels. Experiments were conducted in triplicates (mean ± SD, Student t‐test, **P < 0.01).
- E
Rictor but not Raptor deficiency impairs Elp3 expression. BMDMs were transfected with the indicated siRNAs and the resulting cells were treated or not with IL‐4 (10 ng/ml)/IL‐13 (10 ng/ml) for 24 h. Cell extracts were subjected to WB analyses.
- F
IL‐4/IL‐13 rely on Stat6 to induce Elp3 expression. Peritoneal macrophages were pretreated with the control vehicle (DMSO) or with the Stat6 pharmacological inhibitor AS1517499 (5 μM) for 1 h and subsequently left unstimulated or treated with IL‐4 (10 ng/ml)/IL‐13 (10 ng/ml) for the indicated periods of time. Cell extracts from the resulting cells were subjected to WB analyses.
- G
Stat6 is recruited on the Elp3 promoter in an IL‐4‐dependent manner. ChIP assays using an anti‐Stat6 antibody were conducted in RAW 264.7 cells to assess Stat6 recruitment on a Stat‐DNA binding site found in the Elp3 promoter. IgG antibody was used as a negative result. The histogram shows Stat6 recruitment on the Stat DNA‐binding site with or without IL‐4 (10 ng/ml) treatment for 2 h. Results obtained with four independent experiments (mean ± SD, Student t‐test, *P < 0.05) are illustrated.
- H–J
Elp3 deficiency in myeloid cells impairs multiple signaling pathways triggered by IL‐4 (H, I, and J), IL‐13 (H) or by both cytokines (H). Peritoneal macrophages isolated from the indicated mouse genotypes were untreated or stimulated with IL‐4 (10 ng/ml) (H, I, and J), IL‐13 (10 ng/ml) (H) or with both cytokines (H) for 8 h (H) or for the indicated periods of time (I and J) and the resulting cell extracts were subjected to WB analyses.
- K
Elp3 deficiency in BMDMs impairs the production of M2 markers upon stimulation with IL‐4/IL‐13. mRNAs of M2 markers were assessed by Real Time PCR. mRNA levels in unstimulated macrophages from Elp3 Control mice were set to 1 and levels in other experimental conditions were relative to that after normalization with Gapdh mRNA levels (n = 4 mice; mean ± SD, Student t‐test, *P < 0.05, ***P < 0.001).
- L
Elp3 promotes M2 macrophage polarization. Peritoneal macrophages isolated from the indicated mouse genotypes were untreated or stimulated with IL‐4/IL‐13 (10 ng/ml) for 24 h and the resulting cell extracts were subjected to WB analyses.
- A
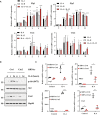
Elp1/3 and Ctu1/2 expression are induced by M2 polarization signals. Peritoneal macrophages were untreated or stimulated with IL‐4 (20 ng/ml), IL‐13 (20 ng/ml) or with both IL‐4 and IL‐13 ex‐vivo for the indicated periods of time and mRNA levels of the indicated candidates were assessed in all experimental conditions by Real‐Time PCR. mRNA levels in unstimulated cells were set to 1 and levels in other experimental conditions were relative to that after normalization with Gapdh mRNA levels (n = 3 mice; mean ± SD, Student t‐test, *P < 0.05; **P < 0.01; ***P < 0.001).
- B
IL‐4‐dependent mTORC2 activation relies on Ctu2. Control and Ctu2‐depleted bone marrow‐derived macrophages (BMDMs) were treated or not with IL‐4 (10 ng/ml) and the resulting cell extracts were subjected to western blot (WB) analyses.
- C
Ctu2 deficiency impairs M2 macrophage polarization. Control and Ctu2‐depleted BMDMs were treated or not with IL‐4 (10 ng/ml) for 24 h and the resulting mRNAs of the listed M2 markers were assessed by Real Time PCR. mRNA levels in control BMDMs were set to 1 and levels in other experimental conditions were relative to that after normalization with Gapdh mRNA levels (n = 3 mice; mean ± SD, Student t‐test, *P < 0.05, **P < 0.01, ***P < 0.001).

- A
Elp3 deficiency potentiates the expression of genes induced by LPS‐dependent pathways and impairs a Pparγ‐dependent transcriptional signature. The figure shows some GSEA analyses carried out on RNA‐Seq data done with total RNAs of BMDMs from Elp3 Control and Elp3 ΔMye mice treated with IL‐4 ex‐vivo.
- B
Defective induction of Pparγ by IL‐4/IL‐13 upon Elp3 deficiency. Cell extracts from peritoneal macrophages of Elp3 Control and Elp3 ΔMye mice treated or not with IL‐4/IL‐13 were subjected to WB analyses.
- C
Elp3 deficiency impairs the IL‐4‐dependent transcriptional signature. Cell extracts from BMDMs of Elp3 Control and Elp3 ΔMye mice treated or not with IL‐4 for 2 h were subjected to RNA‐Seq experiments. A heatmap is illustrated to show the defective induction of 50 genes by IL‐4 upon Elp3 deficiency.
- D
Defective Irf4 expression upon IL‐4 stimulation in peritoneal macrophages lacking Elp3 expression. Irf4 mRNA levels in peritoneal macrophages from untreated Elp3 Control mice were set to 1 and levels in other experimental conditions were relative to that after normalization with Gapdh mRNA levels (n = 3 mice; mean ± SD, Student t‐test, **P < 0.01).
- E
The IL‐4‐dependent transcriptomic signature requires Elp3. A volcano plot illustrating changes in mRNA levels in IL‐4‐stimulated BMDMs (2 h) from Elp3 Control and Elp3 ΔMye mice is shown.
- F
Identification of candidates whose protein but not mRNA levels are decreased in IL‐4‐treated BMDMs lacking Elp3. A volcano plot of correlation between changes in protein and mRNA levels is illustrated. Protein were extracted from BMDMs of Elp3 Control and Elp3 ΔMye mice treated for 4 h with IL‐4. Red dots indicate candidates whose protein but not mRNA levels were downregulated in BMDMs from Elp3 Mye mice compared to BMDMs from Elp3 Control mice.
- G
Identification of candidates enriched in LysAAA, GlnCAA, and GluGAA codons whose expression decreases in BMDMs lacking Elp3. A heatmap of the top 40 genes enriched in these codons is illustrated.

- A
Elp3 deficiency impairs levels of TCA cycle metabolites in IL‐4‐stimulated peritoneal macrophages. Peritoneal macrophages from Elp3 Control and Elp3 ΔMye mice (n = 3 per genotype) were treated with IL‐4 for 24 h ex‐vivo and the resulting extracts were subjected to Mass Spec analyses to extensively quantify metabolites.
- B
Elp3 deficiency is linked to a defective TCA cycle in peritoneal macrophages. Enrichment analyses carried out on our metabolomics data are illustrated.
- C
Elp3 controls glucose consumption in peritoneal macrophages. The glucose consumption rate was measured in peritoneal macrophages from Elp3 Control and Elp3 ΔMye mice (see Methods for details; n = 3 mice per genotype; mean ± SD, Student t‐test, *P < 0.05).
- D
Elp3 deficiency in peritoneal macrophages impairs the expression of enzymes involved in glucose consumption. mRNA levels of the indicated candidates in peritoneal macrophages from Elp3 Control mice were set to 1 and levels in Elp3 ΔMye mice were relative to that after normalization with Gapdh mRNA levels (n = 3 mice per genotype; mean ± SD, Student t‐test, ***P < 0.001, **P < 0.01, *P < 0.05).
- E, F
Elp3 deficiency in peritoneal macrophages impairs mitochondrial complex I activity (E) and the mitochondrial membrane potential (F). Extracts from peritoneal macrophages of Elp3 Control and Elp3 ΔMye mice were used to assess complex I activity (E) (n = 3 mice per genotype; mean ± SD, Student t‐test, *P < 0.05). The mitochondrial membrane potential was assessed by FACS analyses by following‐up TMRM (n = 3 mice per genotype; mean ± SD, Student t‐test, ***P < 0.001). Representative FACS panels are illustrated on the right.
- G
Elp3 expression in peritoneal macrophages is required for mitochondrial oxidative phosphorylation. Both basal and maximal oxygen consumption rate (OCR) as well as the spare OCR were measured with extracts from peritoneal macrophages of both Elp3 Control and Elp3 ΔMye mice (see Methods for details; n = 3 mice per genotype; mean ± SD, Student t‐test, ***P < 0.001, **P < 0.01).


- A
Impaired production of M2 markers upon IL‐4 activation in vivo in mice lacking Elp3 in peritoneal macrophages. Mice of the indicated genotypes were treated with PBS or stimulated with IL‐4 complex (IL‐4c) and mRNA levels of the indicated candidates were assessed by Real Time PCR in the peritoneal exudate cells 4 days after the stimulation. mRNA levels in peritoneal exudate cells from untreated Elp3 Control mice were set to 1 and levels in other experimental conditions were relative to that after normalization with Gapdh mRNA levels (n = 4 mice; mean ± SD, Student t‐test, ***P < 0.001, **P < 0.01, *P < 0.05).
- B
Decreased number of large peritoneal macrophages (LPMs) lacking Elp3 during M2 polarization. Numbers of LPMs (CD115+, ICAM2+, MHCIIlow) sorted from Elp3 Control and Elp3 ΔMye mice treated by IL‐4c are plotted (representative of two experiments, n = 7 mice per group, mean ± SD, Student t‐test, **P < 0.01).
- C
Elp3 deficiency does not impact cell proliferation of small peritoneal macrophages upon IL‐4c stimulation. Numbers of SPMs (CD115+, ICAM2+, MHC IIhigh) sorted from Elp3 Control and Elp3 ΔMye mice treated by IL‐4c are plotted and data are illustrated as in B. (representative of two experiments, n = 7 per group, mean ± SD, Student t‐test, nonsignificant).
- D
Decreased number of cycling LPMs lacking Elp3 upon stimulation with IL‐4c. Numbers of Ki67+ LPMs sorted from Elp3 Control and Elp3 ΔMye mice treated by IL‐4c are plotted (representative of two experiments, n = 7 mice per group, mean ± SD, Student t‐test, ***P < 0.001).
- E
Decreased number of Edu+ PM cells lacking Elp3 upon stimulation with IL‐4c. Numbers of Edu+ CD11+ cells sorted from Elp3 Control and Elp3 ΔMye mice treated by IL‐4c are plotted (representative of two experiments, n = 7 per group, mean ± SD, Student t‐test, ***P < 0.001).
- F
Elp3 controls the proliferation of macrophages undergoing M2 polarization. GSEA analyses with gene expression RNA‐seq data are illustrated. Representative Hallmarks enriched in Elp3 Control versus Elp3 ΔMye BMDMs treated by IL‐4 for 2 h are shown.
- A
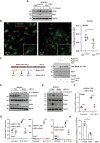
The induction of Ric8b expression by IL‐4 relies on Elp3. BMDMs from the indicated genotypes were treated or not with IL‐4 (10 ng/ml) up to 24 h and the resulting cell extracts were subjected to WB analyses.
- B
Elp3 promotes Ric8B mRNA translation. BMDMs from Elp3 Control and Elp3 ΔMye mice were treated by IL‐4 for 24 h, followed by a treatment with 10 μg/ml puromycin for 5 min. To detect newly synthesized Ric8b proteins, a Puro‐PLA assay was conducted. Representative images detecting Ric8b (Red) and α‐Tubulin+ microtubules (green) in BMDMs are illustrated. On the right, the graph shows a quantification of signals for Ric8b in α‐Tubulin+ areas. A random of six different areas were counted (6 technical replicates, mean ± SD, Student's t‐test, *P < 0.05).
- C
Ric8b is a direct target of Elp3. BMDMs from Elp3 Control and Elp3 ΔMye mice were infected with a lentiviral GFP construct (negative control), Flag‐Ric8b WT or with Flag‐Ricb MUT, as indicated and the resulting protein extracts were subjected to WB analyses to assess Ric8b and Elp3 protein levels. Gapdh was used as a loading control.
- D, E
Ric8b promotes IL‐4‐dependent mTORC2 activation. Control or Ric8b‐depleted BMDMs were treated or not with IL‐4 (10 ng/ml) for the indicated periods of time and the resulting cell extracts were subjected to WB analyses.
- F, G
Ric8b deficiency impairs the production of M2 markers upon IL‐4/IL‐13 stimulation. Control or Ric8b‐depleted BMDMs were stimulated or not with IL‐4/IL‐13 (10 ng/ml) for 24 h and the resulting RNAs were subjected to Real‐Time PCR analyses. mRNA levels of the indicated candidates in control and unstimulated BMDMs were set to 1 and levels in other experimental conditions were relative to that after normalization with Gapdh mRNA levels (n = 3 mice per genotype; mean ± SD, Student t‐test, ***P < 0.001, **P < 0.01).
- H
Ric8b controls glucose consumption in BMDMs. The glucose consumption rate was measured in BMDMs transfected with a siRNA CTRL or Ric8b. Data from three biological replicates (3 mice per group) are shown (mean ± SD, Student t‐test, **P < 0.01).

- A
Enrichment of candidates involved in mitochondrial translation in the proteomic signature of 206 candidates (Reactome pathway enrichment analysis).
- B
Enrichment of Mrpl proteins in the proteomic signature of 206 candidates. Proteins were classified according to the combined frequency of AAA, GAA, and CAA codons in their open reading frame.
- C
Elp3 promotes mitochondrial translation. BMDMs from the indicated genotypes were treated or not with IL‐4/IL‐13 (10 ng/ml) for the indicated hours and the resulting cell extracts were subjected to WB analyses.
- D
Impaired expression of M2 markers upon Mrpl13 deficiency in IL‐4‐stimulated macrophages. BMDMs were transfected with a control siRNA or with a siRNA targeting Mrpl13 and the resulting cells were untreated or stimulated with IL‐4 (10 ng/ml) for 24 h. mRNA levels of the indicated candidates were quantified by Real‐Time PCR experiments. mRNA levels in unstimulated BMDMs transfected with the control siRNA were set to 1 and levels in other experimental conditions were related to that. Experiments were conducted in triplicates (mean ± SD, Student t‐test, ***P < 0.001, **P < 0.01, *P < 0.05).
- A
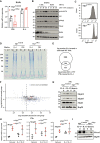
Elp3 does not regulate Ric8b mRNA levels. mRNAs of BMDMs from the indicated genotypes and stimulated ex‐vivo with IL‐4 or with PBS (control) were subjected to Real‐Time PCRs. mRNA levels of Ric8b in BMDMs treated with PBS from Elp3Control mice were set to 1 and levels in other experimental conditions were relative to that after normalization with Gapdh mRNA levels (n = 3 mice per genotype (mean ± SD).
- B
Ric8b promotes LPS‐dependent mTORC2 activation. Control or Ric8b‐depleted BMDMs were treated or not with IFNγ (50 ng/ml) and LPS (100 ng/ml) for the indicated periods of time and the resulting cell extracts were subjected to WB analyses.
- C
Increased aggregate formation by IL‐4 in macrophages. Flow cytometry of aggresomes with extracts of BMDMs from Elp3 Control and Elp3 ΔMye mice treated with IL‐4 (10 ng/ml) for 24 h are illustrated. Experiments were conducted in duplicates.
- D
Visualization of protein aggregates. Coomassie blue staining of aggregate samples from Elp3 Control and Elp3 ΔMye BMDMs treated with IL‐4 or PBS (control; n = 8 mice).
- E
Identification of a proteomic signature of candidates whose expression is increased upon IL‐4 stimulation and in BMDMs lacking Elp3 (Venn diagram).
- F
Identification of proteins enriched in aggregates in macrophages lacking Elp3. Dot plot of protein aggregates from IL‐4‐treated BMDMs cells lacking or not Elp3 are shown. Genes enriched in LysAAA, GlnCAA, and GluGAA codons are shown in blue. Mrpls are shown in Red.
- G
The expression of selected Mrpl proteins is controlled by Elp3 in macrophages. Peritoneal macrophages from Elp3 Control and Elp3 ΔMye mice were treated or not with IL‐4/IL‐13 (10 ng/ml) for the indicated periods of time and cell extracts from resulting cells were subjected to WBs using the indicated antibodies.
- H
Elp3 does not regulate mRNA levels of Mrpl proteins. PMs from the indicated genotypes were stimulated or not with IL‐4/IL‐13 (10 ng/ml) for 24 h and mRNA levels of the indicated candidates were quantified by Real‐Time PCR. mRNA levels of all candidates in untreated cells from Elp3 Control mice were set to 1 and levels in other experimental conditions were relative to that after normalization with Gapdh mRNA levels (n = 3 mice, mean ± SD, Student t‐test, nonsignificant).
- I
Elp3 controls Mt‐co3 expression in macrophages. Protein extracts from PMs of the indicated genotypes treated or not with IL‐4/IL‐13 (10 ng/ml) for the indicated periods of time were subjected to WB analyses.
- A, B
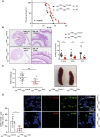
Elp3 deficiency in myeloid cells prolongs survival of Apc +/Min mice (A) and reduces the number of adenomas in all parts of the intestine (B). A Kaplan–Meyer curve was established with the indicated genotypes (A). The number of intestinal tumors in the indicated parts of the intestine was quantified in both Apc +/Min Elp3 Control and Apc +/Min Elp3 ΔMye mice (B) (n = 10 mice per genotype; mean ± SD, Student t‐test, ***P < 0.001, **P < 0.01, *P < 0.05). Representative H&E analyses of intestinal crypts from the indicated genotypes are illustrated.
- C
Elp3 deficiency in myeloid cells decreases the spleen weight of Apc +/Min mice (n = 10 mice per genotype; mean ± SD, Student t‐test, **P < 0.01). Representative pictures of the spleen from the indicated genotypes.
- D
Elp3 expression in myeloid cells maintains the pool of tumor‐associated macrophages (TAMs). The number of TAMs, defined as CD301+/F4/80+ cells among F4/80+ cells was quantified in intestinal crypts from both Apc +/Min Elp3 Control and Apc +/Min Elp3 ΔMye mice (n = 5 mice per genotype; mean ± SD, Student t‐test, *P < 0.05). Representative immunofluorescence analyses are illustrated.

- A
Peritoneal macrophages from the indicated genotypes were stimulated or not with IL‐4/IL‐13 (10 ng/ml) for the indicated periods of time and the resulting extracts were subjected to WB analyses.
- B
Elp3 deficiency does not potentiates Atf4‐driven transcription in myeloid cells. Peritoneal macrophages from the indicated genotypes were stimulated or not with IL‐4 (10 ng/ml) for 24 h and mRNA levels of the indicated Atf4 target genes were quantified by Real‐Time PCR. mRNA levels of all candidates in untreated cells from Elp3 Control mice were set to 1 and levels in other experimental conditions were relative to that after normalization with Gapdh mRNA levels (n = 4 mice, mean ± SD, Student t‐test, nonsignificant).
References
-
- Brunet A, Bonni A, Zigmond MJ, Lin MZ, Juo P, Hu LS, Anderson MJ, Arden KC, Blenis J, Greenberg ME (1999) Akt promotes cell survival by phosphorylating and inhibiting a forkhead transcription factor. Cell 96: 857–868 - PubMed
Publication types
MeSH terms
Substances
Associated data
- Actions
LinkOut - more resources
Full Text Sources
Molecular Biology Databases
Research Materials
Miscellaneous

