Development and validation of a gene signature predicting the risk of postmenopausal osteoporosis
- PMID: 35920104
- PMCID: PMC9396926
- DOI: 10.1302/2046-3758.118.BJR-2021-0565.R1
Development and validation of a gene signature predicting the risk of postmenopausal osteoporosis
Abstract
Aims: We aimed to develop a gene signature that predicts the occurrence of postmenopausal osteoporosis (PMOP) by studying its genetic mechanism.
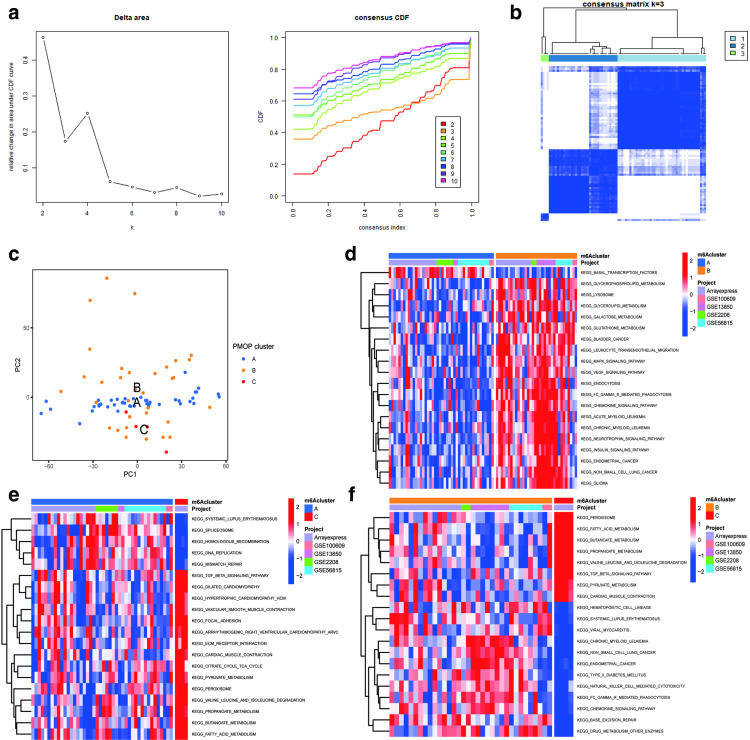
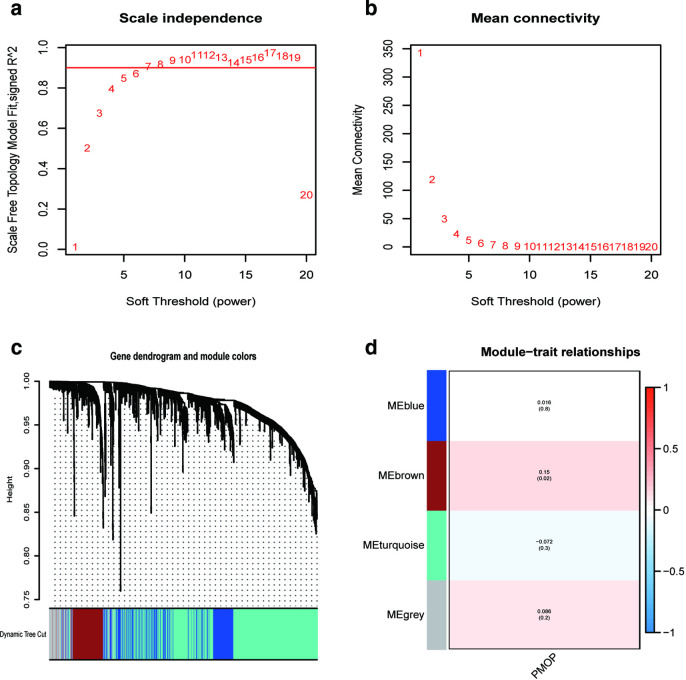
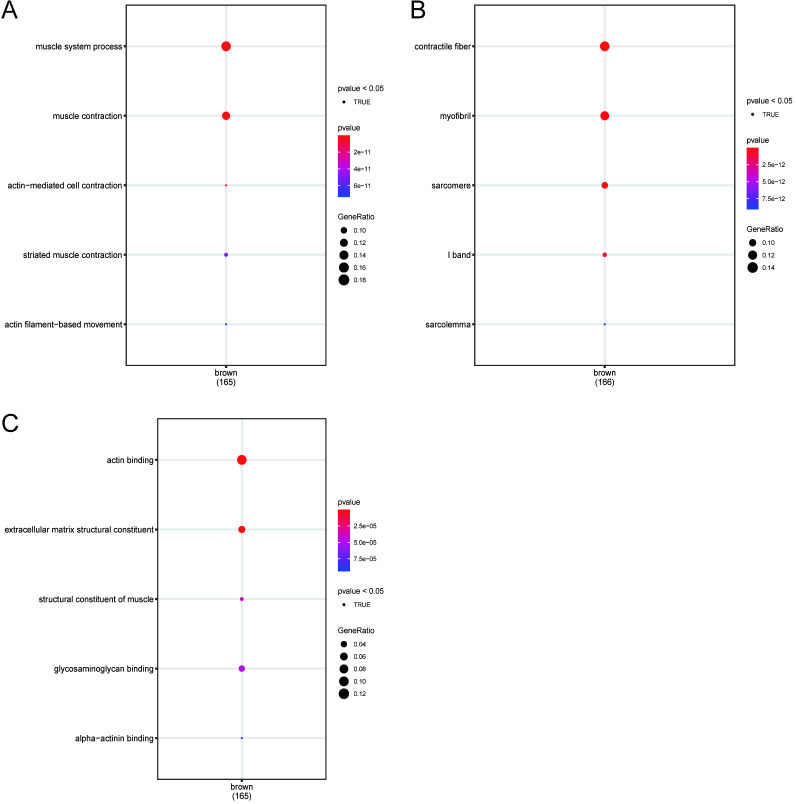
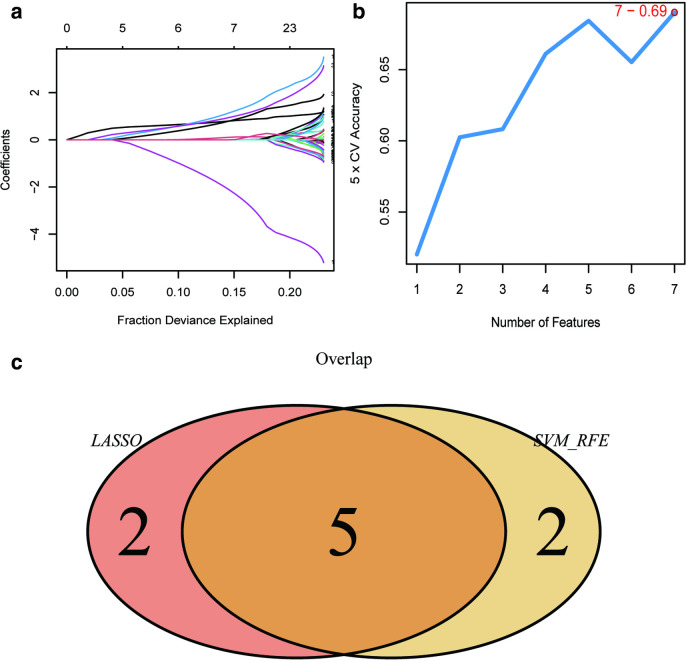
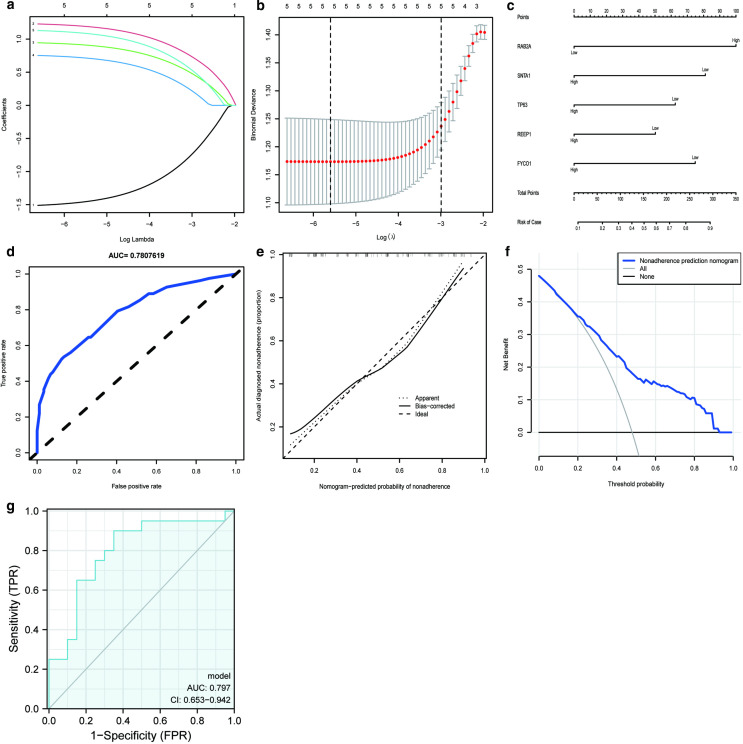
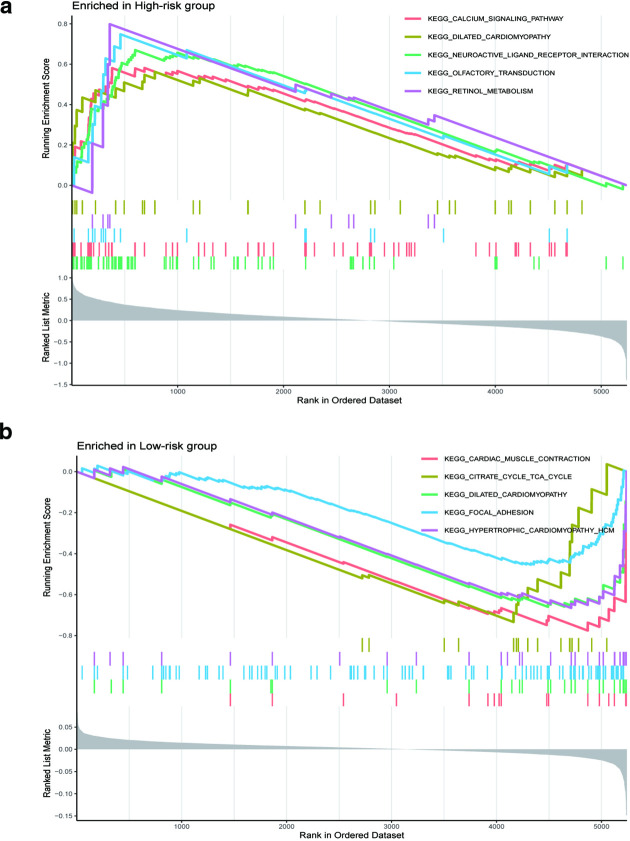
Methods: Five datasets were obtained from the Gene Expression Omnibus database. Unsupervised consensus cluster analysis was used to determine new PMOP subtypes. To determine the central genes and the core modules related to PMOP, the weighted gene co-expression network analysis (WCGNA) was applied. Gene Ontology enrichment analysis was used to explore the biological processes underlying key genes. Logistic regression univariate analysis was used to screen for statistically significant variables. Two algorithms were used to select important PMOP-related genes. A logistic regression model was used to construct the PMOP-related gene profile. The receiver operating characteristic area under the curve, Harrell's concordance index, a calibration chart, and decision curve analysis were used to characterize PMOP-related genes. Then, quantitative real-time polymerase chain reaction (qRT-PCR) was used to verify the expression of the PMOP-related genes in the gene signature.
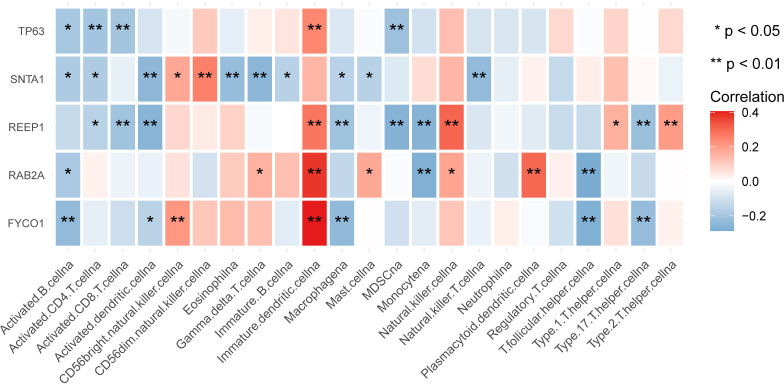
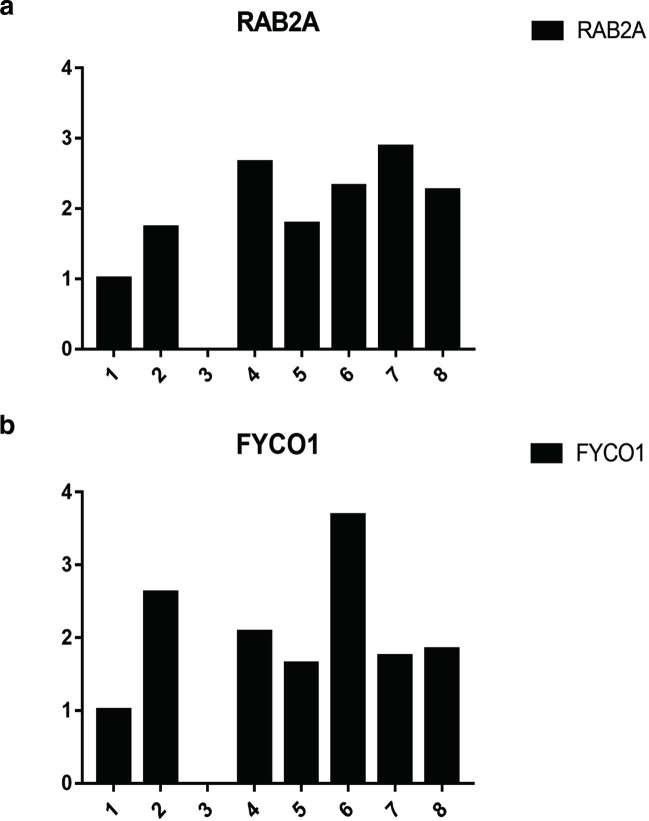
Results: We identified three PMOP-related subtypes and four core modules. The muscle system process, muscle contraction, and actin filament-based movement were more active in the hub genes. We obtained five feature genes related to PMOP. Our analysis verified that the gene signature had good predictive power and applicability. The outcomes of the GSE56815 cohort were found to be consistent with the results of the earlier studies. qRT-PCR results showed that RAB2A and FYCO1 were amplified in clinical samples.
Conclusion: The PMOP-related gene signature we developed and verified can accurately predict the risk of PMOP in patients. These results can elucidate the molecular mechanism of RAB2A and FYCO1 underlying PMOP, and yield new and improved treatment strategies, ultimately helping PMOP monitoring.Cite this article: Bone Joint Res 2022;11(8):548-560.
Keywords: Gene signature; Postmenopausal osteoporosis; Quantitative real-time polymerase chain reaction; Weighted gene co-expression network analysis; actin; biomarkers; calcium; decision curve analysis; gene expressions; logistic regression analysis; macrophages; univariate analysis.
Figures
Similar articles
-
Analysis and validation of biomarkers of immune cell-related genes in postmenopausal osteoporosis: An observational study.Medicine (Baltimore). 2024 May 10;103(19):e38042. doi: 10.1097/MD.0000000000038042. Medicine (Baltimore). 2024. PMID: 38728482 Free PMC article.
-
Identification of Serum Exosome-Derived circRNA-miRNA-TF-mRNA Regulatory Network in Postmenopausal Osteoporosis Using Bioinformatics Analysis and Validation in Peripheral Blood-Derived Mononuclear Cells.Front Endocrinol (Lausanne). 2022 Jun 9;13:899503. doi: 10.3389/fendo.2022.899503. eCollection 2022. Front Endocrinol (Lausanne). 2022. PMID: 35757392 Free PMC article.
-
Identification of a potential diagnostic signature for postmenopausal osteoporosis via transcriptome analysis.Front Pharmacol. 2022 Aug 29;13:944735. doi: 10.3389/fphar.2022.944735. eCollection 2022. Front Pharmacol. 2022. PMID: 36105211 Free PMC article.
-
Roles of Altered Macrophages and Cytokines: Implications for Pathological Mechanisms of Postmenopausal Osteoporosis, Rheumatoid Arthritis, and Alzheimer's Disease.Front Endocrinol (Lausanne). 2022 Jun 10;13:876269. doi: 10.3389/fendo.2022.876269. eCollection 2022. Front Endocrinol (Lausanne). 2022. PMID: 35757427 Free PMC article. Review.
-
The transforming growth factor-β1 (TGF-β1) gene polymorphisms (TGF-β1 T869C and TGF-β1 T29C) and susceptibility to postmenopausal osteoporosis: a meta-analysis.Medicine (Baltimore). 2015 Jan;94(4):e461. doi: 10.1097/MD.0000000000000461. Medicine (Baltimore). 2015. PMID: 25634187 Free PMC article. Review.
Cited by
-
Unveiling the unexplored novel signatures for osteoporosis via a detailed bioinformatics and molecular experiments based approach.Am J Transl Res. 2024 Apr 15;16(4):1306-1321. doi: 10.62347/TAYD3318. eCollection 2024. Am J Transl Res. 2024. PMID: 38715824 Free PMC article.
-
Melatonin alleviates senile osteoporosis by regulating autophagy and enhancing fracture healing in aged mice.Bone Joint Res. 2025 Feb 6;14(2):97-110. doi: 10.1302/2046-3758.142.BJR-2024-0112.R2. Bone Joint Res. 2025. PMID: 39912870 Free PMC article.
-
Investigating the impact of Wnt pathway-related genes on biomarker and diagnostic model development for osteoporosis in postmenopausal females.Sci Rep. 2024 Feb 4;14(1):2880. doi: 10.1038/s41598-024-52429-1. Sci Rep. 2024. PMID: 38311613 Free PMC article.
-
Identification of the molecular link: STAT3 is a shared key gene linking postmenopausal osteoporosis and sarcopenia.Bone Joint Res. 2024 Aug 28;13(8):411-426. doi: 10.1302/2046-3758.138.BJR-2023-0351.R2. Bone Joint Res. 2024. PMID: 39195444 Free PMC article.