

Real-time analysis and display of quantitative measures to track and improve clinical workflow
- PMID: 35920135
- PMCID: PMC9512345
- DOI: 10.1002/acm2.13610
Real-time analysis and display of quantitative measures to track and improve clinical workflow
Abstract
Purpose: Radiotherapy treatment planning is a complex process with multiple, dependent steps involving an interdisciplinary patient care team. Effective communication and real-time tracking of resources and care path activities are key for clinical efficiency and patient safety.
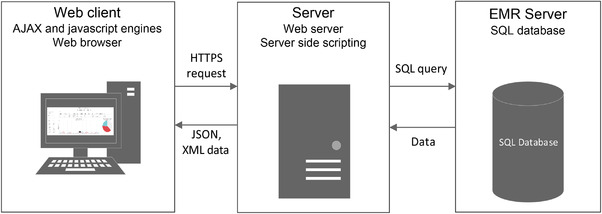
Materials and methods: We designed and implemented a secure, interactive web-based dashboard for patient care path, clinical workflow, and resource utilization management. The dashboard enables visualization of resource utilization and tracks progress in a patient's care path from the time of acquisition of the planning CT to the time of treatment in real-time. It integrates with the departmental electronic medical records (EMR) system without the creation and maintenance of a separate database or duplication of work by clinical staff. Performance measures of workflow were calculated.
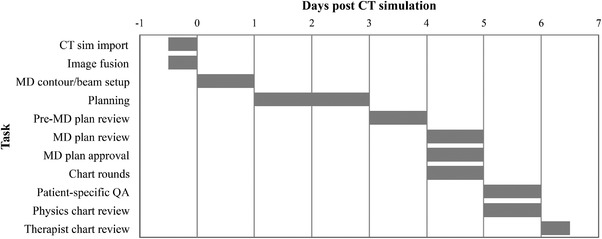
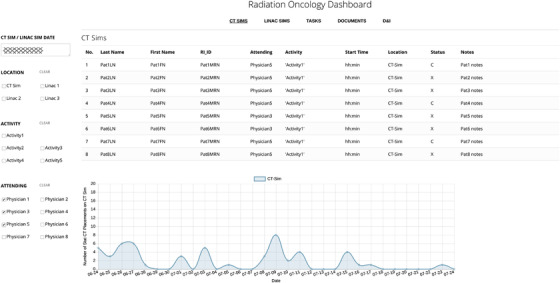
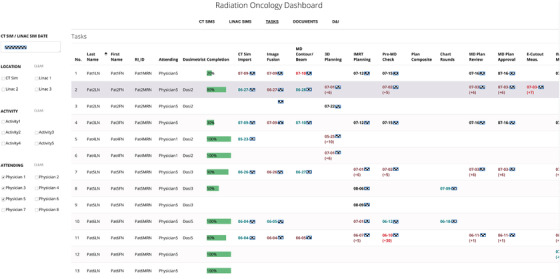
Results: The dashboard implements a standardized clinical workflow and dynamically consolidates real-time information queried from multiple tables in the EMR database over the following views: (1) CT Sims summarizes patient appointment information on the CT simulator and patient load; (2) Linac Sims summarizes patient appointment times, setup history, and notes, and patient load; (3) Task Status lists the clinical tasks associated with a treatment plan, their due date, status and ownership, and patient appointment details; (4) Documents provides the status of all documents in the patients' charts; and (5) Diagnoses and Interventions summarizes prescription information, imaging instructions and whether the plan was approved for treatment. Real-time assessment and quantification of progress and delays in a patient's treatment start were achieved.
Conclusions: This study indicates it is feasible to develop and implement a dashboard, tailored to the needs of an interdisciplinary team, which derives and integrates information from the EMR database for real-time analysis and display of resource utilization and clinical workflow in radiation oncology. The framework developed facilitates informed, data-driven decisions on clinical workflow management as we seek to optimize clinical efficiency and patient safety.
Keywords: dashboard; database; electronic medical records; quality assurance; radiation therapy.
© 2022 The Authors. Journal of Applied Clinical Medical Physics published by Wiley Periodicals, LLC on behalf of The American Association of Physicists in Medicine.
Conflict of interest statement
The authors declare no conflicts of interest.
Figures


References
-
- ASTRO . Safety is no accident: a framework for quality radiation oncology care. https://www.astro.org/Patient‐Care‐and‐Research/Patient‐Safety/Safety‐is..., 2019. Accessed: January 25, 2021.
-
- Gopan O, Zeng J, Novak A, Nyflot M, Ford E. The effectiveness of pretreatment physics plan review for detecting errors in radiation therapy. Med Phys. 2016;43(9):5181. - PubMed
-
- Chao ST, Meier T, Hugebeck B, et al. Workflow enhancement (we) improves safety in radiation oncology: putting the we and team together. Int J Radiat Oncol Biol Phys. 2014;89(4):765–772. - PubMed
-
- Marks LB, Rose CM, Hayman JA, Williams TR. The need for physician leadership in creating a culture of safety. Int J Radiat Oncol Biol Phys. 2011;79(5):1287–1289. - PubMed
-
- Daley K, Richardson J, James I, Chambers A, Corbett D. Clinical dashboard: use in older adult mental health wards. Psychiatrist. 2013;37(3):85–88.
MeSH terms
LinkOut - more resources
Full Text Sources
