. 2022 Aug 3;39(8):msac170.
doi: 10.1093/molbev/msac170.

Phylogenomic Evidence for the Origin of Obligate Anaerobic Anammox Bacteria Around the Great Oxidation Event

Affiliations

Phylogenomic Evidence for the Origin of Obligate Anaerobic Anammox Bacteria Around the Great Oxidation Event

Tianhua Liao et al. Mol Biol Evol. .

Abstract

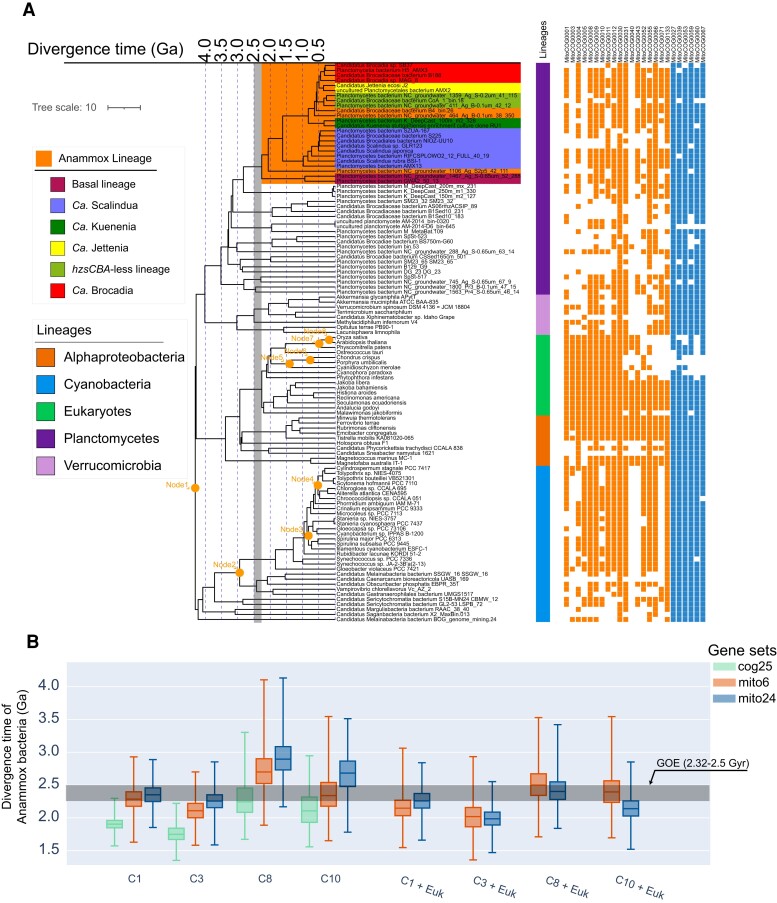
The anaerobic ammonium oxidation (anammox) bacteria can transform ammonium and nitrite to dinitrogen gas, and this obligate anaerobic process accounts for up to half of the global nitrogen loss in surface environments. Yet its origin and evolution, which may give important insights into the biogeochemistry of early Earth, remain enigmatic. Here, we performed a comprehensive phylogenomic and molecular clock analysis of anammox bacteria within the phylum Planctomycetes. After accommodating the uncertainties and factors influencing time estimates, which include implementing both a traditional cyanobacteria-based and a recently developed mitochondria-based molecular dating approach, we estimated a consistent origin of anammox bacteria at early Proterozoic and most likely around the so-called Great Oxidation Event (GOE; 2.32-2.5 Ga) which fundamentally changed global biogeochemical cycles. We further showed that during the origin of anammox bacteria, genes involved in oxidative stress adaptation, bioenergetics, and anammox granules formation were recruited, which might have contributed to their survival on an increasingly oxic Earth. Our findings suggest the rising levels of atmospheric oxygen, which made nitrite increasingly available, was a potential driving force for the emergence of anammox bacteria. This is one of the first studies that link the GOE to the evolution of obligate anaerobic bacteria.

Keywords: anammox bacteria; molecular dating analysis; planctomycetes.


Figures

Fig. 1.
Fig. 1.
The evolutionary timeline of anammox bacteria using MCMCTree. The chronogram was estimated based on the calibration set C1 (see supplementary text section 3, Supplementary Material online) and sequence alignments of the 25 orthologs conserved in bacteria (20,040 nucleotide sites after removing the third position of codon). The blue bars on the four calibration nodes and the LCA of anammox bacteria represent the posterior 95% HPD interval of the posterior time estimates. These alternative calibration sets were selected by choosing the three that accommodate different calibration constraints (see supplementary text section 3.3, Supplementary Material online). More alternative time estimates are provided in supplementary fig. S4, Supplementary Material online. The vertical grey bar represents the period of the GOE from 2,500 to 2,320 Ma. The calibration constraints used within the phylum Cyanobacteria are marked with orange texts: the LCA of Planctomycetes and Cyanobacteria (Root), the total group of oxygenic Cyanobacteria (Node2), the total group of Nostocales (Node3), and the total group of Pleurocapsales (Node4). Planctomycetes from marine or groundwater habitats were labeled by a blue circle. The genome completeness estimated by CheckM is visualized with a gradient color strip. The right next color strip indicates the genome type of genomic sequences used in our study including MAGs and whole-genome sequencing (WGS) from either enriched culture sample or isolate. The different posterior distributions of the age of the LCA of anammox bacteria obtained using different calibrations and IR clock model (see supplementary dataset S2.1, Supplementary Material online) are indicated adjacent to the corresponding node. The diagram below the dated tree illustrates the change of atmospheric partial pressure of O2 (PO2) and nitrogen isotope fractionations. The blue line shows the proposed model according to Lyons et al. (2014). The green arrow suggests the earliest evidence for aerobic nitrogen cycling at around 2.7 Ga. PAL on right axis means PO2 relative to the present atmospheric level. The black dots denote the change of nitrogen δ15N isotope values according to Kipp et al. (2018).
Fig. 2.
Fig. 2.
(A) The chronogram of the Anammox lineage estimated by mitochondria-based dating analysis. The time tree was estimated based on the calibration set “C1 + Euk” and sequence alignments of the 24 mitochondria-encoded proteins at the amino acid level (6,295 amino acid sites). The vertical grey bar represents the period of the GOE from 2,500 to 2,320 Ma. The calibration constraints are marked with orange texts: the LCA of Planctomycetes and Cyanobacteria (Root), the total group of oxygenic Cyanobacteria (Node2), the total group of Nostocales (Node3), the total group of Pleurocapsales (Node4), the total group of Bangiales (crown group of red algae) (Node5), the total group of Florideophyceae (Node6), the total group of mosses (crown group of Embryophyta) (Node7), and the total group of eudicots (crown group of angiosperms) (Node8). The color strip next to the label represent the major lineages of analyzed genomes. The filled and empty squares, respectively, represent the presence and absence of particular genes used in molecular dating analysis. The six genes selected to comprise the mito6 gene set are represented by blue squares. (B) The posterior times of anammox bacteria estimated using cyanobacteria-based and mitochondria-based dating analyses. The calibration sets starting with C represent the calibration sets with cyanobacterial calibrations, while those starting with Euk represent the calibration sets with eukaryotic calibrations. Calibration information: calibration scheme C1 Node1: <4.5 Ga, Node2: 3.0–2.32 Ga; C3 Node1: <3.8 Ga, Node2: 3.0–2.32 Ga; C8 Node1: <4.5 Ga, Node2: >3.0 Ga; C10 Node1: <3.8 Ga, Node2: >3.0 Ga. All of these calibration schemes share the same calibration for Nodes 3 (>1.6 Ga) and 4 (>1.7 Ga). The horizontal grey bar represents GOE from 2.5 to 2.32 Ga. The detailed constraints of calibrations and time estimates are provided in supplementary dataset S2.1, Supplementary Material online.
Fig. 3.
Fig. 3.
The phyletic pattern of ecologically relevant genes in the comparison between anammox bacteria and non-anammox bacteria. Solid circles at the nodes indicate the ultrafast bootstrap values in 1,000 bootstrapped replicates. Note that copy number difference is not indicated since most genes displayed here are present as a single copy in genome except a few exceptions like hao (see supplementary dataset S1.5, Supplementary Material online for the table summarizing the copy number of each gene). The phylogenomic tree on the left was constructed with 887 genomic sequences described in supplementary text section 2.1. Those Planctomycetes genomes not used for comparative genomics analyses are collapsed into grey triangles, and the numbers of collapsed genomes are labeled next to the triangles. The target group and reference group for comparative genomic analysis are within an orange or blue box, separately. For each genome, the genome completeness estimated by CheckM is visualized with a color strip and labeled besides leaf nodes. The right next color strip represents the type of genomic sequences used in our study including MAGs and whole-genome sequencing (WGS) from either enriched culture sample or isolate. The filled and empty circles, respectively, represent the presence and absence of particular genes in corresponding genomes. For gene clusters, only genomes with at least half of the members of the gene cluster are indicated by a filled circle. The classifications of annotated genes are labeled above the gene names. hzsCBA, hydrazine synthase subunits C, B, and A; hdh, hydrazine dehydrogenase; hao, hydroxylamine dehydrogenase; nxrAB, nitrite oxidoreductase subunits A and B; nirK, copper-containing and NO-forming nitrite reductase; nirS, cytochrome NO-forming nitrite reductase; nrfAH, ammonia-forming nitrite reductase subunits A and H; glnB, nitrogen regulatory protein P-II; nirC, nitrite transporter; NRT, nitrate/nitrite transporter; amt, ammonium transporter; kuste2805, 3603, 3605–3606, proposed genes relative to the synthetic pathways for ladderane at Rattray et al. (2009); cbiG, cobalt-precorrin 5A hydrolase; cbiD, cobalt-precorrin-5B(C1)-methyltransferase; cbiOMQ, cobalt/nickel transport system; AhpC, peroxiredoxin; Ccp, cytochrome c peroxidase; dfx, superoxide reductase; fprA, H2O-forming enzyme flavoprotein; CcsAB, cytochrome c maturation systems; petB, Cytochrome b subunit of the bc complex; petC, Rieske Fe-S protein; ahbABCD, heme biosynthesis; sat, sulfate adenylyltransferase; aprAB, adenylylsulfate reductase, subunits A and B; fsr, sulfite reductase (coenzyme F420); higB-1, toxin; higA-1, antitoxin; mnhABCDEG, multicomponent Na+/H+ antiporter; fdhAB, formate dehydrogenase subunits A and B; nuo(A-N), NADH-quinone oxidoreductase; ndh(A-N), NAD(P)H-quinone oxidoreductase; nqrABCDEF, Na+-transporting NADH:ubiquinone oxidoreductase; rnfABCDEG, Na+-translocating ferredoxin:NAD+ oxidoreductase; atp(A-H), F-type H+-transporting ATPase; lacAZ, beta-galactosidase; melA, galA, alpha-galactosidase; ebgA, beta-galactosidase; galK, galactokinase;, fructokinase; fruK, 1-phosphofructokinase; rhaB, rhamnulokinase; rbsK, ribokinase; araB, L-ribulokinase; xylB, xylulokinase; kdgK, 2-dehydro-3-deoxygluconokinase; GALK2, N-acetylgalactosamine kinase; cah, cephalosporin-C deacetylase; argE, acetylornithine deacetylase; nagA; N-acetylglucosamine-6-phosphate deacetylase; HDAC11, histone deacetylase 11.

Similar articles

Cited by

References

    1. Ader M, Sansjofre P, Halverson GP, Busigny V, Trindade RIF, Kunzmann M, Nogueira ACR. 2014. Ocean redox structure across the Late Neoproterozoic Oxygenation Event: a nitrogen isotope perspective. Earth Planet Sci Lett. 396:1–13.
    1. Ader M, Thomazo C, Sansjofre P, Busigny V, Papineau D, Laffont R, Cartigny P, Halverson GP. 2016. Interpretation of the nitrogen isotopic composition of Precambrian sedimentary rocks: assumptions and perspectives. Chem Geol. 429:93–110.
    1. Akram M, Dietl A, Mersdorf U, Prinz S, Maalcke W, Keltjens J, Ferousi C, de Almeida NM, Reimann J, Kartal B, et al. 2019. A 192-heme electron transfer network in the hydrazine dehydrogenase complex. Sci Adv. 5:4310. - PMC - PubMed
    1. Anbar AD, Duan Y, Lyons TW, Arnold GL, Kendall B, Creaser RA, Kaufman AJ, Gordon GW, Scott C, Garvin J, et al. 2007. A whiff of oxygen before the Great Oxidation Event? Science 317:1903–1906. - PubMed
    1. Battistuzzi FU, Hedges SB. 2009. A Major Clade of prokaryotes with ancient adaptations to life on land. Mol Biol Evol. 26:335–343. - PubMed

Publication types