

Development and external validation of a novel nomogram to predict prostate cancer in biopsy-naïve patients with PSA <10 ng/ml and PI-RADS v2.1 = 3 lesions
- PMID: 35920264
- PMCID: PMC9939143
- DOI: 10.1002/cam4.5100
Development and external validation of a novel nomogram to predict prostate cancer in biopsy-naïve patients with PSA <10 ng/ml and PI-RADS v2.1 = 3 lesions
Abstract
Objective: To develop and externally validate a novel nomogram in biopsy-naïve patients with prostate-specific antigen (PSA) <10 ng/ml and PI-RADS v2.1 = 3 lesions.
Methods: We retrospectively collected 307 men that underwent initial biopsy from October 2015 to January 2022 in Cohort 1 (The First Affiliated Hospital of Soochow University). External cohort (Cohort 2, Kunshan Hospital) included 109 men that met our criteria from July 2016 to June 2021. By Slicer-3D Software, the volume of all lesions was divided into two subgroups (PI-RADS v2.1 = 3a and 3b). Logistic regression analysis was performed to screen for variables and construct nomogram by analyzing clinical data from Cohort 1. Receiver operating characteristics curve analysis, calibration plot and decision curve analysis (DCA) were plotted to validate the nomogram in external cohort.
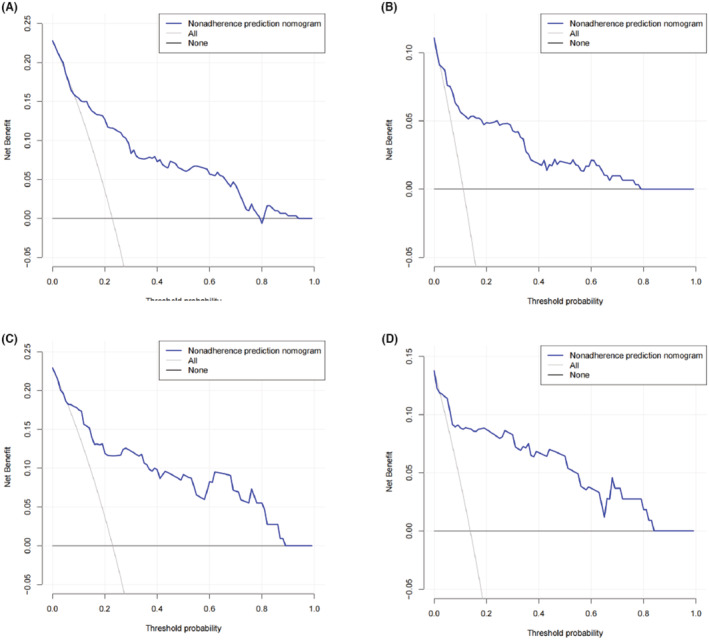
Results: A total of 70 (22.8%) patients was diagnosed with prostate cancer in Institution 1. Among them, 34 (11.1%) had clinically significant prostate cancer (csPCa). Age, prostate-specific antigen density, digital rectal examination, PI-RADS v2.1 = 3 subgroups (3a and 3b) and apparent diffusion coefficient (ADC, <750 mm2 /s) were predictive factors for prostate cancer (PCa) and csPCa. High area under the curve of the nomogram was found in Cohort 1 and Cohort 2 for PCa (0.857 vs. 0.850) and for csPCa (0.896 vs. 0.893). Calibration curves showed excellent agreement between the predicted probability and actual risk for the models in internal and external validation. The DCA demonstrated net benefit of our nomogram.
Conclusion: Until now, this is the first nomogram that predicts PCa and csPCa in biopsy-naïve patients with PSA <10 ng/ml and PI-RADS v2.1 = 3 lesions. Furthermore, PI-RADS v2.1 = 3 subgroups were considered to be an independent risk factor in our model. Our nomogram may assist urologists in biopsy decision making for these so-called "double gray zone" patients.
Keywords: PI-RADS v2.1; csPCa; equivocal lesions; nomogram.
© 2022 The Authors. Cancer Medicine published by John Wiley & Sons Ltd.
Conflict of interest statement
The authors have no conflicts of interest to declare.
Figures


References
-
- Siegel RL, Miller KD, Jemal A. Cancer statistics, 2020. CA Cancer J Clin. 2020;70(1):7‐30. - PubMed
-
- Akaza H, Onozawa M, Hinotsu S. Prostate cancer trends in Asia. World J Urol. 2017;35(6):859‐865. - PubMed
-
- Hoeks CM, Barentsz JO, Hambrock T, et al. Prostate cancer: multiparametric MR imaging for detection, localization, and staging. Radiology. 2011;261(1):46‐66. - PubMed
-
- Turkbey B, Rosenkrantz AB, Haider MA, et al. Prostate imaging reporting and data system version 2.1: 2019 update of prostate imaging reporting and data system version 2. Eur Urol. 2019;76(3):340‐351. - PubMed
-
- Ullrich T, Quentin M, Arsov C, et al. Risk stratification of equivocal lesions on multiparametric magnetic resonance imaging of the prostate. J Urol. 2018;199(3):691‐698. - PubMed
Publication types
MeSH terms
Substances
LinkOut - more resources
Full Text Sources
Medical
Research Materials
Miscellaneous
