. 2022 Aug 26;50(15):8929-8946.
doi: 10.1093/nar/gkac673.

FOXL2 and FOXA1 cooperatively assemble on the TP53 promoter in alternative dimer configurations

Affiliations

FOXL2 and FOXA1 cooperatively assemble on the TP53 promoter in alternative dimer configurations

Yuri Choi et al. Nucleic Acids Res. .

Abstract

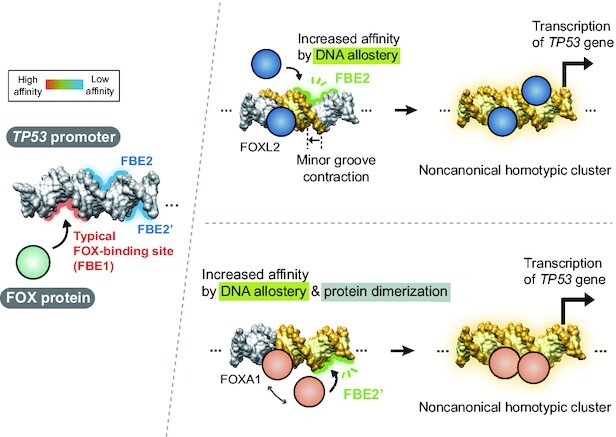
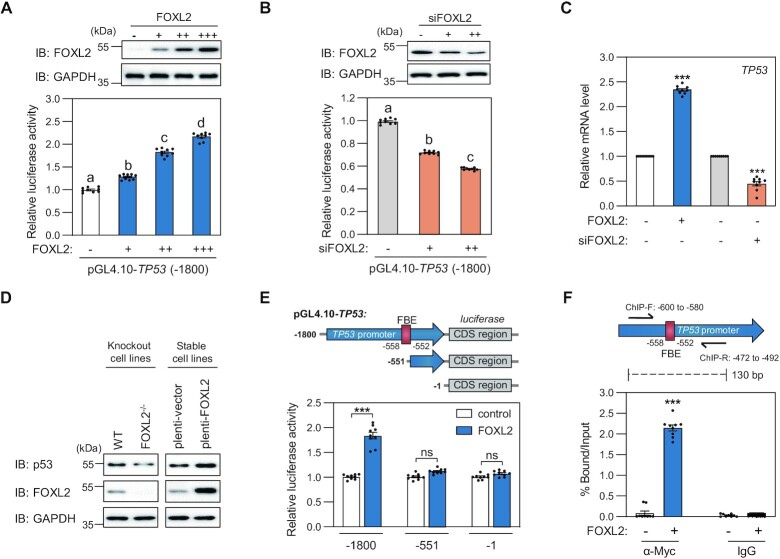
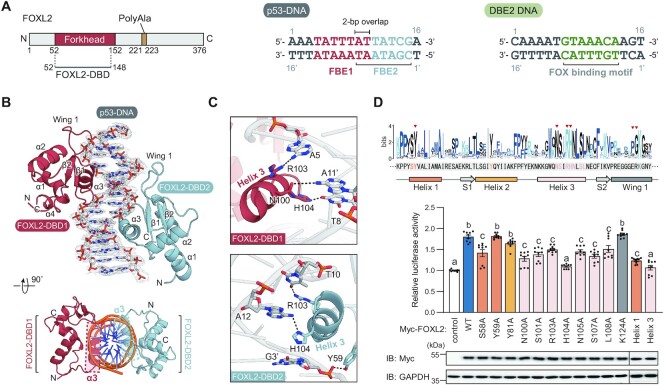
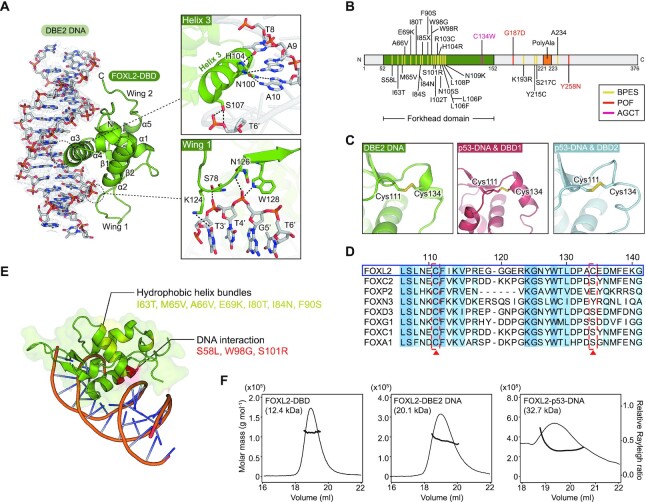
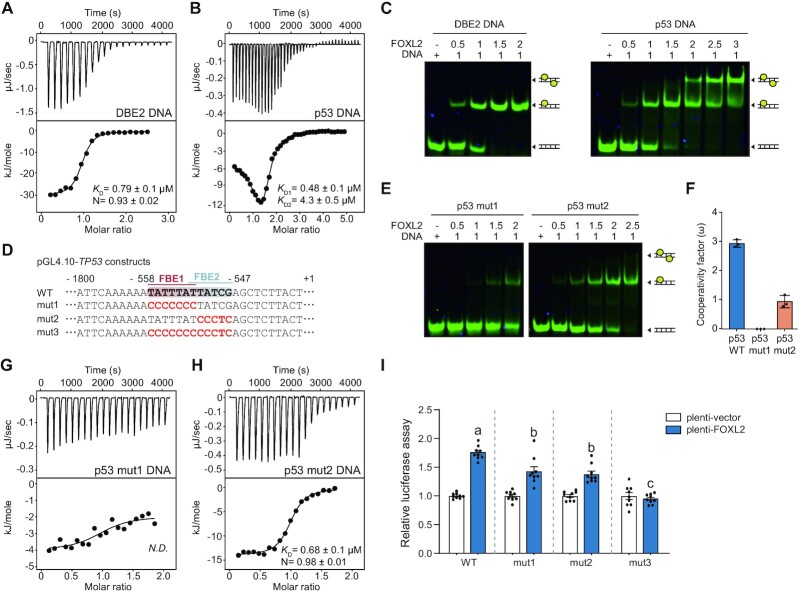
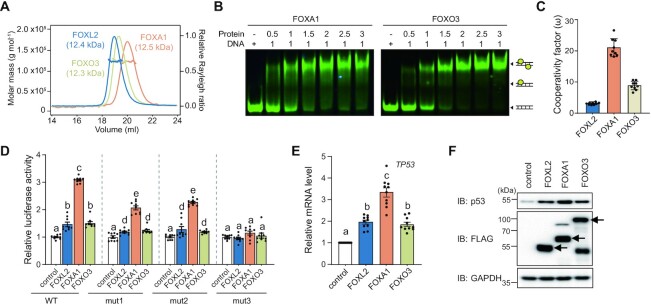
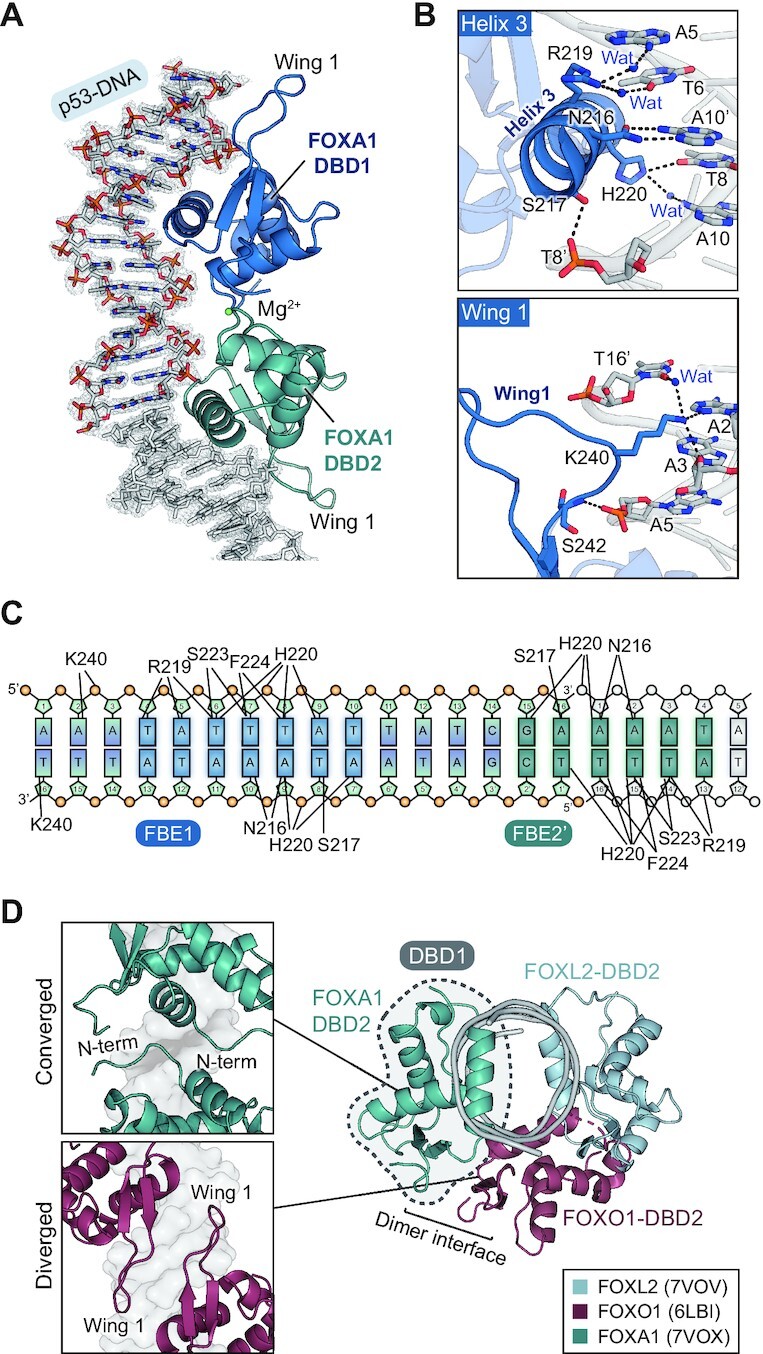
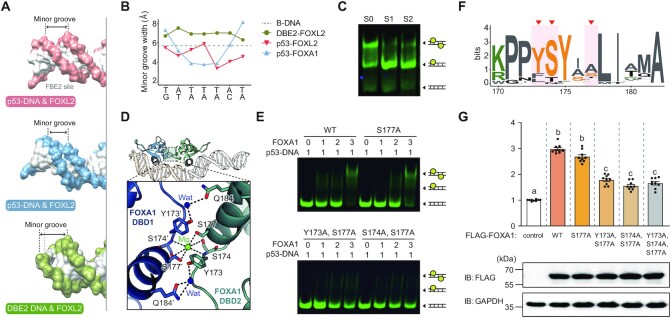
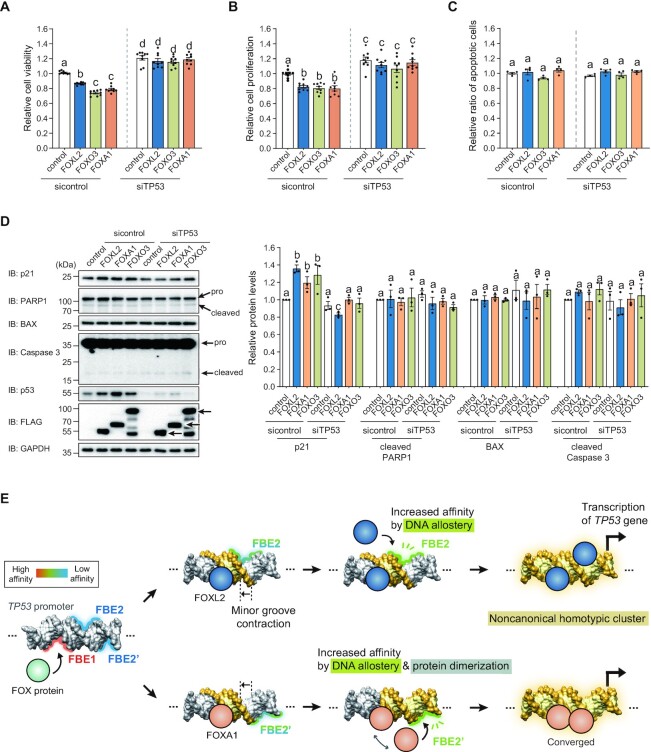
Although both the p53 and forkhead box (FOX) family proteins are key transcription factors associated with cancer progression, their direct relationship is unknown. Here, we found that FOX family proteins bind to the non-canonical homotypic cluster of the p53 promoter region (TP53). Analysis of crystal structures of FOX proteins (FOXL2 and FOXA1) bound to the p53 homotypic cluster indicated that they interact with a 2:1 stoichiometry accommodated by FOX-induced DNA allostery. In particular, FOX proteins exhibited distinct dimerization patterns in recognition of the same p53-DNA; dimer formation of FOXA1 involved protein-protein interaction, but FOXL2 did not. Biochemical and biological functional analyses confirmed the cooperative binding of FOX proteins to the TP53 promoter for the transcriptional activation of TP53. In addition, up-regulation of TP53 was necessary for FOX proteins to exhibit anti-proliferative activity in cancer cells. These analyses reveal the presence of a discrete characteristic within FOX family proteins in which FOX proteins regulate the transcription activity of the p53 tumor suppressor via cooperative binding to the TP53 promoter in alternative dimer configurations.


Figures

Graphical Abstract
Graphical Abstract
Cooperative regulation of non-canonical homotypic cluster by Forkhead-box family.
Figure 1.
Figure 1.
Transcriptional regulation of TP53 by FOXL2. (A, B) Luciferase reporter assay was used to determine the activation or inhibition of TP53 transcription in HeLa cells after transfection with increasing amounts of (A) FOXL2 expression plasmids (0, 50, 100 or 200 ng) or (B) siRNA targeting FOXL2 (0, 100 and 200 nM). Data are presented as the mean ± SEM of three independent experiments performed in triplicate. Different letters denote statistically significantly differences (P< 0.05). The expression of FOXL2 was confirmed by western blot. (C) Changes of TP53 mRNA were analyzed in FOXL2-overexpressing or silenced HeLa cells by qRT-PCR. Data are presented as the mean ± SEM of three independent experiments performed in triplicate. Asterisks indicate statistically significant differences (***P< 0.001). (D) Changes of p53 protein levels in FOXL2 KO KGN cells and stably transfected KGN cells. (E, F) Identification of FOXL2-binding elements on TP53 promoter DNA. pGL4.10-TP53 promoter constructs were generated to identify the FOXL2-binding sites. (E) Luciferase reporter assay was performed after transfection with TP53 constructs in HeLa cells expressing exogenous FOXL2. (F) ChIP assay was conducted in control or FOXL2-transfected HeLa cells using anti-Myc or IgG antibodies. The DNA region containing the FBE was amplified and quantitated by qRT-PCR using the precipitated chromatin fragment. Data are presented as the mean ± SEM of three independent experiments performed in triplicate. Asterisks indicate statistically significant differences (***P< 0.001).
Figure 2.
Figure 2.
Crystal structure of FOXL2 in complex with p53-DNA. (A) Domain architecture of FOXL2 and DNA sequences used in this study. The construct used in this study is indicated by a gray line. The two DNA sequences (p53-DNA and DBE2 DNA) used in the structural study are shown. The FOX-binding sites observed in the crystal structures are highlighted in color. (B) Crystal structure of the FOXL2-DBD in complex with p53-DNA. DNA sequences are shown, and FOXL2-DBD1 and FOXL2-DBD2 are colored in red and skyblue, respectively. The picture at the bottom shows a 90° rotation around the horizontal axis, and helix 3 in each DBD is highlighted in a dashed box. 2Fo-Fc electron density maps (1.0 σ) of DNA are shown. (C) Magnified views show details of the interaction at the interface of p53-DNA and FOXL2-DBD1 or FOXL2-DBD2. Hydrogen bonds are represented by black dashed lines. (D) The effect of mutations of FOXL2 key binding residues on TP53 transcriptional activation was determined by luciferase reporter assay. Data are presented as the mean ± SEM of three independent experiments performed in triplicate. Different letters denote statistically significantly differences (P< 0.05). The equal expression of FOXL2 mutants was detected by western blot, and GAPDH was used as a loading control.
Figure 3.
Figure 3.
Disease-associated mutations in FOXL2. (A) Crystal structure of FOXL2-DBD in complex with DBE2 DNA. The DNA sequences used are shown, and FOXL2-DBD is colored in green. 2Fo-Fc electron density maps (1.0 σ) of DNA are shown. On the right side, magnified views show details of the interaction at the interface of DBE2 DNA and FOXL2-DBD (helix 3 and wing 1). Hydrogen bonds are represented with black dashed lines. (B) Representative disease-associated mutations in FOXL2 are indicated in domain architecture. The forkhead domain is colored in green. Mutation sites related to BPES, POF and adult granulosa cell tumor (AGCT) are colored in yellow, orange and pink, respectively. (C) Disulfide bond observed in crystal structures of FOXL2. Cys111 and Cys134 in each FOXL2-DBD (FOXL2-DBD in the DBE2 DNA complex, FOXL2-DBD1 and FOXL2-DBD2 in the p53 DNA complex) are shown in green, red and skyblue, respectively. (D) Sequence alignment of FOX proteins is shown. Conserved residues are colored in blue. Cys111 and Cys134 are highlighted in a red box. (E) BPES-associated mutations are shown in the crystal structure of FOXL2, and classified into two groups; hydrophobic helix bundles in yellow and DNA interaction in red. (F) The molecular weight of FOXL2-DBD, FOXL2-DBD in complex with DBE2 DNA and FOXL2-DBD in complex with p53-DNA was measured by SEC-MALS. The thick line represents measured molecular mass.
Figure 4.
Figure 4.
Cooperative binding pattern of FOXL2 on the TP53 promoter. (A,B) Representative ITC fitting results of FOXL2-DBD with (A) DBE2 DNA and (B) p53-DNA. The thermodynamic data were collected by titrating FOXL2-DBD into each DNA, and the parameters were calculated by fitting to a single-binding model for DBE2 DNA or multiple-site binding model for p53-DNA. (C) EMSA results of FOXL2-DBD using DNA probes with DBE2 DNA and p53-DNA. Cy5-labeled double-stranded DNA (2.5 μM) was incubated at the indicated molar ratio. The dimer, monomer and free DNA are illustrated. (D) Mutant DNA sequences in pGL4.10-TP53 constructs. FBE1 and FBE2 sites are colored in red and skyblue, respectively. Mutated sequences are highlighted in red. (E) EMSA results of FOXL2-DBD using DNA probes with p53 mut1 DNA and p53 mut2 DNA. Cy5-labeled double-stranded DNA (2.5 μM) was incubated at the indicated molar ratio. (F) Cooperativity factors (ω) calculated from the fractions of band intensity observed in the quantitative EMSAs (52). The data are presented as means ± SEM (n = 3). Relative fraction intensities are shown in Supplementary Figure S4. (G,H) Representative ITC fitting results of FOXL2-DBD with (G) p53 mut1 DNA and (H) p53 mut2 DNA. The thermodynamic data were collected by titrating FOXL2-DBD into each DNA, and the parameters were calculated by fitting to a single-binding model. (I) Luciferase reporter assay with KGN cells stably expressing FOXL2 using the wild type (WT), mut1 and mut2 pGL4.10-TP53 constructs. Data are presented as the mean ± SEM of three independent experiments performed in triplicate. Different letters denote statistically significantly differences (P< 0.05).
Figure 5.
Figure 5.
Cooperative binding pattern of FOX proteins on the TP53 promoter. (A) The molecular weight of FOXL2, FOXO3 and FOXA1 measured by SEC-MALS. FOXL2, FOXO3 and FOXA1 are colored in blue, beige and orange, respectively. The thick line represents the measured molecular mass. (B) EMSA results of FOXA1-DBD and FOXO3-DBD using p53-DNA probes. Cy5-labeled double-stranded DNA (2.5 μM) was incubated at the indicated molar ratio. The dimeric protein–DNA complex, monomeric protein–DNA complex and free DNA are illustrated. (C) Cooperativity factors (ω) calculated from the fractions of band intensity observed in the quantitative EMSAs. FOXL2, FOXO3 and FOXA1 are colored in blue, beige and orange, respectively. Relative fraction intensities are shown in Supplementary Figure S4D and E. Data are presented as the mean ± SEM of three independent experiments performed in triplicate. (D–F) The regulation of TP53 transcription by FOX proteins (FOXO3 and FOXA1) was detected by (D) luciferase assay using wild-type (WT), mut1 and mut2 pGL4.10-TP53 constructs, (E) TP53 mRNA levels, (F) p53 protein levels. Data are presented as the mean ± SEM of three independent experiments performed in triplicate. Different letters denote statistically significantly differences (P< 0.05).
Figure 6.
Figure 6.
Crystal structure of FOXA1 in complex with p53-DNA. (A) Overall crystal structure of FOXA1-DBD in complex with p53-DNA. DNA sequences are shown. FOXA1-DBD1 and FOXA1-DBD2 are colored in blue and light teal, respectively. 2Fo-2c electron density maps (1.0 σ) of DNA are shown. (B) Magnified views showing details of the interaction at the interface of p53-DNA with FOXA1-DBD1 (helix 3 and wing 1). Hydrogen bonds are represented with black dashed lines. Water molecules are shown in blue spheres. (C) Schematic diagram of the FOXA1-DBD and p53-DNA interactions observed in the crystal structure. (D) Structural comparisons of the FOXL2-DBD:p53-DNA complex, FOXA1-DBD:p53-DNA complex and FOXO1-DBD in complex with DIV2 DNA (PDB ID: 6LBI). The location of FOX-DBD1 molecules is shown in a dashed circle. The dimer interface between FOXA1-DBD or FOXO1-DBD molecules is shown in magnified view. FOXL2-DBD, FOXA1-DBD and FOXO1-DBD are colored in skyblue, light teal and burgundy, respectively.
Figure 7.
Figure 7.
DNA allostery is a key factor for homotypic cooperativity of FOX proteins. (A) DNA surfaces in three crystal structures of FOX-DNA complexes (FOXL2-DBD:DBE2 DNA, FOXL2-DBD:p53-DNA and FOXA1-DBD:p53-DNA in green, red and skyblue, respectively). Black arrows indicate the minor groove width. (B) Minor groove widths of DNA in the structures of B-DNA (gray), FOXL2-DBD:DBE2 DNA (green), FOXL2-DBD:p53-DNA (red) and FOXA1-DBD:p53-DNA (skyblue). Groove paramaters were analyzed using Curves+ (83). (C) EMSA results of FOXL2-DBD using the probes p53-DNA (S0), 1 bp spacer p53-DNA (S1) and 2 bp spacer p53-DNA (S2). The dimeric protein–DNA complex, monomeric protein–DNA complex and free DNA are illustrated. For spacer design, see also Supplementary Figure S6B. (D) Details of the interactions at the interface between FOXA1-DBD1 (blue) and FOXL2-DBD2 (light teal). Hydrogen bonds are represented by black dashed lines. Water molecules and Mg2+ are shown in blue and green spheres, respectively. (E) EMSA results of FOXA1 variants, which substituted the key interaction residues to alanine, using p53-DNA probes. FOXA1 variants of S177A, Y173A/S177A and S174A/S177A mutation were used. The dimeric protein–DNA complex, monomeric protein–DNA complex and free DNA are illustrated. (F) Sequence logos of the corresponding region encompassing Y173, S174 and S177 of FOXA1 among FOX family proteins. The positions of Y173, S174 and S177 in FOXA1 are highlighted with red triangles. (G) Results of the luciferase reporter assay performed in cells transfected with plasmids encoding different FOXA1 mutants (S177A, Y173A/S177A, S174A/S177A and Y173A/S174A/S177A). Equal expression of FOXA1 mutants was determined by western blot. GAPDH was used as a loading control. Data are presented as the mean ± SEM of three independent experiments performed in triplicate. Different letters denote statistically significantly differences (P< 0.05).
Figure 8.
Figure 8.
Homotypic cooperativity of FOX proteins in modulating the TP53 promoter. The effect of FOX proteins on (A) cell viability, (B) proliferation and (C) apoptosis was examined in control or siTP53-silenced HeLa cells. Data are presented as the mean ± SEM of three independent experiments performed in triplicate. Different letters denote statistically significant differences (P< 0.05). (D) Protein changes involving the cell cycle (p21 level) and apoptosis (BAX level and cleaved PARP1 and Caspase 3) in HeLa cells were assessed by western blot analysis using the respective antibodies. Representative blots (left panel) and quantitative data (mean ± SEM; right panel) from three independent experiments performed are presented. (E) Proposed model of DNA allostery mechanism of FOX proteins in regulation of the TP53 homotypic cluster. The minor groove width became narrower when FOX proteins bound to the FBE1 site, creating the second binding site FBE2 (or FBE2′) by increasing their binding affinities.

Similar articles

Cited by

References

    1. Levine A.J. p53, the cellular gatekeeper for growth and division. Cell. 1997; 88:323–331. - PubMed
    1. Bieging K.T., Mello S.S., Attardi L.D.. Unravelling mechanisms of p53-mediated tumour suppression. Nat. Rev. Cancer. 2014; 14:359–370. - PMC - PubMed
    1. Hainaut P., Hernandez T., Robinson A., Rodriguez-Tome P., Flores T., Hollstein M., Harris C.C., Montesano R.. IARC database of p53 gene mutations in human tumors and cell lines: updated compilation, revised formats and new visualisation tools. Nucleic Acids Res. 1998; 26:205–213. - PMC - PubMed
    1. Boggs K., Reisman D. C/EBP participates in regulating transcription of the p53 gene in response to mitogen stimulation. J. Biol. Chem. 2007; 282:7982–7990. - PubMed
    1. Takaoka A., Hayakawa S., Yanai H., Stoiber D., Negishi H., Kikuchi H., Sasaki S., Imai K., Shibue T., Honda K.et al. .. Integration of interferon-α/β signalling to p53 responses in tumour suppression and antiviral defence. Nature. 2003; 424:516–523. - PubMed

Publication types

MeSH terms