. 2022 Oct 6;23(19):e202200399.
doi: 10.1002/cbic.202200399. Epub 2022 Aug 23.

The Fluorescent Enzyme Cascade Detects Low Abundance Protein Modifications Suitable for the Assembly of Functionally Annotated Modificatome Databases

Affiliations

The Fluorescent Enzyme Cascade Detects Low Abundance Protein Modifications Suitable for the Assembly of Functionally Annotated Modificatome Databases

Isabel J Hoppe et al. Chembiochem. .

Abstract

Pathophysiological functions of proteins critically depend on both their chemical composition, including post-translational modifications, and their three-dimensional structure, commonly referred to as structure-activity relationship. Current analytical methods, like capillary electrophoresis or mass spectrometry, suffer from limitations, such as the detection of unexpected modifications at low abundance and their insensitivity to conformational changes. Building on previous enzyme-based analytical methods, we here introduce a fluorescence-based enzyme cascade (fEC), which can detect diverse chemical and conformational variations in protein samples and assemble them into digital databases. Together with complementary analytical methods an automated fEC analysis established unique modification-function relationships, which can be expanded to a proteome-wide scale, i. e. a functionally annotated modificatome. The fEC offers diverse applications, including hypersensitive biomarker detection in complex samples.

Keywords: analytical methods; conformation analysis; enzymes; functional annotation; protein modifications.


Conflict of interest statement

Hans Brandstetter holds a patent on the enzyme cascade based detection method (US patent 10,775,384).

Figures

Figure 1
Figure 1
Overview of the classic enzyme cascade (cEC). Schematic representation of the method principle where subsequent enzymatic steps exponentially enhance differences between protein variants.
Figure 2
Figure 2
Elements required for glutamine donor peptides used in the cEC and in the first iteration of the fluorescent enzyme cascade (fEC). (A) Z−Gln−Gly−CAD‐Biotin (Gln‐biotin) used in the cEC. (B) Ac−Gln−Gly−Gly−Ser−Lys(Cy5.5)−OH used in the first fEC trials. Common elements, from left to right, are the capping group for protection of the N‐terminus (green), Gln−Gly dipeptide motif that is recognized by microbial transglutaminase (MTG) (red), linker to avoid steric problems during MTG binding and biotin‐streptavidin interaction (yellow), and detection label (blue). Both structures were drawn using ACD/ChemSketch 2020 1.2 (ACD/Labs, Toronto, Canada).
Figure 3
Figure 3
Comparison of initial fEC results with the cEC. Lane 1: native Rituximab, lane 2: UV‐stressed Rituximab, lane 3: heat‐stressed Rituximab. Overall signal intensity increase over the native sample is indicated under each lane (A) First generation of the fEC: Transglutamination carried out using Gln‐CY5.5 label, samples resolved on SDS‐PAGE and imaged directly in gel cassette. Orange: 800 nm (MW ladder), blue: 700 nm. (B) cEC: Transglutamination carried out using Gln‐biotin label, samples resolved on SDS‐PAGE, blotted to membrane, and detected via chemiluminescence. (C) Ligand and fluorescent label used for the second generation fEC, colour code identical to Figure 2, alkyne‐azide pair for CuAAC in grey (D) Second generation of fEC: Transglutamination carried out using Gln‐alkyne, modified protein labelled with CY5.5 via copper‐catalysed azide‐alkyne cycloaddition (CuAAC), samples resolved on SDS‐PAGE and imaged directly in gel cassette. Marker M in orange: 800 nm, blue: 700 nm.
Figure 4
Figure 4
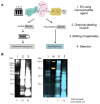
Evaluation of the effect of ligand composition, blotting process and detection method on the differential signal achieved in the EC. (A) Schematic of the experimental workflow. 1. EC treatment of three different Rituximab samples (1: native, 2: UV‐stressed, 3: heat‐stressed) using an improved mTG ligand containing an azide for CuAAS; 2. All samples divided in two and labelled via CuAAC with a biotin‐ and a fluorophore‐alkyne; 3. All samples were resolved on SDS‐PAGE, biotin‐labelled samples were then blotted onto a membrane and detected via chemiluminescence, fluorescence‐labelled samples were imaged at 700 nm directly in the SDS‐PAGE cassette. (B) Results of the experiment, arranged under the corresponding experimental setup from (A). Lane 1: native, lane 2: UV‐stressed, lane 3: heat‐stressed. White: chemiluminescence, orange: 800 nm (MW ladder M), blue: 700 nm. Overall signal intensity increase over the corresponding native sample is indicated under each lane.
Figure 5
Figure 5
Application example of the fEC. (A) Structural changes in calmodulin. Ca2+‐bound calmodulin (PDB: 3CLN) vs. apo‐calmodulin (PDB: 1CFC). Green: Ca2+, cyan: α‐helix, pink: β‐sheet, peach: coil. (B) Detection of structural changes in calmodulin caused by depletion of calcium (achieved by addition of EDTA) by two‐step fEC. Orange: 800 nm (MW ladder M), blue: 700 nm.
Figure 6
Figure 6
Absolute quantification and one‐pot fEC labelling. Orange: 800 nm (MW ladder M), blue: 700 nm. (A) Sequential, 2‐step fEC of three different Rituximab samples. Absolute quantification of the degree of labelling shown in the bar graph underneath each lane. At high Cy5.5 emission intensity a slight orange colour cast is visible, which is caused by the Cy5.5 emission shoulder at 800 nm. (B) One‐pot fEC of three different Rituximab samples. Proteolysis and transglutamination were carried out simultaneously instead of sequentially. Absolute quantification of the degree of labelling shown in the bar graph underneath each lane.
Figure 7
Figure 7
Overview of the automated analysis of fEC data. (A) Gel cassette recognition. The software recognizes characteristic edges, including the gel boundaries and the border between stacking and resolving gel (dashed line). Subsequently the gel was rotated to optimize the vertical alignment of the gel lanes, Figure 7A. (B) Marker band assignment. In a next step individual lanes were assigned with the bottom of the gel cassette and the top of the resolving gel serving as the lanes’ lower and upper boundary, respectively. The width of the lanes was calculated from the specified number of lanes per gel. The fluorescently labelled marker bands were recognized by their prominence and assigned as per specification, Figure 7B. (C) Calibration of sample bands. For the mass assignment, the information of the defined marker proteins is used, allowing for a mass assignment to each running distance in the SDS‐PAGE by inter‐ and extrapolation. The fluorescent intensities representing the protein bands are then plotted against the molecular weight for each lane (Figure 7C). (D) Correlation analysis. With consistent mass assignment, fEC fluorescence intensities can be correlated and compared quantitatively across different experiments (Figure 7D).
Figure 8
Figure 8
Classification of structural impurities in Rituximab. Orange: 800 nm (MW ladder M), blue: 700 nm. (A) Library samples and identical replicates thereof (1. native, 2: UV‐stressed, 3: heat‐stressed, 4: deglycosylated protein) after two‐step fEC (limited proteolysis using pepsin followed by transglutamination) run on two different SDS‐PAGE gels to show reproducibility between gels. Heat map shows the squared correlation coefficient (R2) determined by the described MatLab script. (B) Library samples (1: native, 2: 10’ UV stress, 3: full deglycosylation) and variations thereof (A: 5’ UV stress, B: 20 % deglycosylated protein spiked into native sample) after two‐step fEC (limited proteolysis using pepsin followed by transglutamination), analysed on two SDS‐PAGE runs. Heat map shows the squared correlation coefficient (R2) determined by the described MatLab script.

References

    1. Garrett R. H. G., Charles M., Biochemistry, Brooks/Cole, Cengage Learning, 2013.
    1. Franic D., Zubcic K., Boban M., Biomol. Eng. 2021, 11, 54. - PMC - PubMed
    1. Gottesman S., Wickner S., Maurizi M. R., Genes Dev. 1997, 11, 815–823. - PubMed
    1. Kohler V., Andreasson C., Biol. Chem. 2020, 401, 1233–1248. - PubMed
    1. Walsh G., Drug Discovery Today 2010, 15, 773–780. - PubMed

Publication types

MeSH terms

LinkOut - more resources