

ABC portal: a single-cell database and web server for blood cells
- PMID: 35920330
- PMCID: PMC9825444
- DOI: 10.1093/nar/gkac646
ABC portal: a single-cell database and web server for blood cells
Abstract
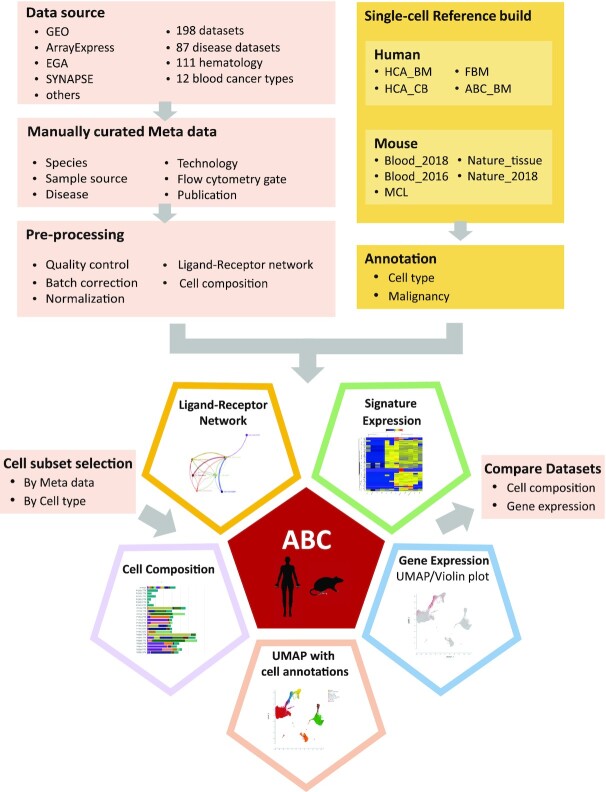
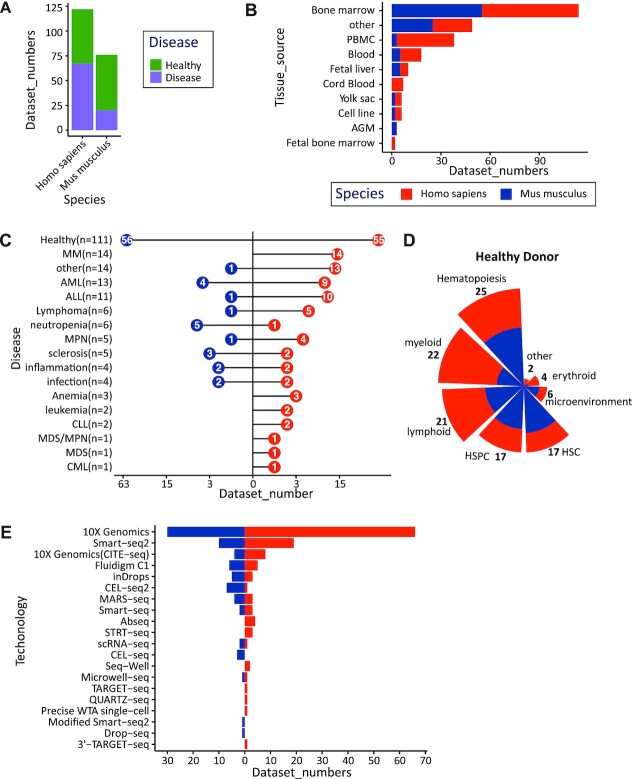
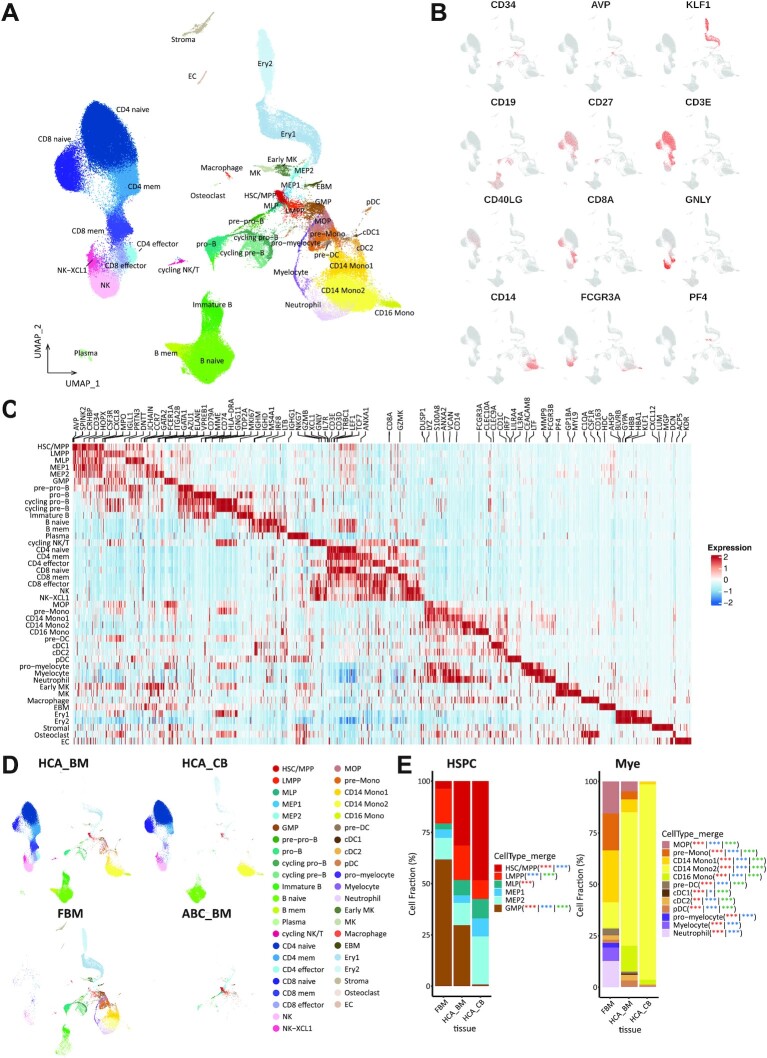
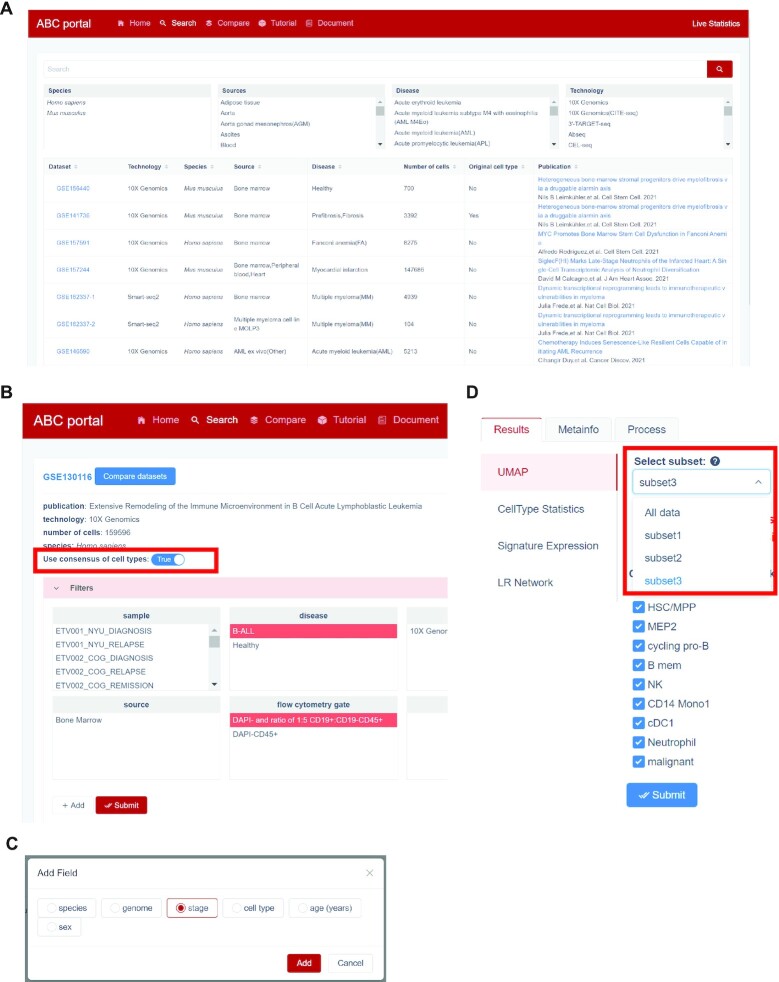
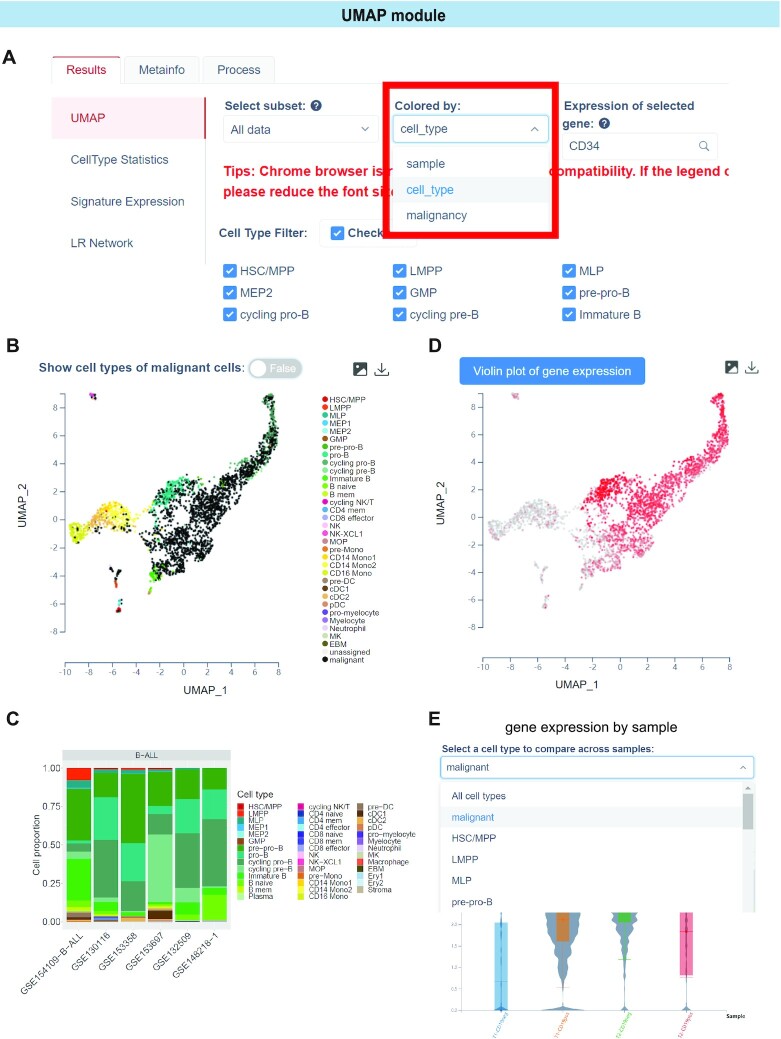
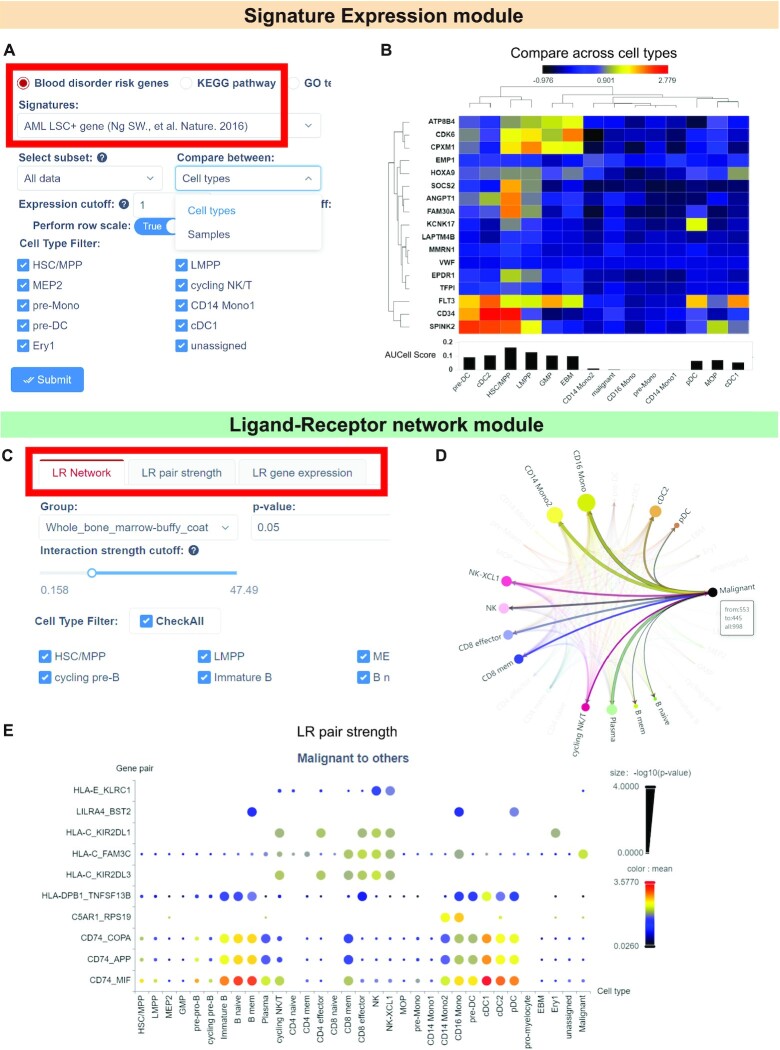
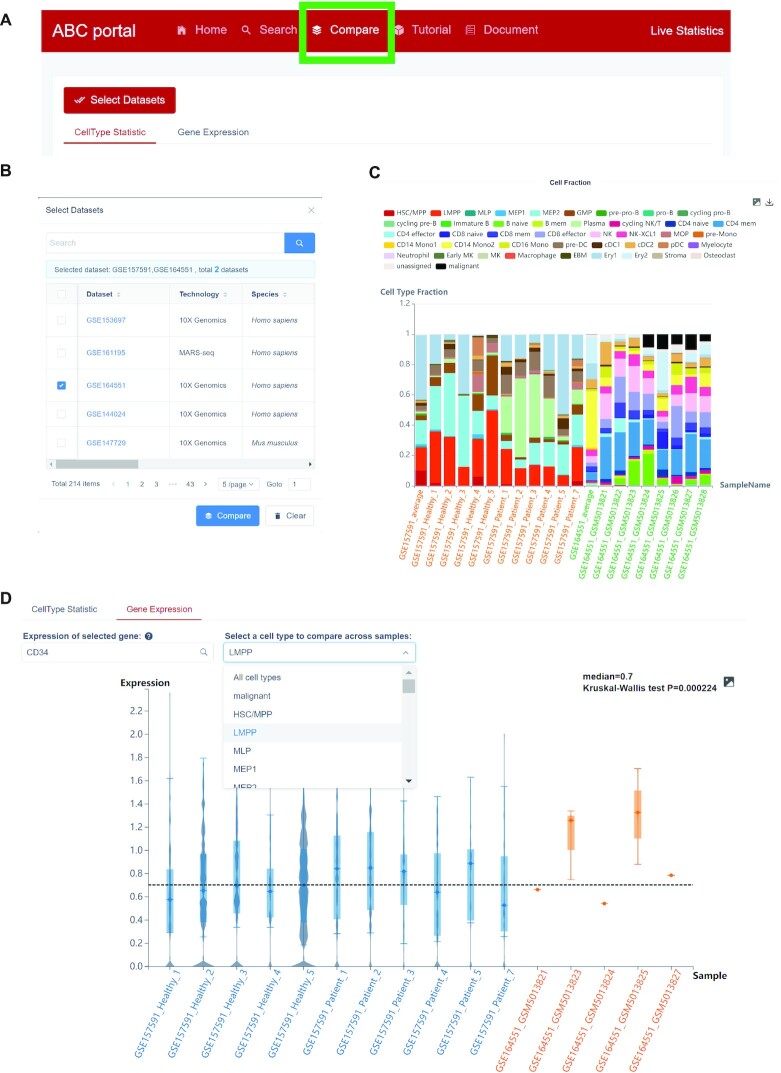
ABC portal (http://abc.sklehabc.com) is a database and web portal containing 198 single-cell transcriptomic datasets of development, differentiation and disorder of blood/immune cells. All the datasets were re-annotated with a manually curated and unified single-cell reference, especially for the haematopoietic stem and progenitor cells. ABC portal provides web-based interactive analysis modules, especially a comprehensive cell-cell communication analysis and disease-related gene signature analysis. Importantly, ABC portal allows customized sample selection based on a combination of several metadata for downstream analysis and comparison analysis across datasets. ABC portal also allows users to select multiple cell types for analysis in the modules. Together, ABC portal provides an interactive interface of single-cell data exploration and re-analysis with customized analysis modules for the researchers and clinicians, and will facilitate understanding of haematopoiesis and blood/immune disorders.
© The Author(s) 2022. Published by Oxford University Press on behalf of Nucleic Acids Research.
Figures
Similar articles
-
IBDTransDB: a manually curated transcriptomic database for inflammatory bowel disease.Database (Oxford). 2024 Mar 28;2024:baae026. doi: 10.1093/database/baae026. Database (Oxford). 2024. PMID: 38564306 Free PMC article.
-
CircadiOmics: circadian omic web portal.Nucleic Acids Res. 2022 Jul 5;50(W1):W183-W190. doi: 10.1093/nar/gkac419. Nucleic Acids Res. 2022. PMID: 35657089 Free PMC article.
-
HUSCH: an integrated single-cell transcriptome atlas for human tissue gene expression visualization and analyses.Nucleic Acids Res. 2023 Jan 6;51(D1):D1029-D1037. doi: 10.1093/nar/gkac1001. Nucleic Acids Res. 2023. PMID: 36318258 Free PMC article.
-
OralExplorer: a web server for exploring the mechanisms of oral inflammatory diseases.J Transl Med. 2024 Mar 15;22(1):282. doi: 10.1186/s12967-024-05019-8. J Transl Med. 2024. PMID: 38491529 Free PMC article.
-
CellAnn: a comprehensive, super-fast, and user-friendly single-cell annotation web server.Bioinformatics. 2023 Sep 2;39(9):btad521. doi: 10.1093/bioinformatics/btad521. Bioinformatics. 2023. PMID: 37610325 Free PMC article.
Cited by
-
scBlood: A comprehensive single-cell accessible chromatin database of blood cells.Comput Struct Biotechnol J. 2024 Jun 20;23:2746-2753. doi: 10.1016/j.csbj.2024.06.015. eCollection 2024 Dec. Comput Struct Biotechnol J. 2024. PMID: 39050785 Free PMC article.
-
A systematic overview of single-cell transcriptomics databases, their use cases, and limitations.Front Bioinform. 2024 Jul 8;4:1417428. doi: 10.3389/fbinf.2024.1417428. eCollection 2024. Front Bioinform. 2024. PMID: 39040140 Free PMC article. Review.
-
Single-cell Transcriptional Atlas of Human Hematopoiesis Reveals Genetic and Hierarchy-Based Determinants of Aberrant AML Differentiation.Blood Cancer Discov. 2025 Jul 1;6(4):307-324. doi: 10.1158/2643-3230.BCD-24-0342. Blood Cancer Discov. 2025. PMID: 40294241 Free PMC article.
-
Resolving Leukemia Heterogeneity and Lineage Aberrations with HematoMap.Genomics Proteomics Bioinformatics. 2025 May 30;23(2):qzaf005. doi: 10.1093/gpbjnl/qzaf005. Genomics Proteomics Bioinformatics. 2025. PMID: 39945785 Free PMC article.
-
The 2023 Nucleic Acids Research Database Issue and the online molecular biology database collection.Nucleic Acids Res. 2023 Jan 6;51(D1):D1-D8. doi: 10.1093/nar/gkac1186. Nucleic Acids Res. 2023. PMID: 36624667 Free PMC article.
References
-
- Brierley C.K., Mead A.J.. Single-cell sequencing in hematology. Curr. Opin. Oncol. 2020; 32:139–145. - PubMed
Publication types
MeSH terms
LinkOut - more resources
Full Text Sources
