

Full spectrum flow cytometry reveals mesenchymal heterogeneity in first trimester placentae and phenotypic convergence in culture, providing insight into the origins of placental mesenchymal stromal cells
- PMID: 35920626
- PMCID: PMC9371602
- DOI: 10.7554/eLife.76622
Full spectrum flow cytometry reveals mesenchymal heterogeneity in first trimester placentae and phenotypic convergence in culture, providing insight into the origins of placental mesenchymal stromal cells
Abstract
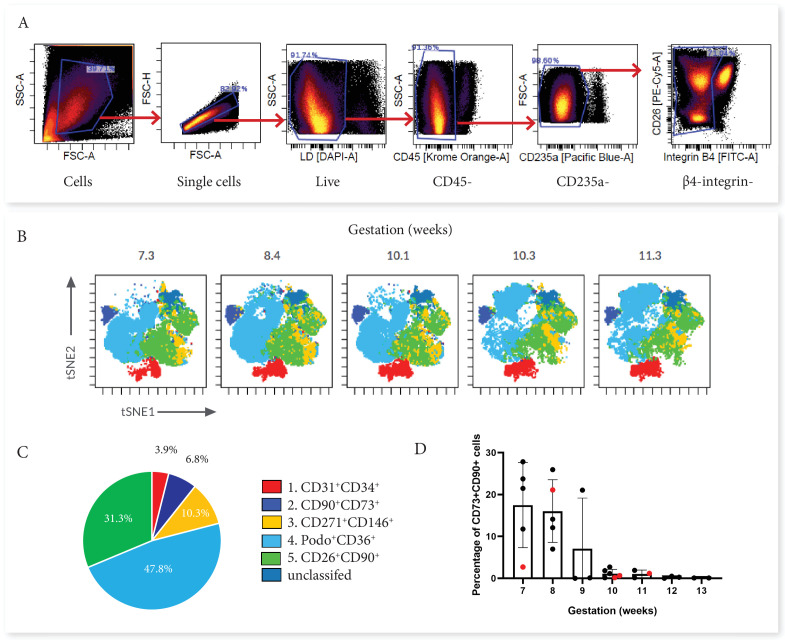
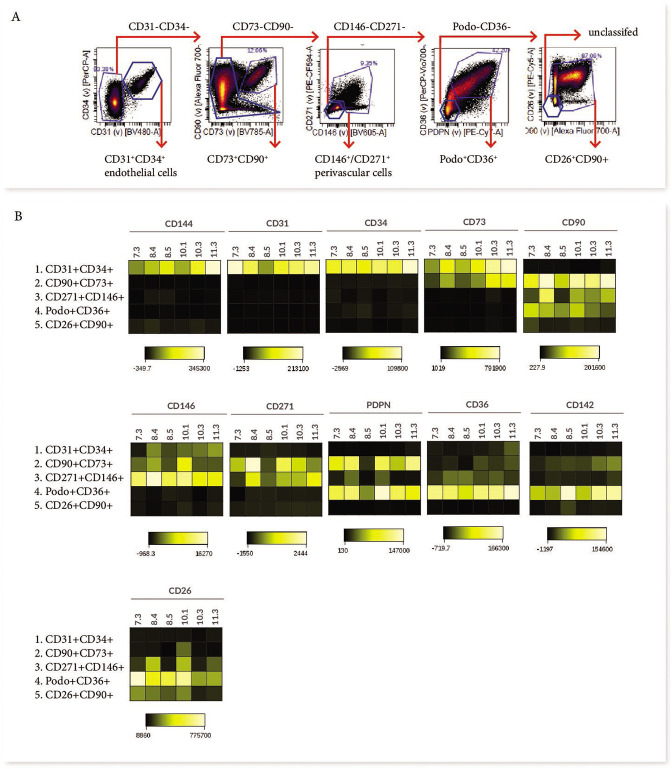
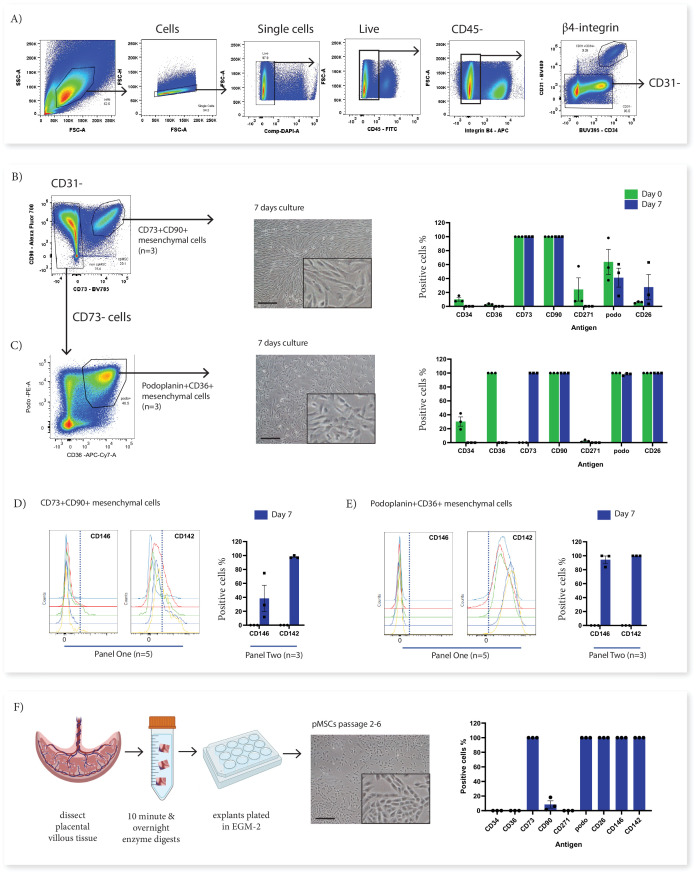
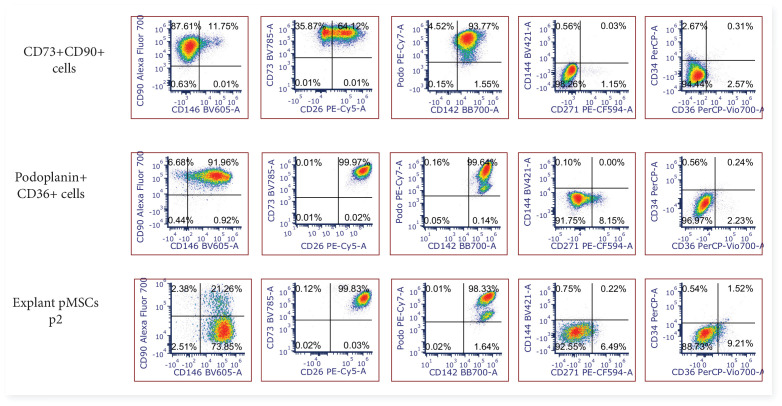
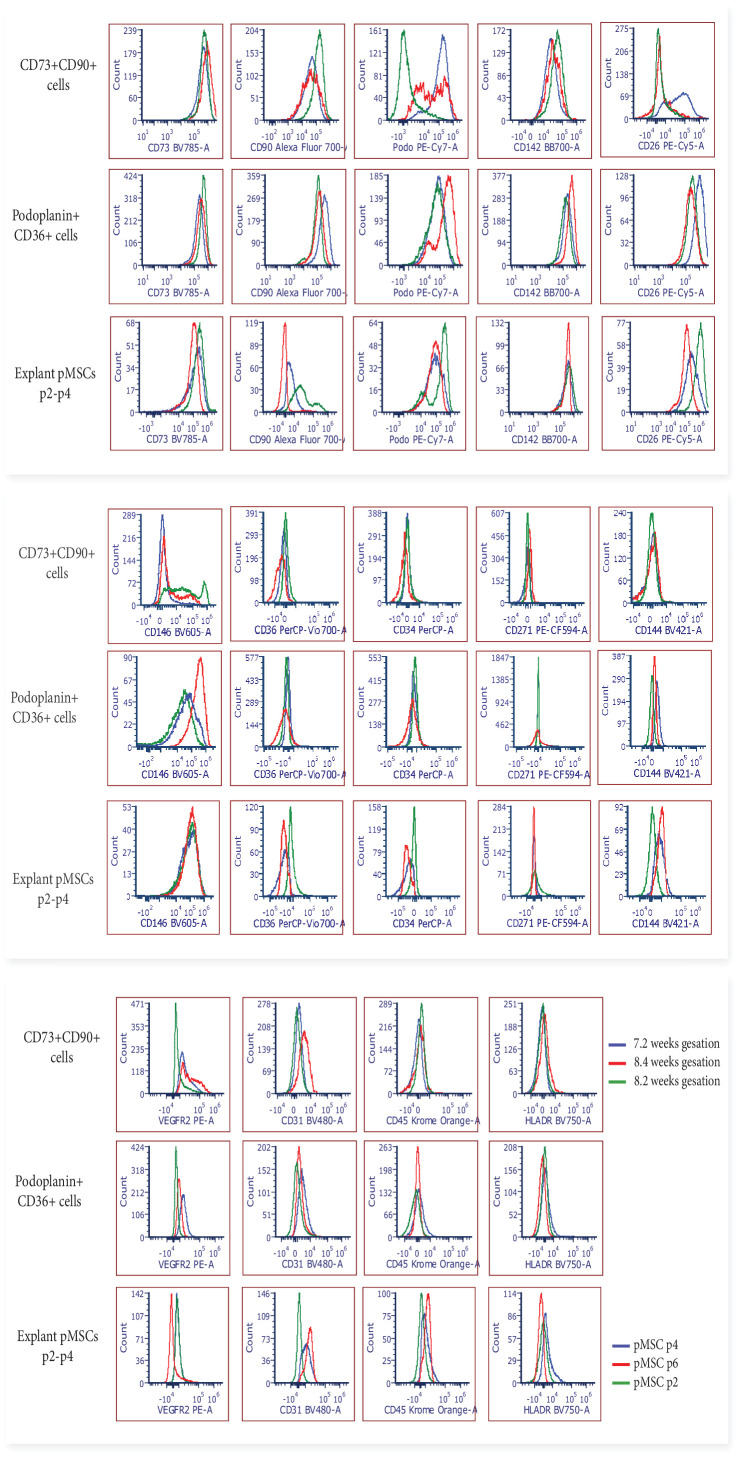
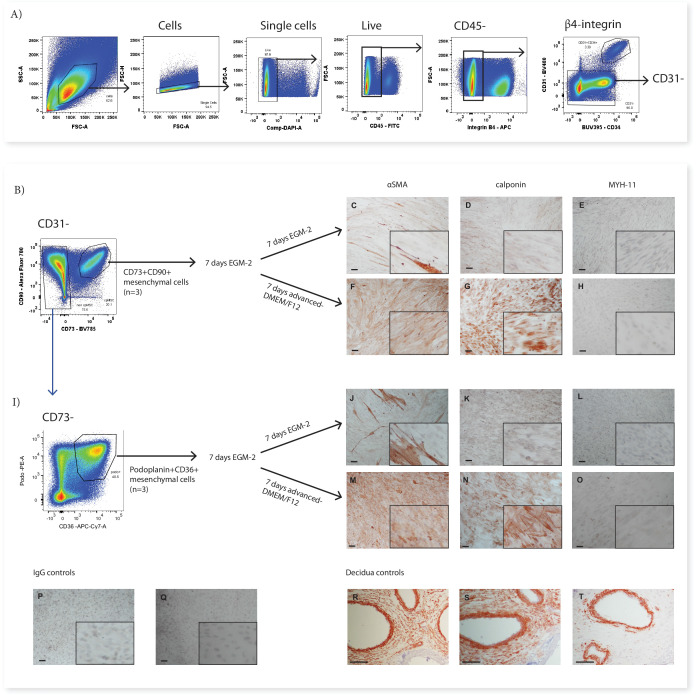
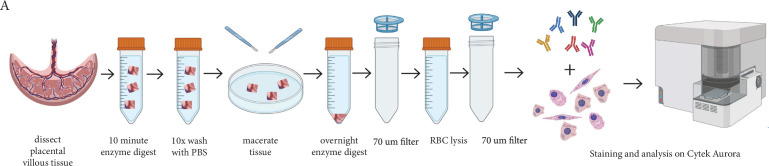
Single-cell technologies (RNA-sequencing, flow cytometry) are critical tools to reveal how cell heterogeneity impacts developmental pathways. The placenta is a fetal exchange organ, containing a heterogeneous mix of mesenchymal cells (fibroblasts, myofibroblasts, perivascular, and progenitor cells). Placental mesenchymal stromal cells (pMSC) are also routinely isolated, for therapeutic and research purposes. However, our understanding of the diverse phenotypes of placental mesenchymal lineages, and their relationships remain unclear. We designed a 23-colour flow cytometry panel to assess mesenchymal heterogeneity in first-trimester human placentae. Four distinct mesenchymal subsets were identified; CD73+CD90+ mesenchymal cells, CD146+CD271+ perivascular cells, podoplanin+CD36+ stromal cells, and CD26+CD90+ myofibroblasts. CD73+CD90+ and podoplanin + CD36+ cells expressed markers consistent with cultured pMSCs, and were explored further. Despite their distinct ex-vivo phenotype, in culture CD73+CD90+ cells and podoplanin+CD36+ cells underwent phenotypic convergence, losing CD271 or CD36 expression respectively, and homogenously exhibiting a basic MSC phenotype (CD73+CD90+CD31-CD144-CD45-). However, some markers (CD26, CD146) were not impacted, or differentially impacted by culture in different populations. Comparisons of cultured phenotypes to pMSCs further suggested cultured pMSCs originate from podoplanin+CD36+ cells. This highlights the importance of detailed cell phenotyping to optimise therapeutic capacity, and ensure use of relevant cells in functional assays.
Keywords: cell biology; flow cytometry; human; mesenchymal stromal cells; placental mesenchymal heterogeneity; regenerative medicine; stem cells.
© 2022, Boss et al.
Conflict of interest statement
AB, TD, TW, LC, JJ, AB No competing interests declared
Figures
Similar articles
-
In Vitro Cell Surface Marker Expression on Mesenchymal Stem Cell Cultures does not Reflect Their Ex Vivo Phenotype.Stem Cell Rev Rep. 2024 Aug;20(6):1656-1666. doi: 10.1007/s12015-024-10743-1. Epub 2024 Jun 5. Stem Cell Rev Rep. 2024. PMID: 38837115 Free PMC article.
-
Influence of culture media on the derivation and phenotype of fetal-derived placental mesenchymal stem/stromal cells across gestation.Placenta. 2020 Nov;101:66-74. doi: 10.1016/j.placenta.2020.09.002. Epub 2020 Sep 2. Placenta. 2020. PMID: 32932101
-
Human placental vascular and perivascular cell heterogeneity differs between first trimester and term, and in pregnancies affected by foetal growth restriction.Mol Hum Reprod. 2023 Nov 29;29(12):gaad041. doi: 10.1093/molehr/gaad041. Mol Hum Reprod. 2023. PMID: 38059603 Free PMC article.
-
Mesenchymal stem cell subpopulations: phenotype, property and therapeutic potential.Cell Mol Life Sci. 2016 Sep;73(17):3311-21. doi: 10.1007/s00018-016-2229-7. Epub 2016 May 3. Cell Mol Life Sci. 2016. PMID: 27141940 Free PMC article. Review.
-
Placental mesenchymal stromal cells as an alternative tool for therapeutic angiogenesis.Cell Mol Life Sci. 2020 Jan;77(2):253-265. doi: 10.1007/s00018-019-03268-1. Epub 2019 Aug 29. Cell Mol Life Sci. 2020. PMID: 31468060 Free PMC article. Review.
Cited by
-
A live-cell platform to isolate phenotypically defined subpopulations for spatial multi-omic profiling.PLoS One. 2023 Oct 11;18(10):e0292554. doi: 10.1371/journal.pone.0292554. eCollection 2023. PLoS One. 2023. PMID: 37819930 Free PMC article.
-
Primitive haematopoiesis in the human placenta gives rise to macrophages with epigenetically silenced HLA-DR.Nat Commun. 2023 Mar 30;14(1):1764. doi: 10.1038/s41467-023-37383-2. Nat Commun. 2023. PMID: 36997537 Free PMC article.
-
In Vitro Cell Surface Marker Expression on Mesenchymal Stem Cell Cultures does not Reflect Their Ex Vivo Phenotype.Stem Cell Rev Rep. 2024 Aug;20(6):1656-1666. doi: 10.1007/s12015-024-10743-1. Epub 2024 Jun 5. Stem Cell Rev Rep. 2024. PMID: 38837115 Free PMC article.
-
Surface Molecular Markers for the Isolation of Viable Fibroblast Subpopulations in the Female Reproductive Tract: A Comprehensive Review.Int J Mol Sci. 2024 Dec 30;26(1):233. doi: 10.3390/ijms26010233. Int J Mol Sci. 2024. PMID: 39796089 Free PMC article. Review.
-
Modelling human placental villous development: designing cultures that reflect anatomy.Cell Mol Life Sci. 2022 Jun 26;79(7):384. doi: 10.1007/s00018-022-04407-x. Cell Mol Life Sci. 2022. PMID: 35753002 Free PMC article. Review.
References
-
- Abumaree MH, Al Jumah MA, Kalionis B, Jawdat D, Al Khaldi A, Abomaray FM, Fatani AS, Chamley LW, Knawy BA. Human placental mesenchymal stem cells (pMSCs) play a role as immune suppressive cells by shifting macrophage differentiation from inflammatory M1 to anti-inflammatory M2 macrophages. Stem Cell Reviews and Reports. 2013;9:620–641. doi: 10.1007/s12015-013-9455-2. - DOI - PubMed
-
- Amir ED, Davis KL, Tadmor MD, Simonds EF, Levine JH, Bendall SC, Shenfeld DK, Krishnaswamy S, Nolan GP, Pe’er D. viSNE enables visualization of high dimensional single-cell data and reveals phenotypic heterogeneity of leukemia. Nature Biotechnology. 2013;31:545–552. doi: 10.1038/nbt.2594. - DOI - PMC - PubMed
-
- Barilani M, Banfi F, Sironi S, Ragni E, Guillaumin S, Polveraccio F, Rosso L, Moro M, Astori G, Pozzobon M, Lazzari L. Low-affinity nerve growth factor receptor (cd271) heterogeneous expression in adult and fetal mesenchymal stromal cells. Scientific Reports. 2018;8:9321. doi: 10.1038/s41598-018-27587-8. - DOI - PMC - PubMed
Publication types
MeSH terms
Substances
LinkOut - more resources
Full Text Sources
Research Materials
Miscellaneous
