. 2022 Aug 3:11:e76649.
doi: 10.7554/eLife.76649.

Tension-driven multi-scale self-organisation in human iPSC-derived muscle fibers

Affiliations

Tension-driven multi-scale self-organisation in human iPSC-derived muscle fibers

Qiyan Mao et al. Elife. .

Abstract

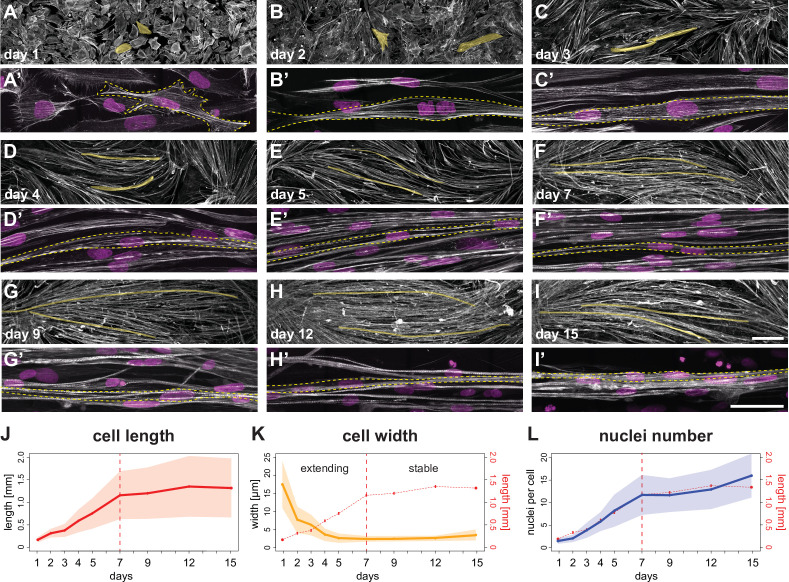
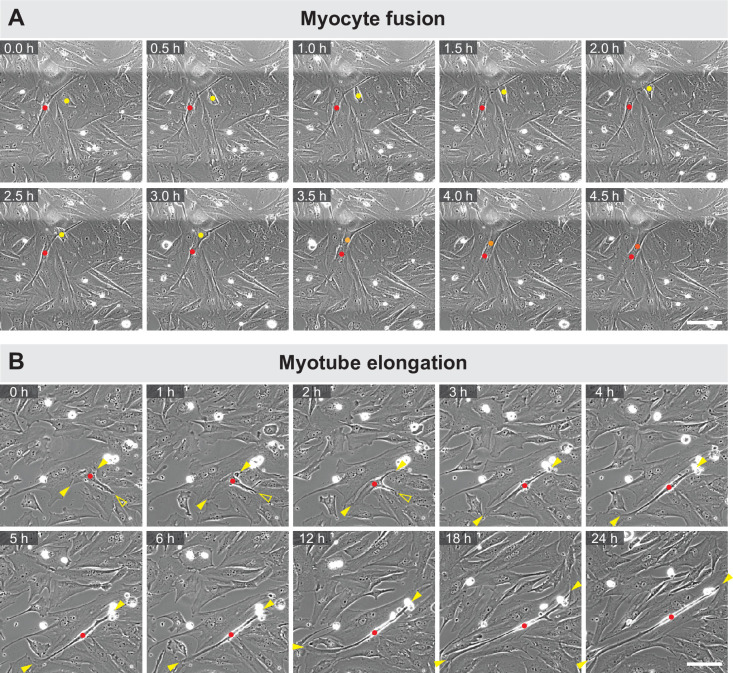
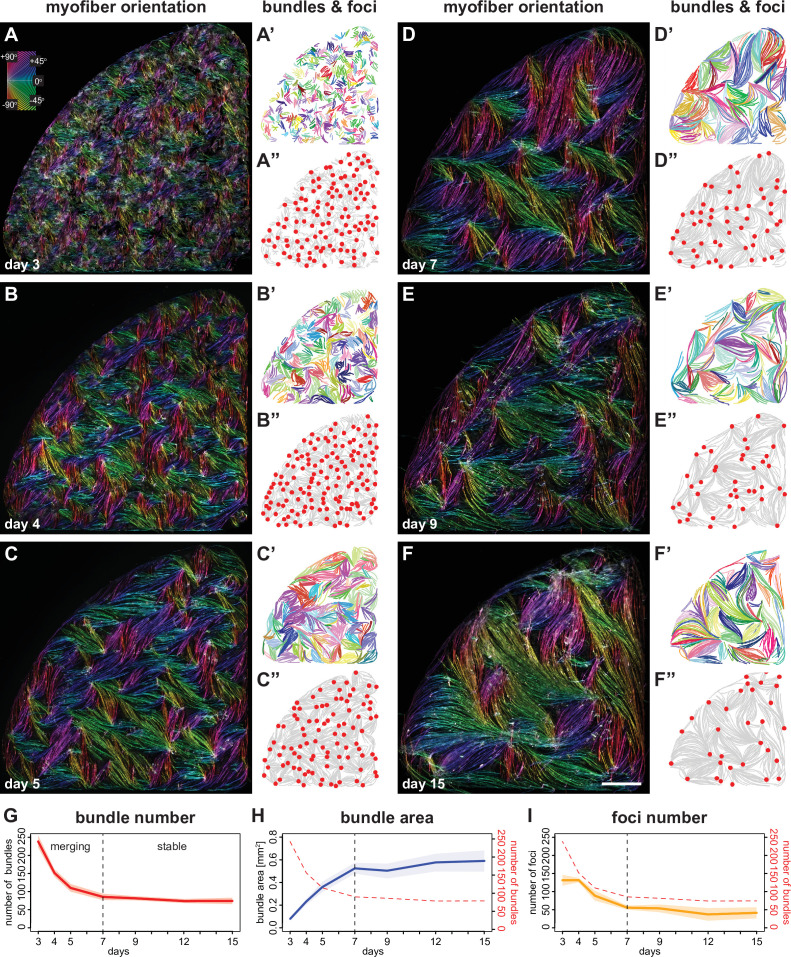
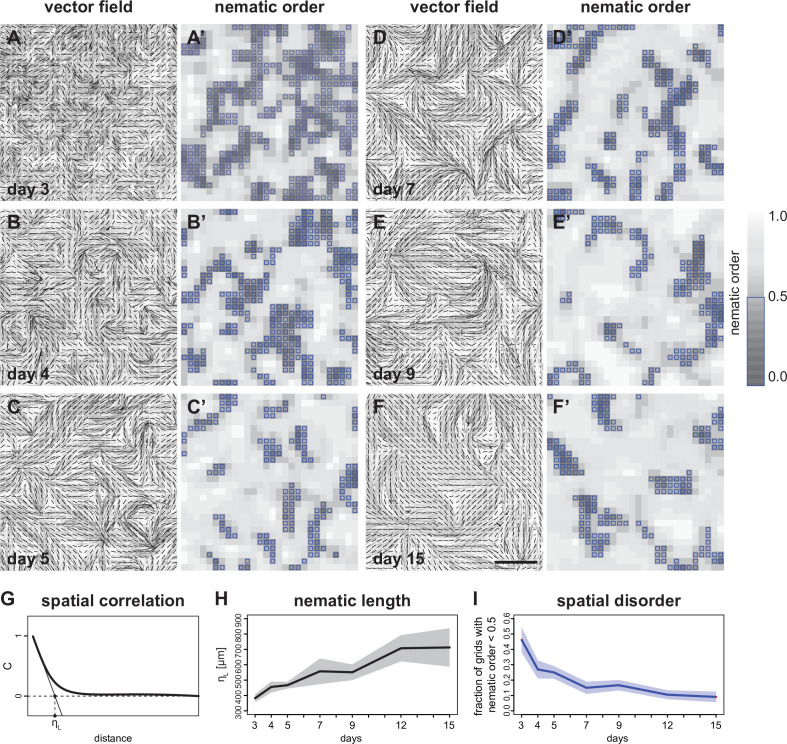
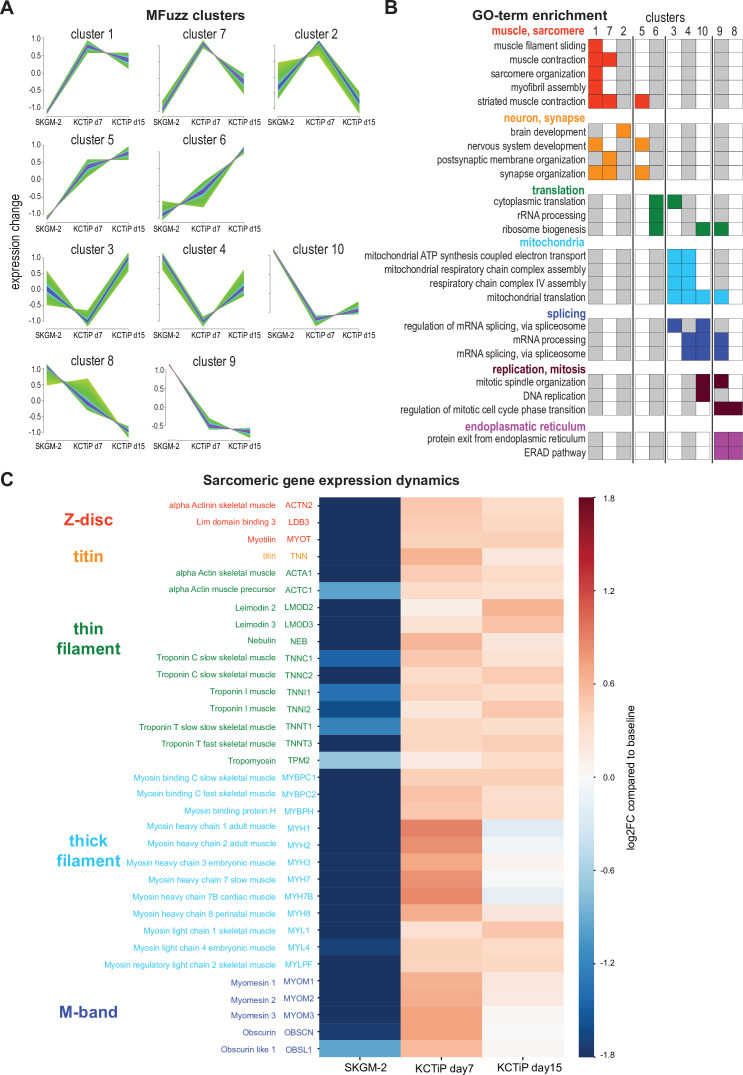
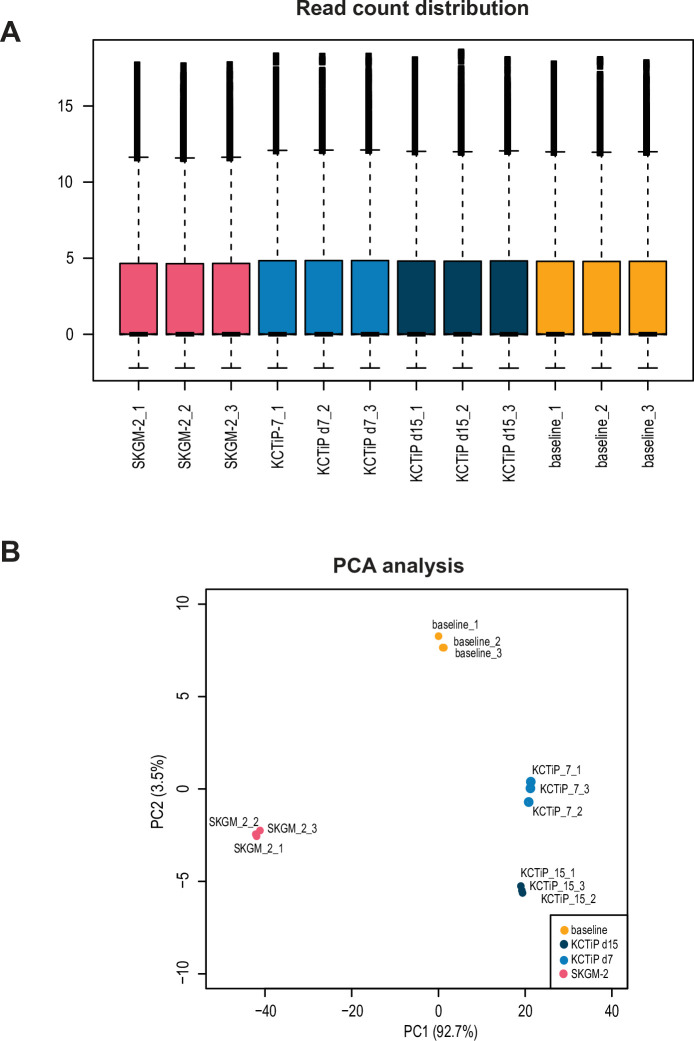
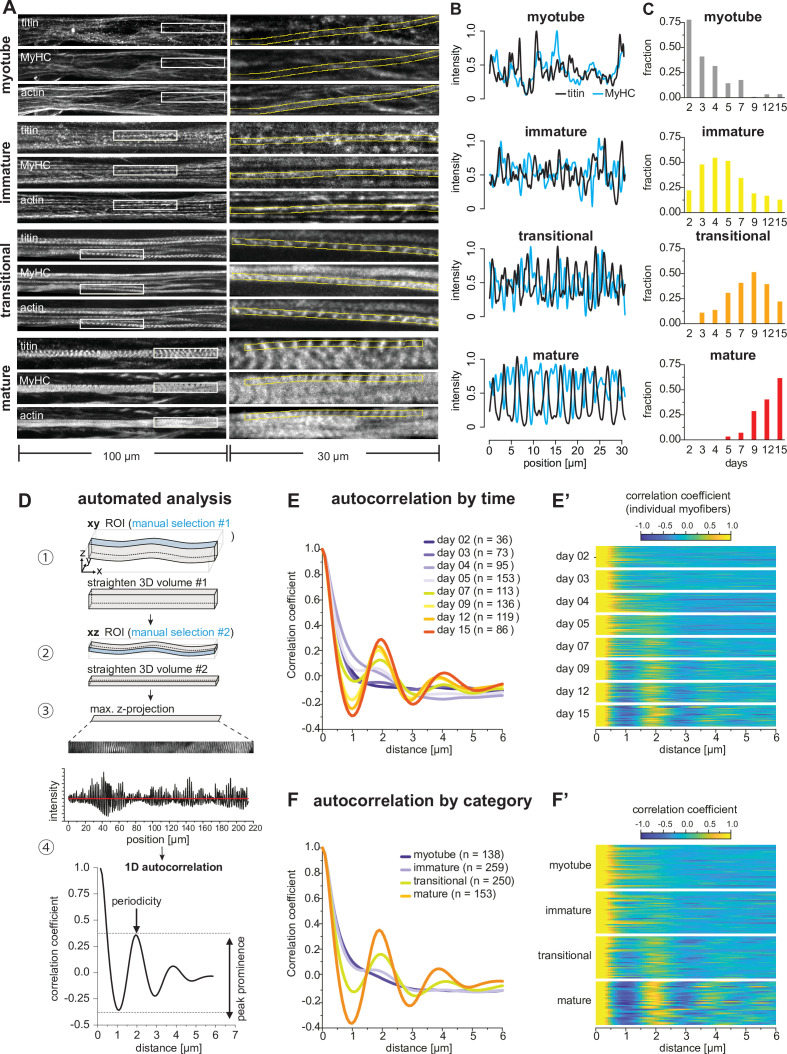
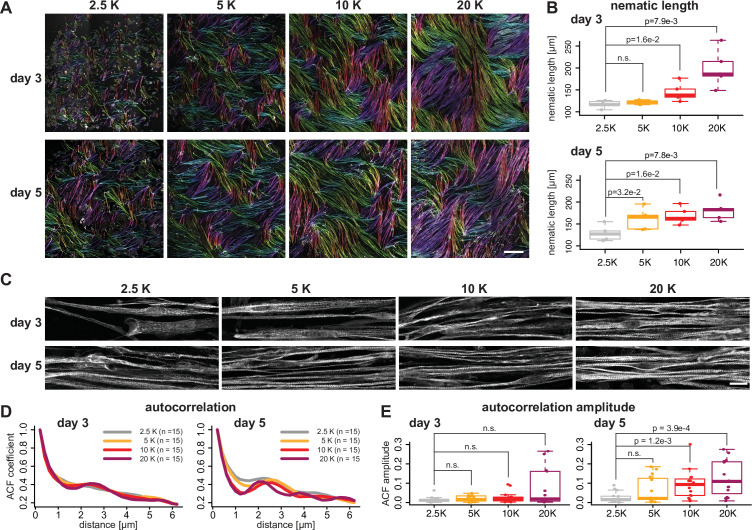
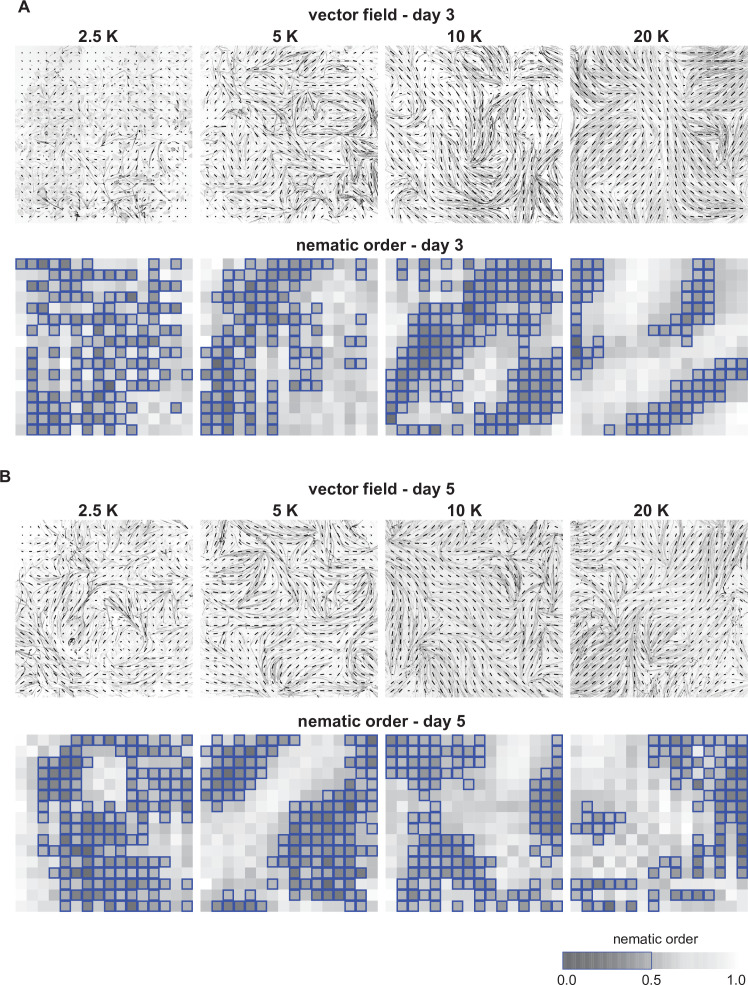
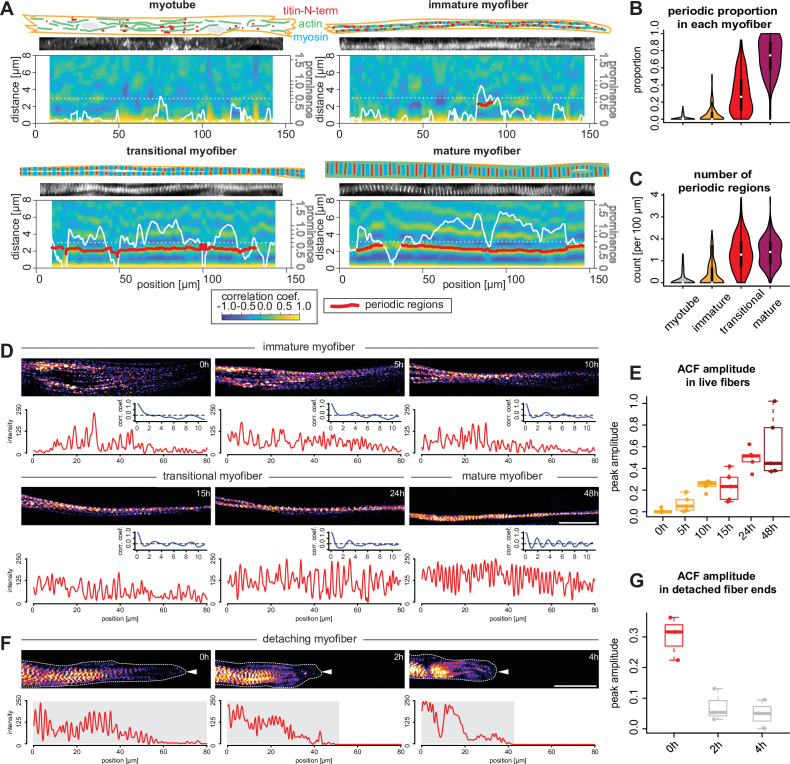
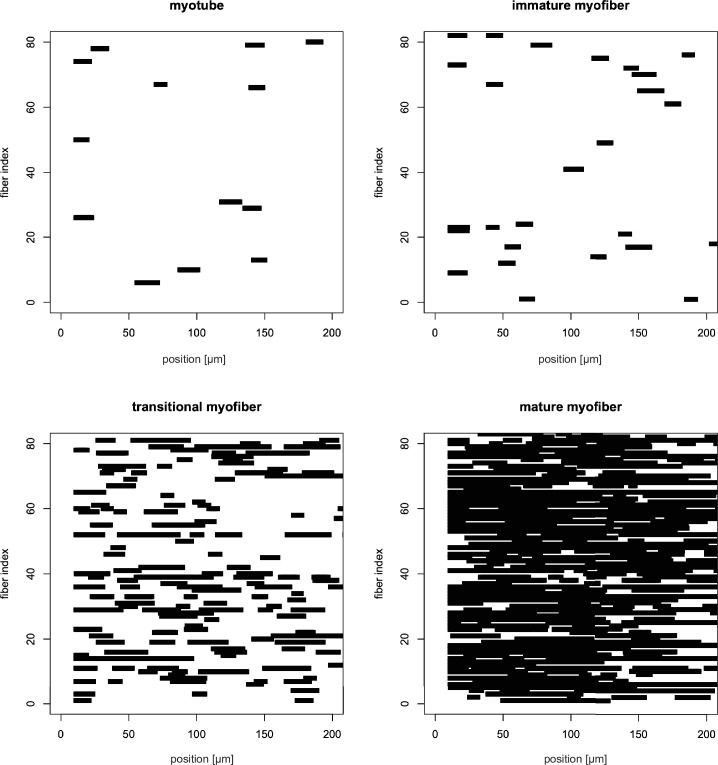
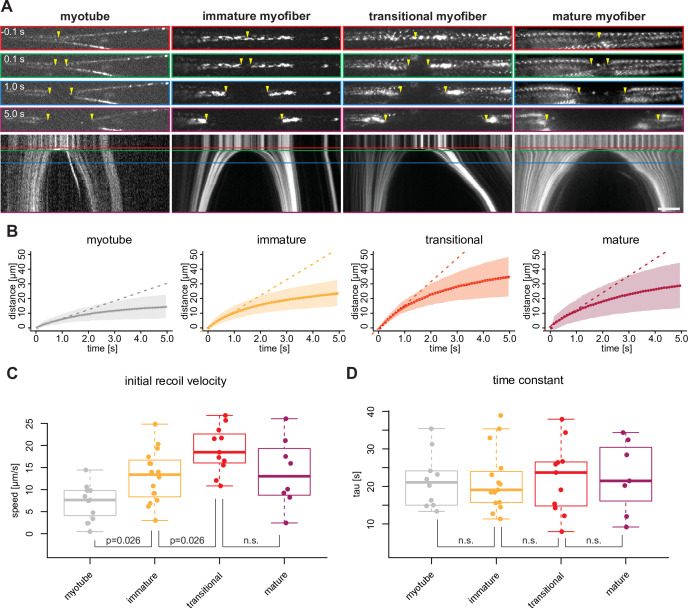
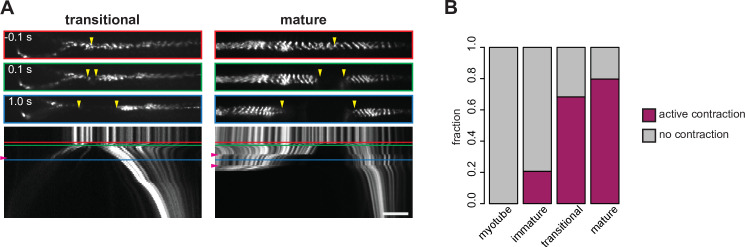
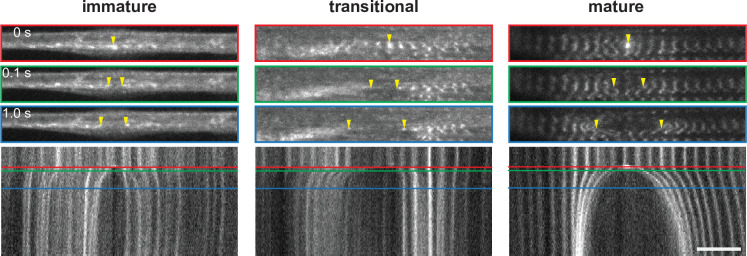
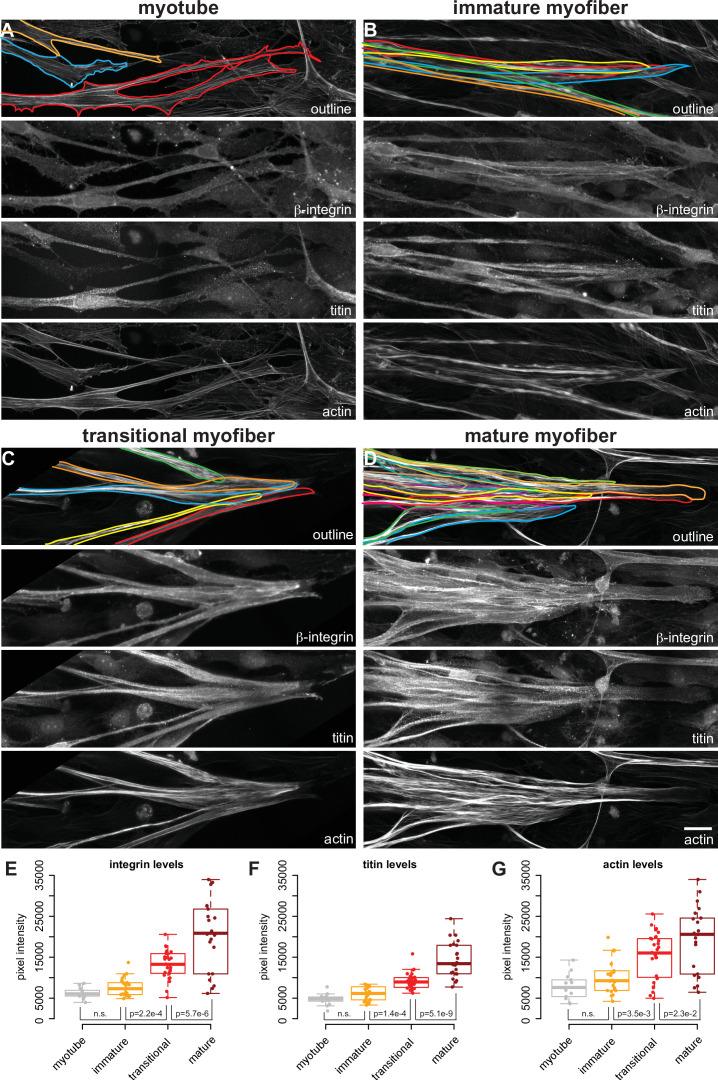
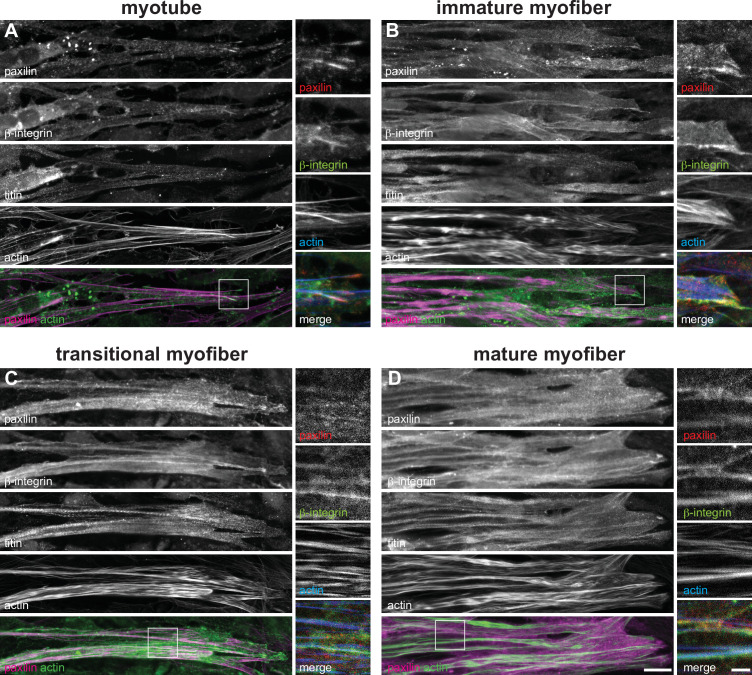
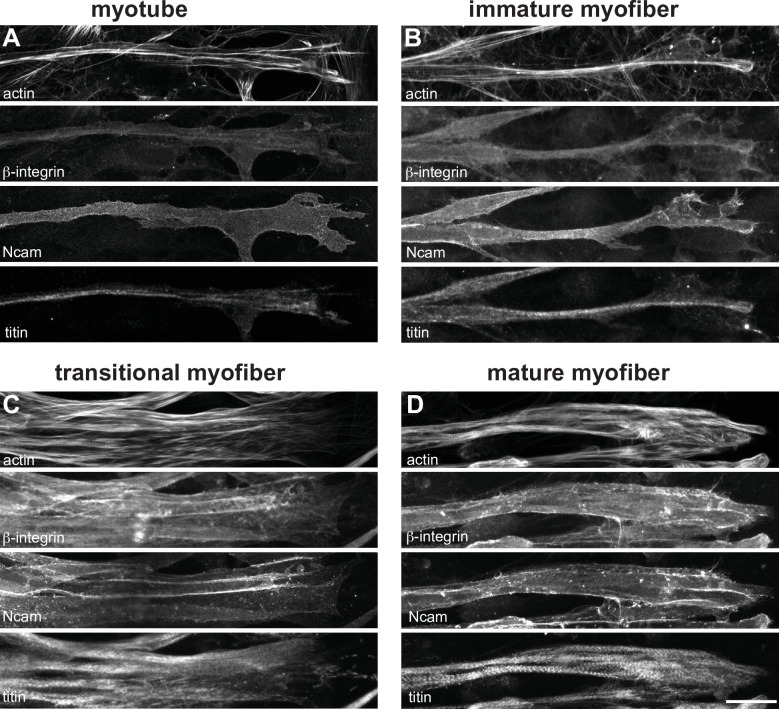
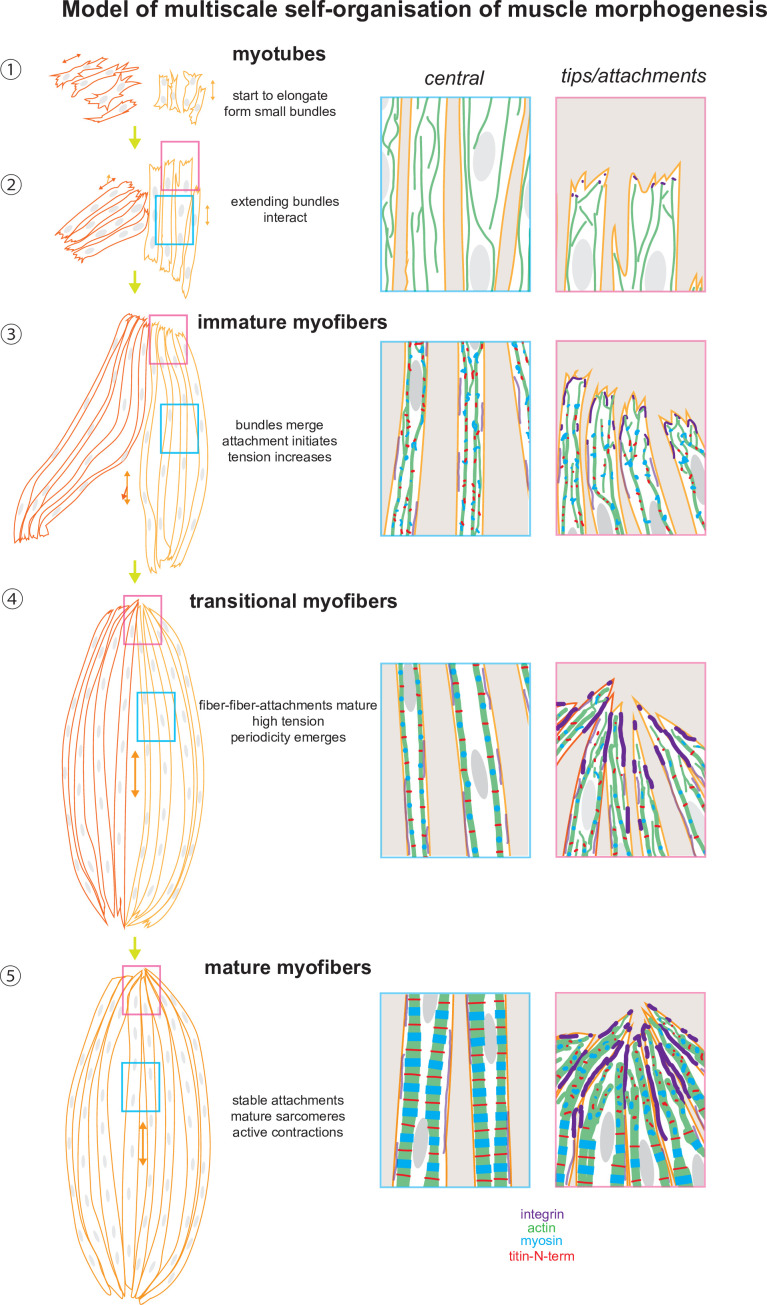
Human muscle is a hierarchically organised tissue with its contractile cells called myofibers packed into large myofiber bundles. Each myofiber contains periodic myofibrils built by hundreds of contractile sarcomeres that generate large mechanical forces. To better understand the mechanisms that coordinate human muscle morphogenesis from tissue to molecular scales, we adopted a simple in vitro system using induced pluripotent stem cell-derived human myogenic precursors. When grown on an unrestricted two-dimensional substrate, developing myofibers spontaneously align and self-organise into higher-order myofiber bundles, which grow and consolidate to stable sizes. Following a transcriptional boost of sarcomeric components, myofibrils assemble into chains of periodic sarcomeres that emerge across the entire myofiber. More efficient myofiber bundling accelerates the speed of sarcomerogenesis suggesting that tension generated by bundling promotes sarcomerogenesis. We tested this hypothesis by directly probing tension and found that tension build-up precedes sarcomere assembly and increases within each assembling myofibril. Furthermore, we found that myofiber ends stably attach to other myofibers using integrin-based attachments and thus myofiber bundling coincides with stable myofiber bundle attachment in vitro. A failure in stable myofiber attachment results in a collapse of the myofibrils. Overall, our results strongly suggest that mechanical tension across sarcomeric components as well as between differentiating myofibers is key to coordinate the multi-scale self-organisation of muscle morphogenesis.

Keywords: developmental biology; human; human induced pluripotent stem cells; mechanical tension; muscle; myofibril; sarcomere; self-organisation.


Conflict of interest statement

QM, AA, AR, FM, BD, ZA, JR, MD, AM, EW, CC, VG, PL, BH, OT, OP, FS No competing interests declared

Figures

Figure 1.
Figure 1.. A time course of human induced pluripotent stem cell (iPSC)-derived myofiber differentiation in a minimalist two-dimensional (2D) culture.
(A–I) ×10 views of phalloidin staining of human iPSC-derived myofibers. Yellow shades highlight two randomly selected myocytes, myotubes, or myofibers. (A’-I’) ×100 views of individual myocytes, myotubes, or myofibers. Rhodamine-phalloidin in grey, DAPI in magenta. Yellow dashed lines highlight individual myocytes/myotubes/myofibers. (J) Length of myocytes/myotubes/myofibers over time (n=35, 42, 4695, 3765, 4191, 2439, 2061, 1880, 1883 myofibers per reported day, respectively). Dots and solid line show the mean of each day, while shaded area shows the standard deviation. Vertical dashed line shows the transition point at day 7 from the elongation phase to the stable phase. (K) Width of myocytes/myotubes/myofibers over time (n=45, 50, 111, 191, 175, 297, 340, 315, 201 myofibers per reported day, respectively). (L) Number of nuclei per myofiber over time (n=35, 42, 76, 81, 85, 77, 62, 74, 66 myofibers per day). In (K and L), dots, shaded area, and solid line follow convention in J, with graph in J is reproduced in red. Scale bars: 250 µm in A-I, 50 µm in A’–I’. Source data available for J–L.
Figure 1—figure supplement 1.
Figure 1—figure supplement 1.. Dynamics of myocyte fusion and myotube elongation.
Stills from phase-contrast time-lapse movies of live myocultures. (A) A myocyte (yellow dot) fusing into an elongated myotube (red dot). Fusion is highlighted by the orange-coloured dot of the newly fused nucleus. (B) A single myotube (red dot) elongating. Yellow solid arrowheads show elongating ends, while yellow empty arrowhead shows a retracting extension. Scale bars: 100 µm. Related to Figure 1 and Figure 1—video 1.
Figure 2.
Figure 2.. Myofibers self-organise into bundles that consolidate to stable sizes.
(A–F) Rhodamine-phalloidin staining pseudo-coloured according to local fiber orientation by OrientationJ. Inset shows a colour wheel used by OrientationJ. (A’–F’) automatically segmented myofiber bundles from manually traced myofibers, colour-coded by bundle identity. (A”–F”) manually traced myofiber bundle end foci (red dots) superimposed on traced myofibers (grey lines reproduced from A’–F’). (G) Number of myofiber bundles over time (n=7 cultures per stage). Solid line shows the mean of each day, while shaded area shows the standard deviation. Vertical dashed line shows the transition point at day 7 from a merging to a stable phase. (H) Area of myofiber bundles over time (n=7 cultures per stage). (I) Number of myofiber bundle end foci over time (n=3 cultures per stage). Myofiber bundle number from G is overlayed in red. Scale bar: 1 mm. Source data available for G–I.
Figure 2—figure supplement 1.
Figure 2—figure supplement 1.. Vector field analysis of myofiber bundle alignment.
(A–F) Inverted grey scale images of phalloidin staining superimposed with grids of vector fields generated from OrientationJ. Vector orientation and coherence are represented by the direction and length of each short line. (A’–F’) Two-dimensional (2D) heatmaps showing local nematic order S for each grid position. Dark regions show misalignment (lower values), while light regions show good alignment (higher values). Blue boxes highlight grids with nematic order <0.5. Colour map shown on the right. (G) A hypothetical spatial autocorrelation function from a vector field. ηL is the nematic correlation length. (H) Time course of the nematic correlation length ηL (n=6 windows per stage). (I) Time course of the fraction of grids with local nematic order S<0.5 (n=6 windows per stage). In H and I, solid lines represent the mean, while shaded areas show standard deviation. Scale bar: 1 mm. Source data available for panels H and I.
Figure 2—figure supplement 2.
Figure 2—figure supplement 2.. Dynamics of myofiber bundles.
Phase-contrast imaging of myocultures showing myofiber bundles merging during the first 6 days of differentiation. Colour-shaded areas highlight individual myofiber bundles. In each of the three events highlighted, two or three myofiber bundles merge into one. Scale bar: 200 µm. Related to Figure 2 and Figure 2—video 1.
Figure 3.
Figure 3.. A transcriptional switch boosts sarcomeric gene expression.
(A) Mfuzz clustering defined 10 distinct gene clusters with shared expression dynamics over the time course. (B) Selected enriched GO-terms for the respective clusters are displayed, a full list of GO-term enrichments is presented in Supplementary file 1. Note the two muscle-enriched Mfuzz clusters displaying a stark expression increase from undifferentiated to day 7. (C) Heatmap showing expression dynamics of various key sarcomeric genes comparing undifferentiated, day 7 and day 15 myogenic cultures to baseline. Note the stark expression increase of all components until day 7.
Figure 3—figure supplement 1.
Figure 3—figure supplement 1.. Quality control of the transcriptomics dataset.
(A) Read count distribution for all biological replicated analysed. (B) Principal components analysis shows the strong similarity of the replicates.
Figure 4.
Figure 4.. Sarcomeres emerge as myofibers approach stable lengths.
(A) Multi-channel fluorescent images of four morphological categories (myotubes, immature, transitional, and mature myofibers). Left column shows a view of 100 µm wide, right column a zoomed view of 30 µm boxed area. Immunofluorescence against titin N-terminus, muscle myosin heavy chain (MyHC), and phalloidin staining of actin are shown. (B) Normalised one-dimensional (1D) fluorescent intensities for titin (black) and myosin (blue) from ROIs in right column in A. Note the emerging periodicity in transitional fibers. (C) Distribution of each morphological category during the time course. (D) Semi-automatic 1D autocorrelation analysis pipeline. Step ①: Straightening manual ROI in xy dimension. Step ②: Straightening ROI from Step ① in xz dimension. Step ③: Generating 1D intensity profile along myofiber. Step ④: Autocorrelation function (ACF) analysis with 1D intensity profile from Step ③. Presence of a secondary peak indicates the existence of periodic signal, with peak position indicating period length and peak prominence reflecting period regularity. (E) Average ACF for each time point. (E’) Randomly selected ACFs for each time point (n=36 each). (F) Average ACF for each morphological category. (F’) Randomly selected ACFs for each category (n=36 each). Source data available for C.
Figure 5.
Figure 5.. Myofiber bundling promotes sarcomerogenesis.
(A) Rhodamine-phalloidin stainings of days 3 and 5 myofibers seeded at 2.5, 5, 10, and 20 k/cm2, pseudo-coloured according to local fiber orientation by OrientationJ (orientation colour-coding as in Figure 2A–F). (B) Nematic correlation length ηL of conditions shown in A, n=5 each. (C) Immunofluorescence against titin N-terminus for conditions shown in A. (D) Average autocorrelation function (ACF) for conditions shown in C, n=15 each. (E) Amplitude of secondary ACF peaks for conditions shown in D, n=15 each. Scale bars: 500 µm in A, 20 µm in C. Multiple pair-wise t-test. Source data available for B, E.
Figure 5—figure supplement 1.
Figure 5—figure supplement 1.. Vector field analysis of myofiber bundle alignment at different seeding densities.
(A) Vector field analysis of myofiber bundle alignment at day 3. Upper row: inverted grey scale images of phalloidin staining superimposed with grids of vector fields generated from OrientationJ. Vector orientation and coherence are represented by the direction and length of each short line. Lower row: two-dimensional (2D) heatmaps showing local nematic order S for each grid position. Dark regions show misalignment (lower values), while light regions show good alignment (higher values). Blue boxes highlight grids with nematic order <0.5. Colour map shown on the bottom. (B) Vector field analysis of myofiber bundle alignment at day 5.
Figure 6.
Figure 6.. Sarcomeres emerge simultaneously over broad regions within myofibers.
(A) Local autocorrelation function (ACF) analysis for each morphological category (myotubes, immature, transitional and mature myofibers). For each panel, top: schematic model of the myotube and myofiber stage with actin, myosin, and titin as indicated; middle: a straightened image of titin immunofluorescence; bottom: a two-dimensional (2D) colourmap of local ACF. x-Axis shows the position along the myofiber, y-axis shows the ACF distance. Superimposed white line shows prominence of the secondary peak along the myofiber. Superimposed red segments highlight secondary peak positions classified as periodic (see Materials and methods). (B–C) Violin plots of proportion of total length of detected periodic regions over whole lengths of myofiber (B) and number of detected periodic regions (C) for each myofiber from each category. Black bars mark the distance between first and third quadrant. White dots mark the median values. (D) Stills from a time-lapse movie showing a myofiber during myofibrillogenesis (labelled with mKate2-α-actinin2, Figure 6—video 1). Note that the end of the movie the myofibrils display a periodic pattern over the entire traced length, corresponding to the morphology of a mature myofiber. In each panel, the myofiber is traced to produce the intensity profile (red) and an ACF (blue) below that panel. The amplitude of the blue curve is then used to calculate values in E. (E) Amplitudes of ACFs at different time points in myofibers undergoing myofibrillogenesis (n=5). (F) Stills from a time-lapse movie showing one myofiber end retracting (labelled with mKate2-α-actinin2 and outlined with white dashed line and a white arrowhead, Figure 6—video 2). Note that the periodicity of the initially periodic myofiber collapses. In each panel, the myofiber is traced to produce the intensity profile (red) below that panel. The amplitude of the autocorrelation from the shaded region is then used to calculate values in G. (G) Amplitudes of ACFs at different time points in collapsing myofibers (n=3). Scale bars: 20 µm. . Source data available for B, C, E, and G.
Figure 6—figure supplement 1.
Figure 6—figure supplement 1.. Distribution of patterned regions in randomly selected myotubes, immature, transitional and mature myofibers.
Distribution of patterned regions (autocorrelation function [ACF] peak prominence >0.6, see Materials and methods) in randomly selected myotubes, immature, transitional and mature myofibers. In each plot, the x-axis displays positions along the myofiber in µm, while each myofiber occupies a row along the y-axis. Note the homogenous distribution of the pattern regions.
Figure 7.
Figure 7.. Mechanical tension precedes and persists during sarcomere formation.
(A) Line laser ablation experiments for each morphological category (myotubes, immature, transitional and mature myofibers). Myotube and immature myofibers were labelled with mKate2-α-actinin2, while transitional and mature myofibers were labelled with GFP-titin. Top, upper middle, middle, and lower middle panels show 0.1 s prior to 0.1, 1.0, and 5 s post ablation, respectively. Bottom panel shows a kymograph of ablated myofibers. Coloured boxes correspond to coloured lines in the kymograph. Yellow arrowheads show sites of ablation and severed ends. (B) Quantification and mathematical modelling of recoil distances. Dots and shaded area show average and standard deviation of recoil distance, respectively. Dashed straight lines show a linear model fitted to estimate the initial recoil velocity. Solid curve shows viscoelastic model fitted to estimate the relaxation time τ. (C–D) Box plot of initial recoil velocity (C) and relaxation time (D) from ablation experiments in each morphological category: n=11 (myotube), 16 (immature), 11 (transitional), and 8 (mature). Black bars mark the distance between first and third quadrant. White dots mark the median values. Multiple pair-wise t-test: n.s.: p>0.05. Scale bar: 10 µm. Source data available for C and D.
Figure 7—figure supplement 1.
Figure 7—figure supplement 1.. Contraction of myofibers revealed by point laser ablation.
(A) Examples of contracting transitional (left) and mature myofibers (right) post laser ablation. Top, upper middle and lower middle panels show 0.1 s prior to, 0.1 s after, and 1.0 after ablation, respectively. Bottom panels show the kymographs. Coloured boxes correspond to coloured lines in the kymograph. Yellow vertical arrowheads show sites of ablation and severed ends. Purple horizontal arrowheads on kymographs highlight jerky motions caused by contraction events. (B) Frequency of contraction events in myotubes, immature, transitional and mature myofibers. Scale bar: 100 µm. Related to Figure 7 and Figure 7—video 2. Source data available for panel B.
Figure 7—figure supplement 2.
Figure 7—figure supplement 2.. Tension on myofibrils revealed by point laser ablation.
Recoil of myofibrils in an immature (left), a transitional (middle), and a mature myofiber (right) post point laser ablation. Top, upper middle and lower middle panels show the ablation events, 0.1 s after and 1.0 after ablation, respectively. Bottom panels show the kymographs. Coloured boxes correspond to coloured lines in the kymograph. Yellow vertical arrowheads show sites of ablation and severed ends. Note that the mature sarcomeres collapse after the cut. Scale bar: 100 µm. Related to Figure 7 and Figure 7—video 3.
Figure 8.
Figure 8.. Attachment morphology during myofiber bundle maturation.
(A–D) Immunostainings of myofibers with β1-integrin (upper middle), titin (lower middle) and actin (stained with phalloidin, bottom) in myotubes (A), immature (B), transitional (C), and mature myofibers (D). The top panel shows the outline of the myofibers superimposed on the actin channel. (E–G) Intensity of β1-integrin (E), titin (F), and actin (G) signals measured with a 50-pixel-wide line-ROI from myotubes (n=13), immature (n=22), transitional (n=28), and mature myofibers (n=22). Scale bars: 20 µm. Source data available.
Figure 8—figure supplement 1.
Figure 8—figure supplement 1.. Maturation of myofiber attachments revealed by additional attachment markers.
(A–D) Immunostainings of paxillin (top), β1-integrin (upper middle), titin (middle), actin (lower middle), and a merge of paxillin and actin signals (bottom) in myotubes (A), immature (B), transitional (C), and mature myofibers (D). Insets shows a larger zoom on the right, with paxillin (top), β1-integrin (upper middle), actin (lower middle), and a merge of paxillin, β1-integrin, and actin signals (bottom). Scale bars: 20 µm in smaller zoom and 5 µm in larger zoom.
Figure 8—figure supplement 2.
Figure 8—figure supplement 2.. Maturation of myofiber attachments revealed by additional attachment markers.
(A–D) Immunostainings of actin (top), β1-integrin (upper middle), NCAM1 (lower middle), and titin (bottom) in myotubes (A), immature (B), transitional (C), and mature myofibers (D). Scale bars: 20 µm.
Figure 9.
Figure 9.. A tension-driven self-organisation model of human skeletal muscle morphogenesis across tissue, cellular, and molecular scales.
See text for description.

Similar articles

Cited by

References

    1. Adler D, Kelly TS. Vioplot: Violin Plot. Version 0.3.6 2021
    1. Al Tanoury Z, Zimmerman JF, Rao J, Sieiro D, McNamara HM, Cherrier T, Rodríguez-delaRosa A, Hick-Colin A, Bousson F, Fugier-Schmucker C, Marchiano F, Habermann B, Chal J, Nesmith AP, Gapon S, Wagner E, Gupta VA, Bassel-Duby R, Olson EN, Cohen AE, Parker KK, Pourquié O. Prednisolone rescues Duchenne muscular dystrophy phenotypes in human pluripotent stem cell-derived skeletal muscle in vitro. PNAS. 2021;118:e2022960118. doi: 10.1073/pnas.2022960118. - DOI - PMC - PubMed
    1. Austen K, Ringer P, Mehlich A, Chrostek-Grashoff A, Kluger C, Klingner C, Sabass B, Zent R, Rief M. Extracellular rigidity sensing by talin isoform-specific mechanical linkages. Nature Cell Biology. 2015;17:1597–1606. doi: 10.1038/ncb3268. - DOI - PMC - PubMed
    1. Behrndt M, Salbreux G, Campinho P, Hauschild R, Oswald F, Roensch J, Grill SW, Heisenberg CP. Forces driving epithelial spreading in zebrafish gastrulation. Science. 2012;338:257–260. doi: 10.1126/science.1224143. - DOI - PubMed
    1. Borchers HW. R package pracma. Version 2.3.3R-Project. 2021 https://cran.r-project.org/web/packages/pracma/pracma.pdf

Publication types

Associated data