. 2022 Oct 14;28(20):4551-4564.
doi: 10.1158/1078-0432.CCR-22-1128.

Inhibition of LSD1 with Bomedemstat Sensitizes Small Cell Lung Cancer to Immune Checkpoint Blockade and T-Cell Killing

Affiliations

Inhibition of LSD1 with Bomedemstat Sensitizes Small Cell Lung Cancer to Immune Checkpoint Blockade and T-Cell Killing

Joseph B Hiatt et al. Clin Cancer Res. .

Abstract

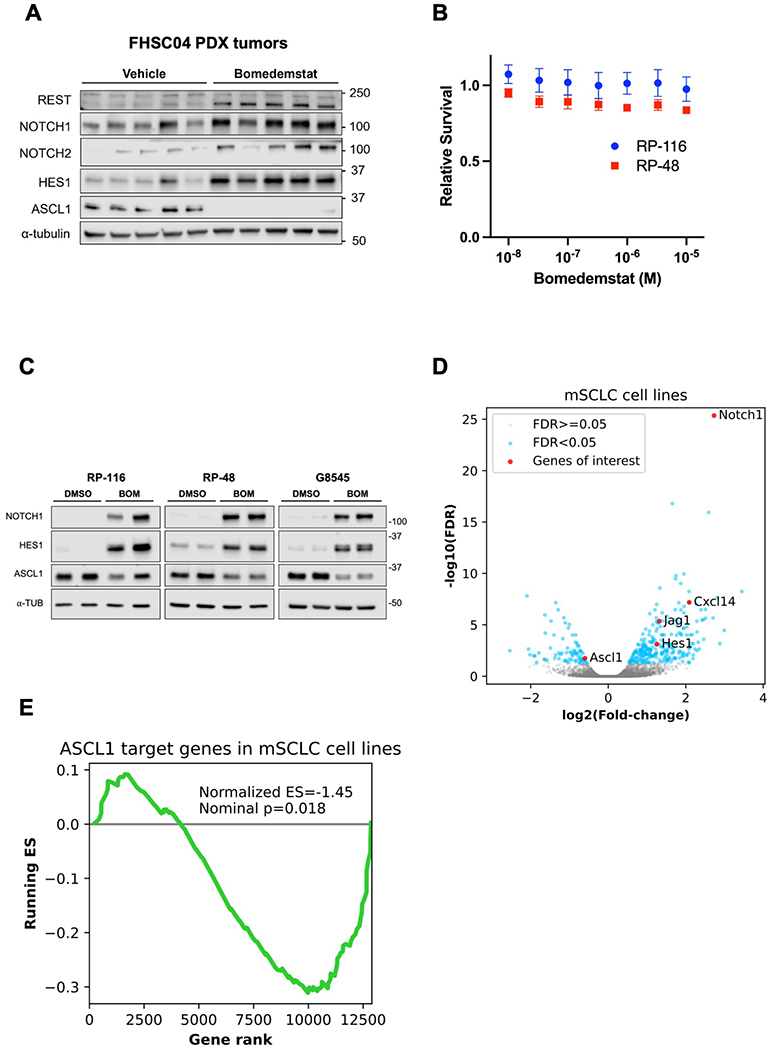
Purpose: The addition of immune checkpoint blockade (ICB) to platinum/etoposide chemotherapy changed the standard of care for small cell lung cancer (SCLC) treatment. However, ICB addition only modestly improved clinical outcomes, likely reflecting the high prevalence of an immunologically "cold" tumor microenvironment in SCLC, despite high mutational burden. Nevertheless, some patients clearly benefit from ICB and recent reports have associated clinical responses to ICB in SCLC with (i) decreased neuroendocrine characteristics and (ii) activation of NOTCH signaling. We previously showed that inhibition of the lysine-specific demethylase 1a (LSD1) demethylase activates NOTCH and suppresses neuroendocrine features of SCLC, leading us to investigate whether LSD1 inhibition would enhance the response to PD-1 inhibition in SCLC.

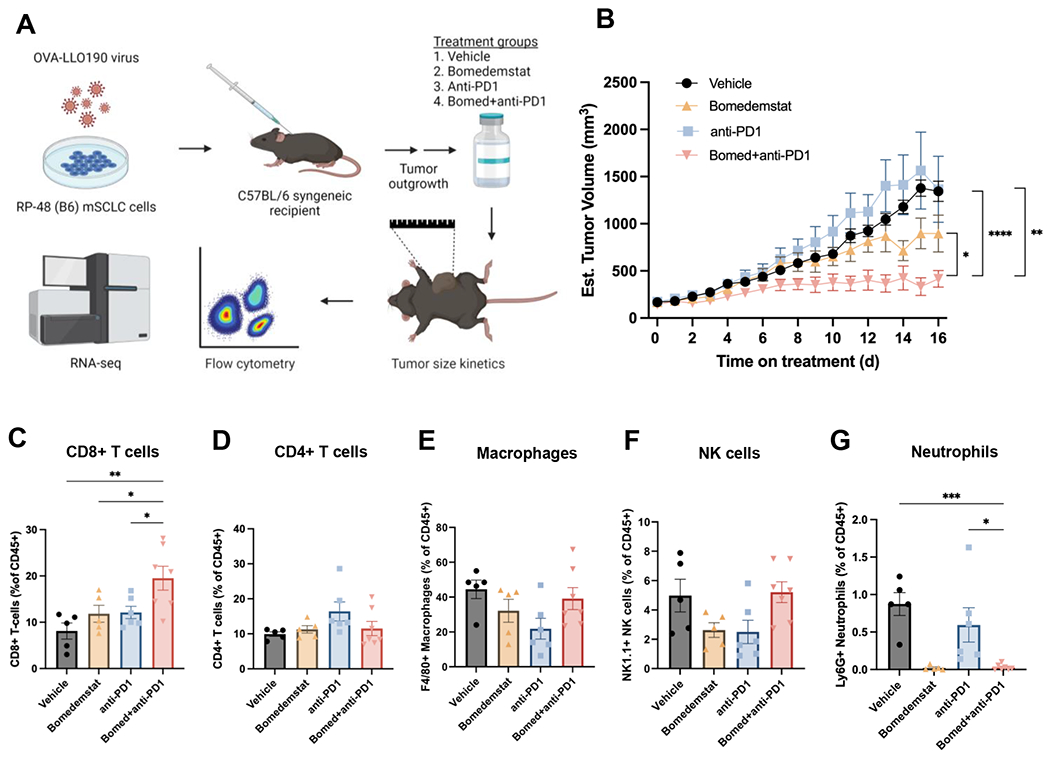
Experimental design: We employed a syngeneic immunocompetent model of SCLC, derived from a genetically engineered mouse model harboring Rb1/Trp53 inactivation, to investigate combining the LSD1 inhibitor bomedemstat with anti-PD-1 therapy. In vivo experiments were complemented by cell-based studies in murine and human models.

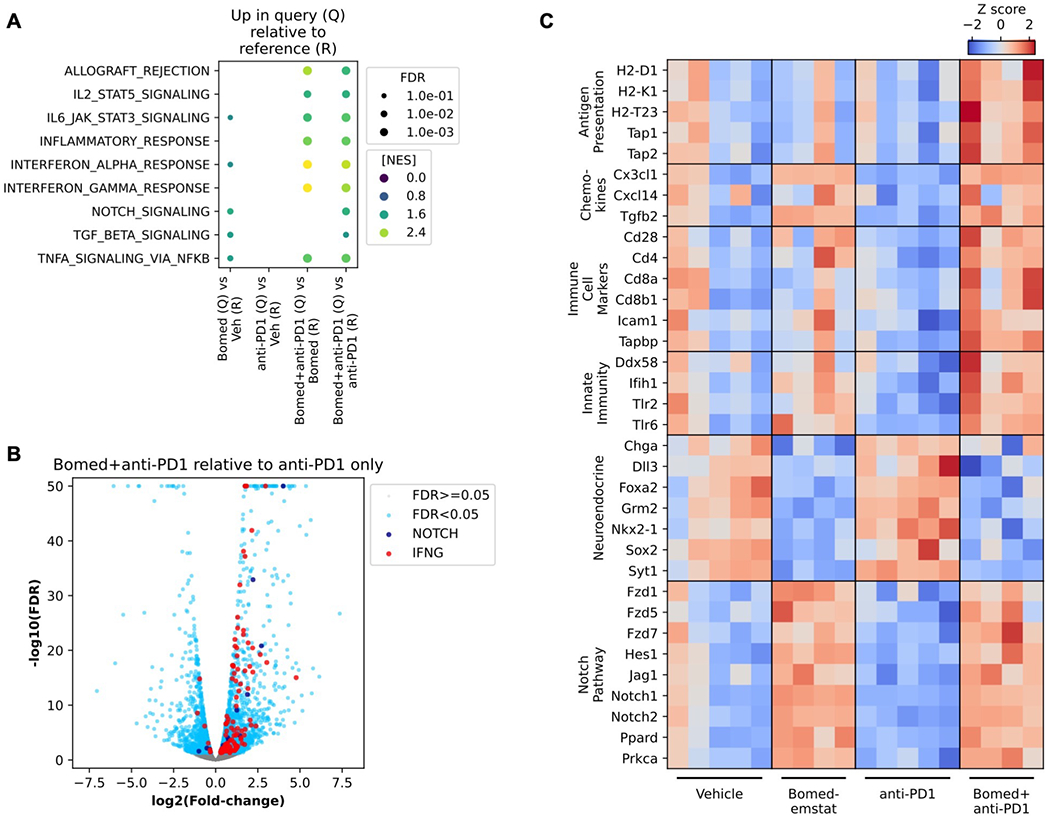
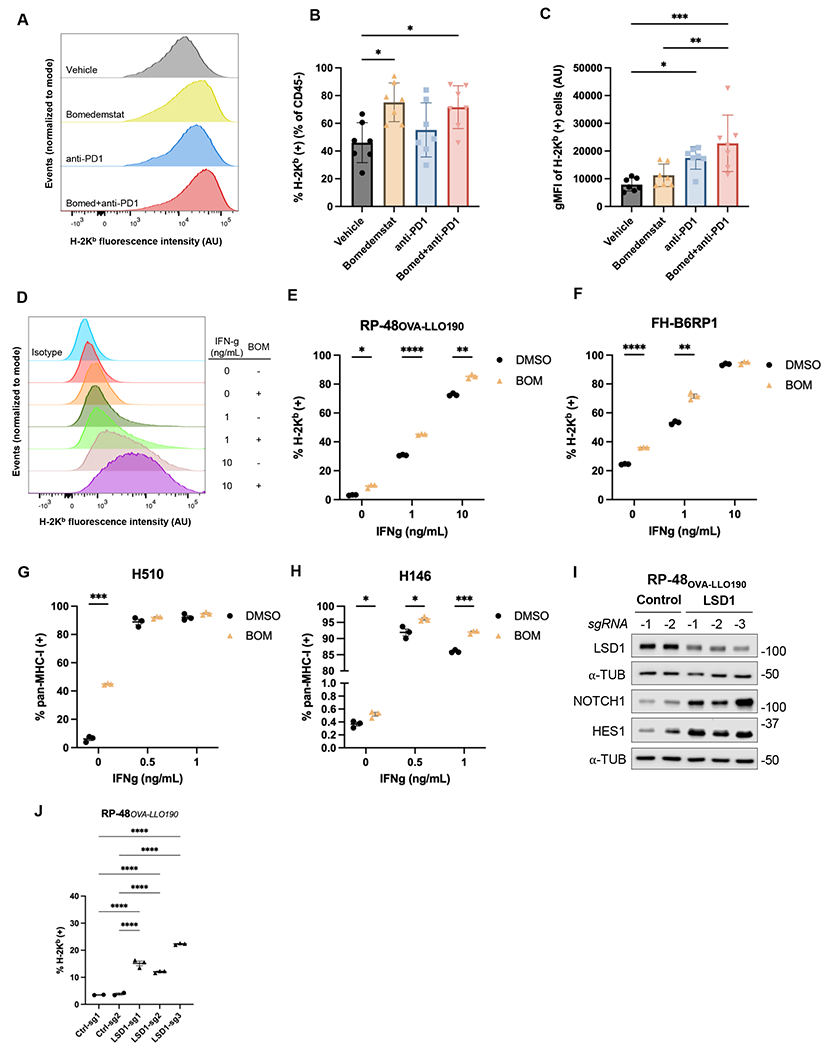
Results: Bomedemstat potentiated responses to PD-1 inhibition in a syngeneic model of SCLC, resulting in increased CD8+ T-cell infiltration and strong tumor growth inhibition. Bomedemstat increased MHC class I expression in mouse SCLC tumor cells in vivo and augmented MHC-I induction by IFNγ and increased killing by tumor-specific T cells in cell culture.

Conclusions: LSD1 inhibition increased MHC-I expression and enhanced responses to PD-1 inhibition in vivo, supporting a new clinical trial to combine bomedemstat with standard-of-care PD-1 axis inhibition in SCLC.


Figures

Figure 1.
Figure 1.
Bomedemstat treatment upregulates NOTCH and suppresses ASCL1 targets in human and murine SCLC models. A, Immunoblot analysis of FHSC04 PDX model tumors after treatment with vehicle or bomedemstat (25 mg per kg per day). B, Survival of murine SCLC (mSCLC) cell lines RP-116 and RP-48 treated with bomedemstat for 96 hours, relative to cells treated with DMSO (mean±SEM of three independent replicates), as determined by CellTiterGlo reagent. C, Immunoblot analysis of mSCLC cell lines after exposure to bomedemstat (1 μM) or DMSO for 96 hours. D, Differential gene expression analysis of RP-116, RP-48, and G8545 mSCLC cell lines after exposure to bomedemstat (1 μM) or DMSO for 96 hours, showing fold-change in bomedemstat-treated cells relative to DMSO. Selected genes of interest with respect to neuroendocrine differentiation and immune cell recruitment are highlighted. The −log10(FDR) is artificially capped at 25 for display purposes. E, Gene set enrichment analysis-derived running Enrichment Score (ES) of a custom gene set comprising 141 ASCL1 target genes in RP-116, RP-48, and G8545 mSCLC cell lines.
Figure 2.
Figure 2.
Bomedemstat and PD1 inhibition reduces tumor growth and increases cytotoxic T cell infiltration in an immunocompetent syngeneic murine model of SCLC. A, Schematic illustrating workflow of immunocompetent flank tumor experiments, including modification of mSCLC cells to express immunogenic model antigens, flank tumor engraftment, treatment with one of four listed regimens, and assessment of tumor growth kinetics, immune cell infiltration, and transcriptome. B, Growth kinetics of RP-48OVA-LLO190 flank tumors in C57BL/6 recipient mice treated with vehicle, bomedemstat (45 mg/kg daily), anti-PD1 (250 μg twice weekly), or bomedemstat and anti-PD1 (n=10 each, mean±SEM). Treatment was initiated once tumors reached ~150mm3. Mixed effects models comparing bomedemstat+PD1 to each other group, *P<0.05, **P<0.01, ***P<0.001. C, Flow cytometric quantification of CD8+ T cells, D, CD4+ T cells, E, F4/80+ macrophages, F, NK1.1+ Natural Killer (NK) cells, and, G, Ly6G+ neutrophils as a fraction of CD45+ cells in RP-48OVA-LLO190 flank tumors collected after 16 days of treatment (n=5-7 per group, mean±SEM). One-way ANOVA with Dunnett’s test comparing bomedemstat+anti-PD1 group to the other three groups, *P<0.05, **P<0.01, ***P<0.001. OVA-LLO190, Ovalbumin-Listeriolysin O 190-201 peptide; B6, C57BL/6 genetic background; bomed, bomedemstat; NK, natural killer.
Figure 3.
Figure 3.
Increased NOTCH pathway and inflammatory gene expression signatures in murine SCLC flank tumors treated with bomedemstat and PD1 inhibition. A, Selected Molecular Signatures Database (MSigDB) Hallmark pathways that are upregulated in Query group relative to Reference group tumor transcriptomes, based on Gene Set Enrichment Analysis of RNA-seq data from RP-48OVA-LLO190 flank tumors in C57BL/6 recipient mice treated with vehicle, bomedemstat (45 mg/kg daily), anti-PD1 (250 μg twice weekly), or bomedemstat and anti-PD1, collected after 16 days on treatment (n=4-5 in each group). Points are shown if pathway enrichment was detected with false discovery rate (FDR) <0.1, point size is scaled to FDR, and point color is scaled to Normalized Enrichment Score (NES). B, Differential gene expression analysis comparing RP-48OVA-LLO190 flank tumors treated with bomedemstat and anti-PD1 vs anti-PD1 alone. Genes in MSigDB Hallmark NOTCH_SIGNALING (NOTCH) and INTERFERON_GAMMA_RESPONSE (IFNG) and FDR<0.05 are shown. The −log10(FDR) is artificially capped at 50 for display purposes. C, Z scores of log-transformed reads per kilobase per million (RPKM) values of selected genes in categories of interest in individual RP-48OVA-LLO190 flank tumors by treatment group. Bomed, bomedemstat.
Figure 4.
Figure 4.
LSD1 inhibition drives MHC-I upregulation. A, Distributions of H-2Kb surface staining from representative RP-48OVA-LLO190 flank tumors collected after 10 days of treatment with vehicle, bomedemstat (45 mg/kg daily), anti-PD1 (250 μg twice weekly), or bomedemstat and anti-PD1 (normalized to modal value). B, Percent of H-2Kb positive cells and, C, geometric mean fluorescence intensity (gMFI) of cells in the positive gate in CD45- (tumor) cells from RP-48OVA-LLO190 flank tumors (n=7 in each group) (mean±SEM). One-way ANOVA with followup comparison of all groups, with Sidak’s correction for multiple comparisons, *P<0.05, **P<0.01, ***P<0.001. D, Distributions of H-2Kb surface staining from representative replicates and, E, percent of H-2Kb positive RP-48OVA-LLO190 cultured cells treated with bomedemstat (1 μM, BOM) or DMSO for a total of 72h, with addition of varying concentrations of interferon gamma (IFN-g) from 48-72h. Multiple unpaired t tests with unequal variance and Sidak’s correction for multiple testing, *P<0.05, **P<0.01, ***P<0.001, ****P<0.0001. F, Percent of H-2Kb positive FH-B6RP-01 cells, G, pan-MHC-I positive H510 cells and, H, pan-MHC-I positive H146 cells treated with bomedemstat (1 μM) or DMSO for a total of 96h, with addition of varying concentrations of interferon gamma (IFN-g) from 72-96h. Multiple unpaired t tests with unequal variance and Sidak’s correction for multiple testing, *P<0.05, ***P<0.001. I, Immunoblot analysis and, J, percent of H-2Kb positive RP-48OVA-LLO190 cells transduced with a CRISPR knockout vector encoding a non-targeting (control) or LSD1-targeting sgRNA. One-way ANOVA with followup comparison of each control sgRNA with each LSD1 sgRNA, with Sidak’s correction for multiple comparisons, *P<0.05, **P<0.01, ***P<0.001, ***P<0.0001.
Figure 5.
Figure 5.
Molecular and functional immunogenicity induced by LSD1 inhibition. A, Immunoblot analysis of RP-48OVA-LLO190 cells treated with bomedemstat (1 μM, BOM) or DMSO for a total of 10 days, with or without interferon gamma (IFN-g, 10 ng/mL) for the final 48 hours. B, Immunoblot analysis of RP-48OVA-LLO190 cells transduced with a CRISPR knockout vector encoding a non-targeting (control) or LSD1-targeting sgRNA. C, Immunoblot analysis of H510 cells and, D, H146 cells treated with bomedemstat (1 μM) or DMSO for a total of 96 hours. E, Percent of CD8+ T cells positive for CD107a cytotoxic degranulation marker following 24h co-culture with RP-48OVA-LLO190 cells that were pre-treated with bomedemstat (1 μM) or DMSO for a total of 72h with or without IFN-ɣ (10 ng/mL) from 48-72h, shown for nonspecific bulk CD8 T cells (red) or antigen-specific OT-I CD8+ T cells (blue). PI, PMA+ionomycin. One-way ANOVA with Dunnett’s test performed on OT-I populations excluding PI and media, *P<0.05, **P<0.01, ****P<0.0001. F, Relative RP-48OVA-LLO190 cell survival following exposure to bomedemstat, IFN-g, and co-culture with OVA-specific OT-I or non-specific CD8+ T cells. Cells were treated with bomedemstat (1 μM) or DMSO for 72h, IFN-ɣ at 0 or 10 ng/mL for 24h prior to co-culture, and then co-cultured with OT-I or non-specific CD8+ T cells for 24h (2:1 effector:target ratio). Percent of cells surviving was calculated as the number of viable SCLC cells in co-culture with OT-I T cells relative to the number of viable SCLC cells in co-culture with non-specific CD8+ T cells multiplied by 100, as determined by flow cytometric quantification with counting bead spike-in (mean±SEM of 6 technical replicates performed in two groups of three at separate timepoints). Multiple unpaired t-tests with unequal variance and Sidak’s correction for multiple testing *P<0.05, **P<0.01, ***P<0.001, ****P<0.0001. G, Schematic of molecular targets and associated direct mechanisms, subsequent tumor cell-autonomous effects, and eventual multicellular phenotype of LSD1 inhibition in combination with PD1/PDL1 axis blockade. H, Schematic of an upcoming clinical trial of bomedemstat in combination with maintenance atezolizumab for patients with ES-SCLC who do not experience disease progression during four cycles of standard of care (SOC) induction platinum, etoposide, and anti-PDL1 antibody systemic therapy.

Comment in

References

    1. Horn L, Mansfield AS, Szczesna A, Havel L, Krzakowski M, Hochmair MJ, et al. First-Line Atezolizumab plus Chemotherapy in Extensive-Stage Small-Cell Lung Cancer. N Engl J Med 2018;379(23):2220–9 doi 10.1056/NEJMoa1809064. - DOI - PubMed
    1. Paz-Ares L, Dvorkin M, Chen Y, Reinmuth N, Hotta K, Trukhin D, et al. Durvalumab plus platinum-etoposide versus platinum-etoposide in first-line treatment of extensive-stage small-cell lung cancer (CASPIAN): a randomised, controlled, open-label, phase 3 trial. Lancet 2019;394(10212):1929–39 doi 10.1016/S0140-6736(19)32222-6. - DOI - PubMed
    1. Gazdar AF, Bunn PA, Minna JD. Small-cell lung cancer: what we know, what we need to know and the path forward. Nature reviews Cancer 2017;17(12):725–37 doi 10.1038/nrc.2017.87. - DOI - PubMed
    1. Yazawa T, Kamma H, Fujiwara M, Matsui M, Horiguchi H, Satoh H, et al. Lack of class II transactivator causes severe deficiency of HLA-DR expression in small cell lung cancer. J Pathol 1999;187(2):191–9 doi 10.1002/(SICI)1096-9896(199901)187:2<191::AID-PATH206>3.0.CO;2-3. - DOI - PubMed
    1. Funa K, Gazdar AF, Minna JD, Linnoila RI. Paucity of beta 2-microglobulin expression on small cell lung cancer, bronchial carcinoids and certain other neuroendocrine tumors. Lab Invest 1986;55(2):186–93. - PubMed

Publication types