. 2022 Aug 15;61(32):12625-12634.
doi: 10.1021/acs.inorgchem.2c01562. Epub 2022 Aug 3.

Tuning Cobalt(II) Phosphine Complexes to be Axially Ambivalent

Affiliations

Tuning Cobalt(II) Phosphine Complexes to be Axially Ambivalent

Jack Thomas-Colwell et al. Inorg Chem. .

Abstract

We report the isolation and characterization of a series of three cobalt(II) bis(phosphine) complexes with varying numbers of coordinated solvent ligands in the axial position. X-ray quality crystals of [Co(dppv)2][BF4]2 (1), [Co(dppv)2(NCCH3)][BPh4]2 (2), and [Co(dppv)2(NCCH3)2][BF4]2 (3) (dppv = cis-1,2-bis(diphenylphosphino)ethylene) were grown under slightly different conditions, and their structures were compared. This analysis revealed multiple crystallization motifs for divalent cobalt(II) complexes with the same set of phosphine ligands. Notably, the 4-coordinate complex 1 is a rare example of a square-planar cobalt(II) complex, the first crystallographically characterized square-planar Co(II) complex containing only neutral, bidentate ligands. Characterization of the different axial geometries via EPR and UV-visible spectroscopies showed that there is a very shallow energy landscape for axial ligation. Ligand field angular overlap model calculations support this conclusion, and we provide a strategy for tuning other ligands to be axially labile on a phosphine scaffold. This methodology is proposed to be used for designing cobalt phosphine catalysts for a variety of oxidation and reduction reactions.


Conflict of interest statement

The authors declare no competing financial interest.

Figures

Figure 1
Figure 1
Structural representation of 1, 2, and 3 in the solid state with displacement ellipsoids shown at the 50% probability level. Hydrogen atoms and counter anions are omitted for clarity. Dark blue = Co, light blue = N, orange = P, and gray = C.
Figure 2
Figure 2
UV–visible absorbance spectra of the titration of [TBA][BPh4] into a solution of [Co(dppv)2(NCCH3)2][BF4]2 in CH3CN (TBA = tetrabutylammonium; BPh4 = tetraphenylborate).
Scheme 1
Scheme 1. Ligation Chemistry of [Co(dppv)2]2+ under Various Conditions to form 4-, 5-, and 6-Coordinate Complexes
Figure 3
Figure 3
CW EPR spectra (black traces) of Co(II) complexes with various axial ligands. (A) Crushed powder of [Co(dppv)2][BF4]2 (1), temperature = 77 K; (B) [Co(dppv)2][BF4]2 (1) + dppe, temperature = 70 K; (C) frozen solution of [Co(dppv)2][BF4]2 (1) in acetone, temperature = 10 K; (C′) computed numerical derivative showcasing the 31P hyperfine coupling that is evident along g||. Spectrometer settings: (A) microwave frequency = 9.434 GHz, microwave power = 2 mW; (B) microwave frequency = 9.377 GHz, microwave power = 6.4 mW; (C) microwave frequency = 9.377 GHz, microwave power = 2 mW. Simulations (red traces) achieved with magnetic parameters given in Table 2 and these inhomogeneity parameters: (A) linewidth = 2 mT, g-strain = [0.08, 0.05, 0.06]; (B) linewidth = 31.4 mT, g-strain = [0.30, 0.05, 0.11]; (C) linewidth = 2 mT, g-strain = [0.036, 0.011, 0.00].
Figure 4
Figure 4
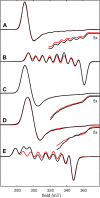
CW EPR spectra (black traces) of Co(II) complexes with various axial ligands. (A) Crushed powder of [Co(dppv)2(NCCH3)][BPh4]2, temperature = 4 K; (B) crushed powder of [Co(dppv)2(NCCH3)2][BPh4]2, temperature = 77 K; (C) crushed powder of [Co(dppv)2(NCCH3)2][BPh4]2 + dppe, temperature = 50 K. (D) Frozen solution of [Co(dppv)2(NCCH3)2][BPh4]2 dissolved in acetone, temperature = 77 K; (E) frozen solution of [Co(dppv)2(NCCH3)2][BPh4]2 dissolved in CH3CN, temperature = 4 K. Spectrometer settings: (A) microwave frequency = 9.377 GHz, microwave power = 0.02 mW; (B) microwave frequency = 9.861 GHz, microwave power = 2 mW; (C) microwave frequency = 9.377 GHz, microwave power = 0.08 mW; (D) microwave frequency = 9.436 GHz, microwave power = 2 mW; (E) microwave frequency = 9.376 GHz, microwave power = 0.004 mW. Simulations (red traces) achieved with magnetic parameters given in Table 1 and these inhomogeneity parameters: (A) linewidth = 6.7 mT, g-strain = [0.026, 0.050, 0.007]; (B) linewidth = 6.4 mT, g-strain = [0.017, 0.023, 0.02]; (C) linewidth = 8.3 mT, g-strain = [0.013, 0.041, 0.027]; (D) linewidth = 8.0 mT, g-strain = [0.024, 0.046, 0.007]; (E) linewidth = 7.4 mT, g-strain = [0.00, 0.011, 0.0003]. Insets show spectra (black) and simulations (red) of g|| region for spectra B, D, and E, multiplied by a factor of 5 to better show the 59Co hyperfine splittings.
Figure 5
Figure 5
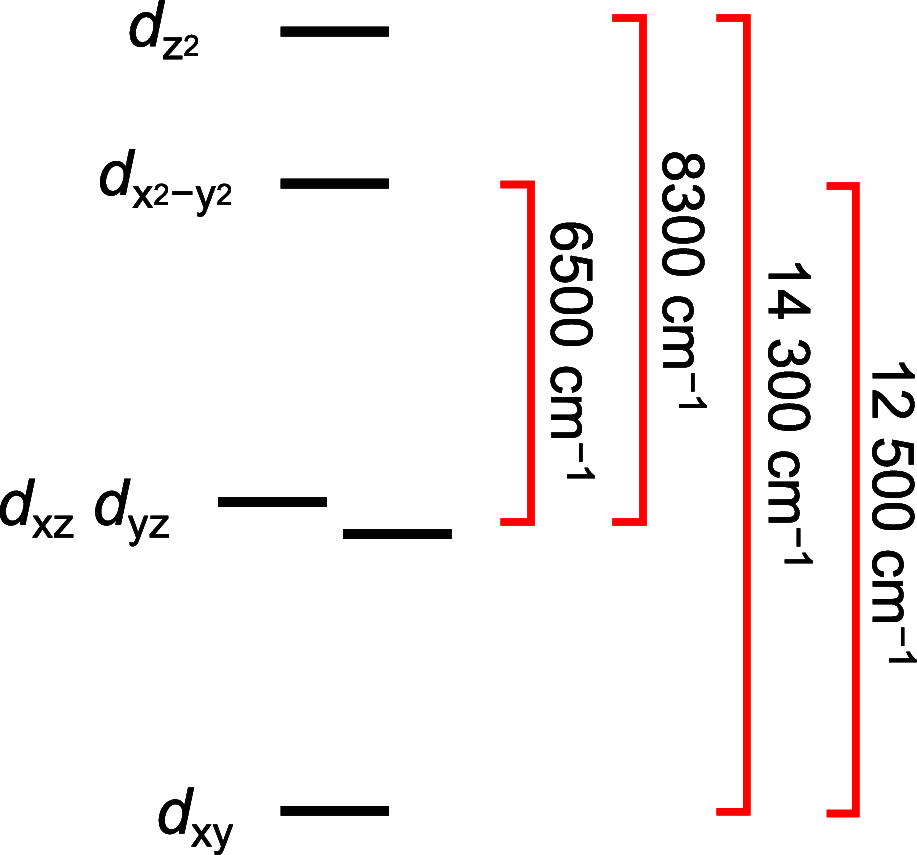
Ligand-field splitting diagram illustrating the electronic structure of the pseudo-octahedral 3 (6-coordinate) complex. The diagram is consistent with both EPR and electronic absorption spectroscopies, including the presence of a weak band at 1200 nm (8300 cm–1), which is seen in the NIR diffuse reflectance spectrum of solid 3. Other magnitudes are derived from the g-values in the EPR analysis (above).
Figure 6
Figure 6
One-electron orbital energies of the d orbitals as a function of the axial electronic interaction eσ. Note that the eπ component of the axial ligands does not affect the energies of the two highest energy levels because of orthogonality. The lower levels are slightly dependent on the axial eπ, but this interaction is removed for clarity. Here, eσ is treated as the sum of the two axial acetonitrile interactions.
Figure 7
Figure 7
Locations of the 5- and 6-coordinate complexes (vertical lines) while visualizing the dz2/dx2y2 energy gap in terms of eσ axial. The 5-coordinate complex 2 gives an exact value for eσ(MeCN), while the 6-coordinate complex 3 can be approximated as < 2eσ(MeCN) due to elongation of the Co–N bonds in 3.
Figure 8
Figure 8
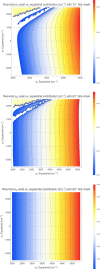
Contour plots that minimize the dz2/dx2y2 energy gap as a function of eσ and eπ of the equatorial phosphines. Color indicates the magnitude of the axial eσ (total) at the minimum. White areas indicate regions where other crossings have occurred and the dz2/dx2y2 transition is no longer relevant. Different “bite angles” of the phosphine ligands are calculated; (top) 75°, (middle) 83° (the average “bite angle” of dppv), and (bottom) 90°.

References

    1. Haynes W. M.; Lide D. R.; Bruno T. J.. CRC Handbook of Chemistry and Physics; CRC press, 2016.
    1. Chirik P. J. Iron- and Cobalt-Catalyzed Alkene Hydrogenation: Catalysis with Both Redox-Active and Strong Field Ligands. Acc. Chem. Res. 2015, 48, 1687–1695. 10.1021/acs.accounts.5b00134. - DOI - PubMed
    1. Kohler L.; Niklas J.; Johnson R. C.; Zeller M.; Poluektov O. G.; Mulfort K. L. Molecular Cobalt Catalysts for H2 Generation with Redox Activity and Proton Relays in the Second Coordination Sphere. Inorg. Chem. 2019, 58, 1697–1709. 10.1021/acs.inorgchem.8b03297. - DOI - PubMed
    1. Kurtz D. A.; Dhar D.; Elgrishi N.; Kandemir B.; McWilliams S. F.; Howland W. C.; Chen C.-H.; Dempsey J. L. Redox-Induced Structural Reorganization Dictates Kinetics of Cobalt(III) Hydride Formation via Proton-Coupled Electron Transfer. J. Am. Chem. Soc. 2021, 143, 3393–3406. 10.1021/jacs.0c11992. - DOI - PubMed
    1. Dempsey J. L.; Brunschwig B. S.; Winkler J. R.; Gray H. B. Hydrogen Evolution Catalyzed by Cobaloximes. Acc. Chem. Res. 2009, 42, 1995–2004. 10.1021/ar900253e. - DOI - PubMed