. 2022 Dec;65(12):2157-2171.
doi: 10.1007/s00125-022-05775-6. Epub 2022 Aug 3.

Disruption of retinal inflammation and the development of diabetic retinopathy in mice by a CD40-derived peptide or mutation of CD40 in Müller cells

Affiliations

Disruption of retinal inflammation and the development of diabetic retinopathy in mice by a CD40-derived peptide or mutation of CD40 in Müller cells

Jose-Andres C Portillo et al. Diabetologia. 2022 Dec.

Abstract

Aims/hypothesis: CD40 expressed in Müller cells is a central driver of diabetic retinopathy. CD40 causes phospholipase Cγ1 (PLCγ1)-dependent ATP release in Müller cells followed by purinergic receptor (P2X7)-dependent production of proinflammatory cytokines in myeloid cells. In the diabetic retina, CD40 and P2X7 upregulate a broad range of inflammatory molecules that promote development of diabetic retinopathy. The molecular event downstream of CD40 that activates the PLCγ1-ATP-P2X7-proinflammatory cytokine cascade and promotes development of diabetic retinopathy is unknown. We hypothesise that disruption of the CD40-driven molecular events that trigger this cascade prevents/treats diabetic retinopathy in mice.

Methods: B6 and transgenic mice with Müller cell-restricted expression of wild-type (WT) CD40 or CD40 with mutations in TNF receptor-associated factor (TRAF) binding sites were made diabetic using streptozotocin. Leucostasis was assessed using FITC-conjugated concanavalin A. Histopathology was examined in the retinal vasculature. Expression of inflammatory molecules and phospho-Tyr783 PLCγ1 (p-PLCγ1) were assessed using real-time PCR, immunoblot and/or immunohistochemistry. Release of ATP and cytokines were measured by ATP bioluminescence and ELISA, respectively.

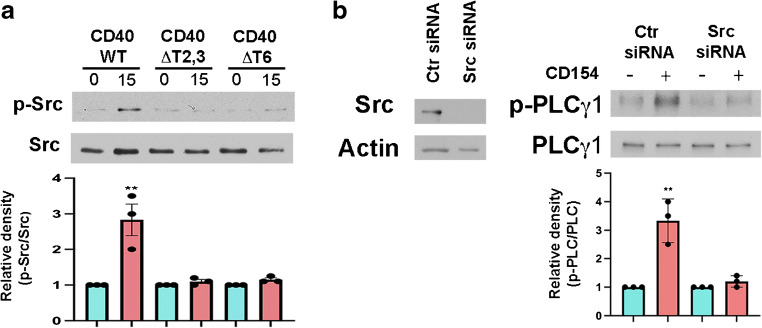
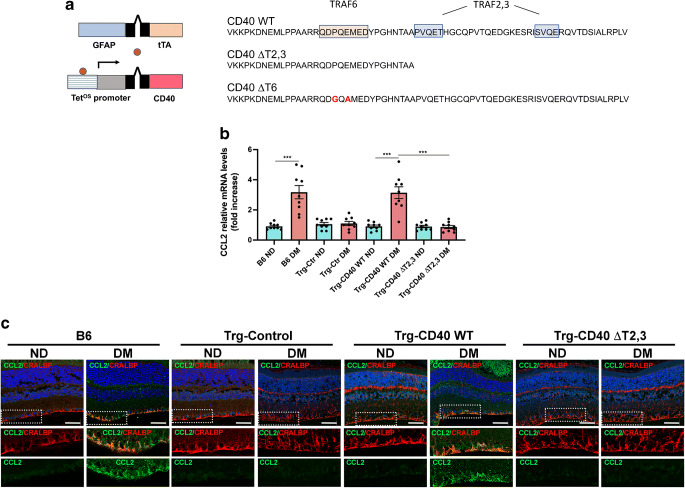
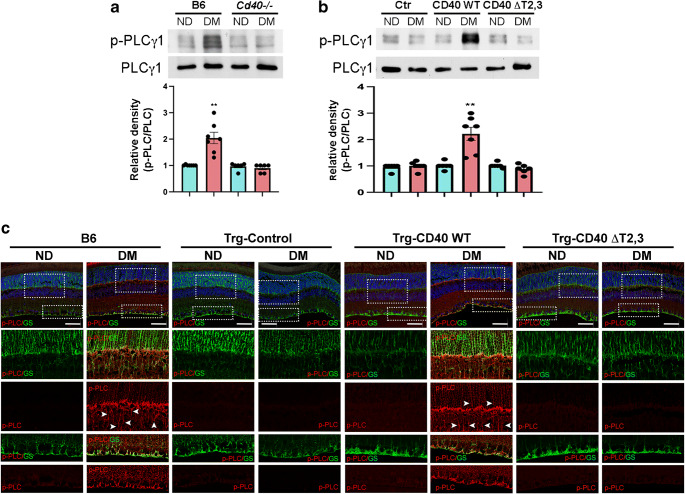
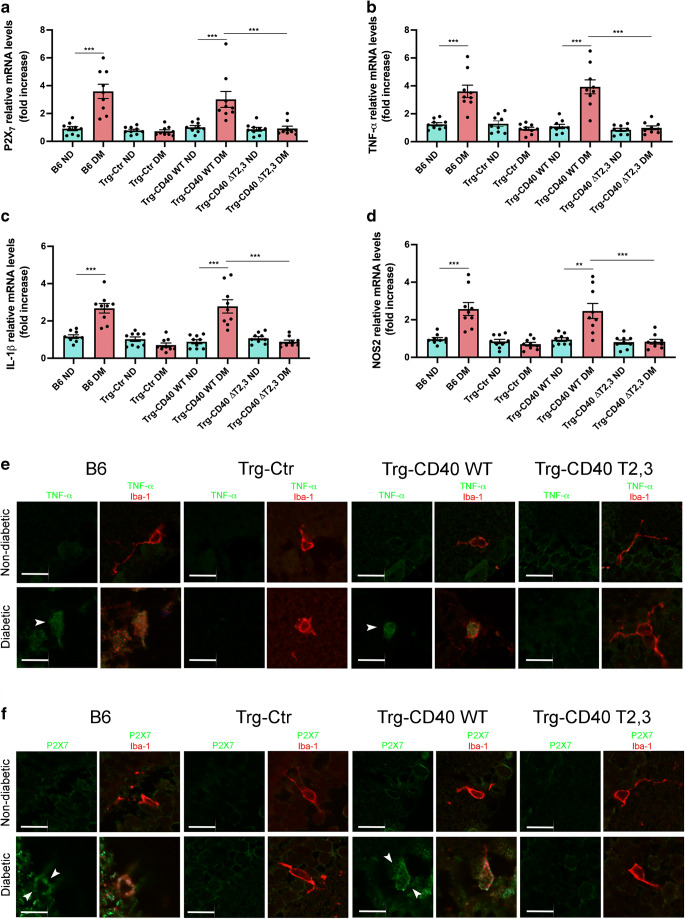
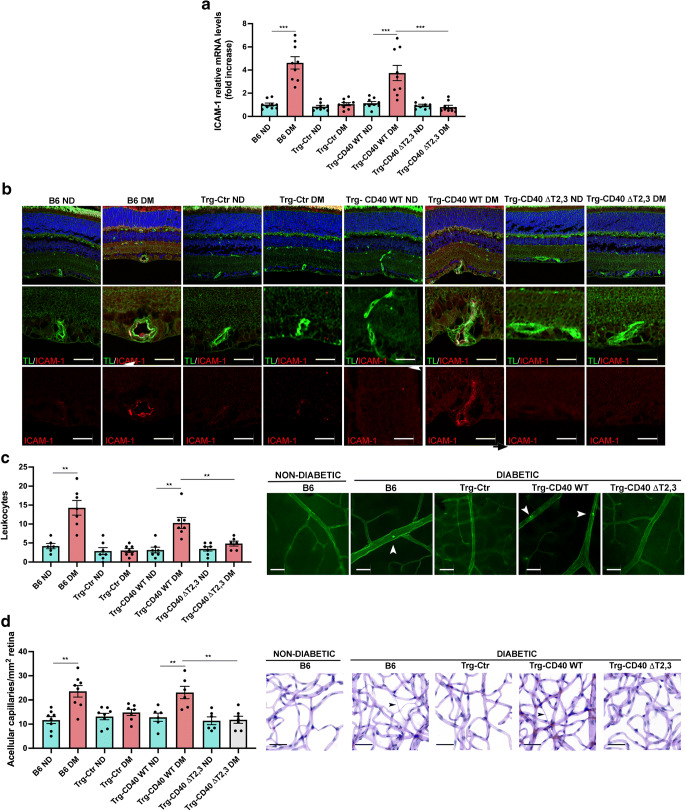
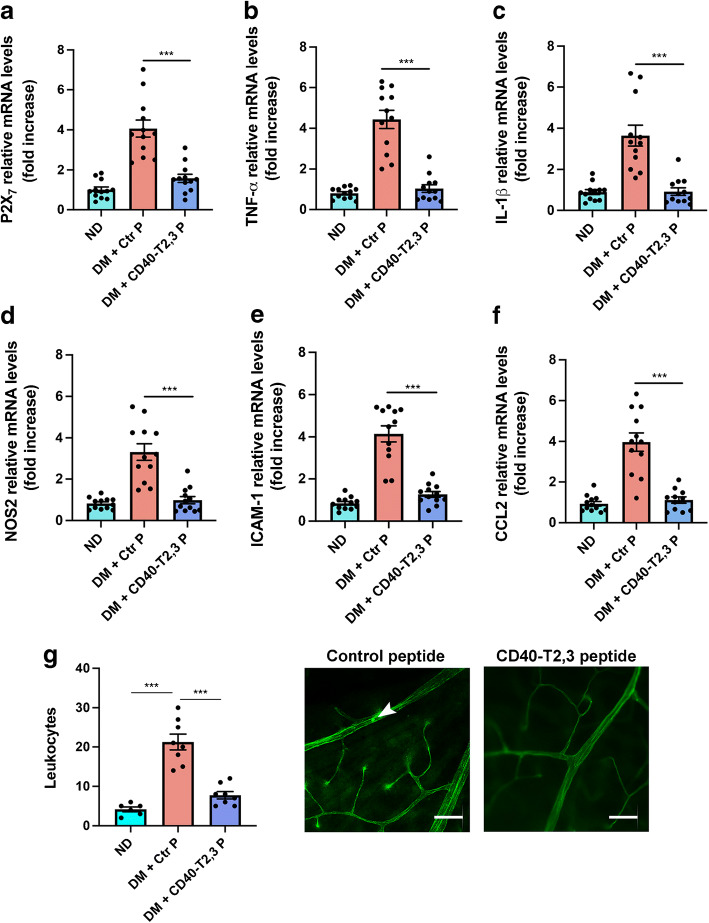
Results: Human Müller cells with CD40 ΔT2,3 (lacks TRAF2,3 binding sites) were unable to phosphorylate PLCγ1 and release ATP in response to CD40 ligation, and could not induce TNF-α/IL-1β secretion in bystander myeloid cells. CD40-TRAF signalling acted via Src to induce PLCγ1 phosphorylation. Diabetic mice in which WT CD40 in Müller cells was replaced by CD40 ΔT2,3 failed to exhibit phosphorylation of PLCγ1 in these cells and upregulate P2X7 and TNF-α in microglia/macrophages. P2x7 (also known as P2rx7), Tnf-α (also known as Tnf), Il-1β (also known as Il1b), Nos2, Icam-1 (also known as Icam1) and Ccl2 mRNA were not increased in these mice and the mice did not develop retinal leucostasis and capillary degeneration. Diabetic B6 mice treated intravitreally with a cell-permeable peptide that disrupts CD40-TRAF2,3 signalling did not exhibit either upregulation of P2X7 and inflammatory molecules in the retina or leucostasis.

Conclusions/interpretation: CD40-TRAF2,3 signalling activated the CD40-PLCγ1-ATP-P2X7-proinflammatory cytokine pathway. Src functioned as a link between CD40-TRAF2,3 and PLCγ1. Replacing WT CD40 with CD40 ΔT2,3 impaired activation of PLCγ1 in Müller cells, upregulation of P2X7 in microglia/macrophages, upregulation of a broad range of inflammatory molecules in the diabetic retina and the development of diabetic retinopathy. Administration of a peptide that disrupts CD40-TRAF2,3 signalling reduced retinal expression of inflammatory molecules and reduced leucostasis in diabetic mice, supporting the therapeutic potential of pharmacological inhibition of CD40-TRAF2,3 in diabetic retinopathy.

Keywords: CD40; Diabetic retinopathy; Endothelial cells; Inflammation; Microglia/macrophages; Müller cells.


Figures

Fig. 1
Fig. 1
Effect of disruption of CD40–TRAF signalling on PLCγ1 activation and ATP release in Müller cells as well as release of TNF-α and IL-1β in bystander myeloid cells. (a) Human Müller cells transduced with retroviral vector encoding WT CD40, CD40 ΔT2,3 or CD40 ΔT6. CD40 expression was examined by FACS. Cells were incubated with CD154 for 15 or 60 min. Phospho-Tyr783 PLCγ1 and total PLCγ1 were assessed by immunoblot. Relative density of phospho-Tyr783 PLCγ1 for each cell type was normalised to total PLCγ1 followed by normalisation relative to their respective unstimulated control samples (0 min time point). Relative density of phospho-Tyr783 PLCγ1 for unstimulated samples was given a value of 1. Graphs represent quantification of phospho-Tyr783 PLCγ1 relative to total PLCγ1 from three different experiments. (b) Müller cells expressing WT CD40 were transfected with siRNA against TRAF2 or TRAF6 or with control siRNA. Expression of TRAF2, TRAF6 and actin were assessed by immunoblot. Müller cells were stimulated with CD154 for 15 and 60 min. Phospho-Tyr783 PLCγ1 and total PLCγ1 were assessed as in (a). Relative densities of phospho-Tyr783 PLCγ1 from cells transfected with control, TRAF2 or TRAF6 siRNA were compared with bands from their respective unstimulated cells. Graphs represent quantification from three different experiments. (c) Supernatant fractions were collected at 0 and 15 min after incubation with CD154 and used to measure extracellular ATP (n=3). (d) CD40 stimulation in Müller cells triggers proinflammatory cytokine production by myeloid cells. CD40 ligation in Müller cells activates PLCγ1 that in turn triggers secretion of extracellular ATP. The P2X7 receptor is upregulated in microglia/macrophages in the diabetic retina. ATP binds P2X7 receptor leading to secretion of TNF-α and IL-1β. Created with BioRender.com (with permission). (e, f) Müller cells were incubated with CD40 human monocytic cell lines (MonoMac6) with or without CD154. TNF-α (e) and IL-1β (f) were measured by ELISA at predetermined optimal time points (4 h for TNF-α and 24 h for IL-1β). Results are presented as mean ± SD (n=3). **p<0.01 and ***p<0.001 by Student’s t test. Ctr, control; MFI, mean fluorescence intensity
Fig. 2
Fig. 2
Role of Src as a molecular link between CD40–TRAF signalling and activation of PLCγ1. (a) Human Müller cells that express WT CD40, CD40 ΔT2,3 or CD40 ΔT6 were incubated with CD154 for 15 min. Phospho-Tyr416 Src and total Src were assessed by immunoblot. Relative density of phospho-Tyr416 Src for each cell type was determined as described in Fig. 1. Graphs represent quantification of phospho-Tyr416 Src relative to total Src from three different experiments. (b) Müller cells that express WT CD40 were transfected with siRNA against Src or with control siRNA. Expression of Src and actin were assessed by immunoblot. Müller cells were incubated with CD154. Phospho-Tyr783 PLCγ1 and total PLCγ1 were examined by immunoblot at 15 min. Graphs represent quantification of phospho-Tyr783 PLCγ1 relative to total PLCγ1 from three different experiments. Results are presented as mean ± SD (n=3). **p<0.01 by Student’s t test. Ctr, control
Fig. 3
Fig. 3
Effect of CD40 ΔT2,3 expressed in Müller cells from diabetic mice on upregulation of CCL2, an inflammatory molecule that is normally directly induced by WT CD40 in Müller cells. (a) Lines of transgenic mice. Responder lines of mice have a transgene for either WT Cd40, Cd40 ΔT2,3 or Cd40 ΔT6 cloned downstream of the TetOS promoter. Driver mice have a tTA transgene downstream of GFAP promoter. Amino acid sequences of the corresponding intracytoplasmic tail of CD40 are shown. Amino acids in red represent mutations known to impair recruitment of TRAF6. (b) At 2 months of diabetes, retinas from diabetic B6, Trg-Ctr, Trg-CD40 WT and Trg-CD40 ΔT2,3 mice, as well as from non-diabetic control mice, were collected and used for mRNA extraction. Ccl2 mRNA was assessed by real-time quantitative PCR using 18S rRNA as internal control. One non-diabetic B6 mouse was given an arbitrary value of 1 and data are expressed as fold increase compared with this mouse. Bars represent mean ± SEM (n=7–9 mice per group). ***p<0.01 by ANOVA. (c) Retinal sections were incubated with antibodies against CCL2 and CRALBP (which labels Müller cells). Areas within the boxes are magnified in lower images. Scale bar, 50 μm. DM, diabetic; ND, non-diabetic
Fig. 4
Fig. 4
Effect of CD40 ΔT2,3 expressed in Müller cells from diabetic mice on Tyr783 phosphorylation of PLCγ1. (a, b) At 2 months of diabetes, retinal lysates from B6 and Cd40−/− mice (a) or transgenic Trg-CD40 WT and Trg-CD40 ΔT2,3 mice (b) were probed for expression of phospho-Tyr783 PLCγ1 and total PLCγ1 by immunoblot. Graphs represent quantification of phospho-Tyr783 PLCγ1 relative to total PLCγ1 from 4–7 mice per group. (c) Retinal sections were incubated with antibodies against phospho-Tyr783 PLCγ1 and glutamine synthetase (which labels Müller cells). Areas within the boxes are magnified in lower images. Arrowheads show some of the areas where phospho-Tyr783 PLCγ1 co-localises with glutamine synthetase. Scale bar, 50 μm. **p<0.01 by Student’s t test. DM, diabetic; GS, glutamine synthetase; ND, non-diabetic
Fig. 5
Fig. 5
Effect of CD40 ΔT2,3 expressed in Müller cells from diabetic mice on upregulation of P2X7, TNF-α, IL-1β, and NOS2 in the retina. (ad) At 2 months of diabetes, inflammatory molecules’ mRNAs were assessed by real-time quantitative PCR using 18S rRNA as internal control. One non-diabetic B6 mouse was given an arbitrary value of 1 and data are expressed as fold increase compared with this mouse. Bars represent mean ± SEM (n=7–9 mice per group). **p<0.01 and ***p<0.001 by ANOVA. (e, f) Retinal sections were incubated with anti-TNF-α plus anti-Iba-1 (a marker of microglia/macrophages) (e) or anti-P2X7 plus anti-Iba-1 (f). Arrowheads show TNF-α-positive or P2X7-positive areas that co-localise with Iba-1. Scale bar, 10 μm. DM, diabetic; ND, non-diabetic
Fig. 6
Fig. 6
Effect of CD40 ΔT2,3 expressed in Müller cells from diabetic mice on upregulation of ICAM-1 in the retina and development of early diabetic retinopathy. (a) At 2 months of diabetes, Icam-1 mRNA was assessed by real-time quantitative PCR in retinas from diabetic B6, Trg-Ctr, Trg-CD40 WT and Trg-CD40 ΔT2,3 mice as well as from non-diabetic control mice. 18S rRNA was used as internal control. One non-diabetic B6 mouse was given an arbitrary value of 1 and data are expressed as fold increase compared with this mouse. Bars represent mean ± SEM (n=7–9 mice per group). (b) At 2 months of diabetes, retinal sections were incubated with anti-ICAM-1 mAb plus tomato lectin (labels neural mouse endothelial cells). Magnified blood vessels are shown. Scale bar, 10 μm. (c) At 2 months of diabetes, concanavalin A-labelled adherent leucocytes in the retinal vasculature were quantified. Retinal flat-mounts were generated and brightly fluorescent leucocytes adherent to blood vessels were counted in the entire retina using fluorescence microscopy. Arrowheads show adherent leucocytes within the vasculature. Scale bar, 20 μm. n=6 or 7 mice per group. (d) At 8 months of diabetes retinal digests were examined for the presence of degenerate capillaries. Bars represent mean ± SEM. n=6–8 mice per group. Arrows show degenerate capillaries in the retinal digest. Scale bar, 50 μm. **p<0.01 and ***p<0.001 by ANOVA. DM, diabetic; ND, non-diabetic; TL, tomato lectin
Fig. 7
Fig. 7
Effect of administration of a CD40–TRAF2,3 peptide on upregulation of P2X7 and inflammatory molecules as well as leucostasis in the diabetic retina. At 2 months of diabetes, one eye from each B6 mouse received either ri control peptide or ri CD40–TRAF2,3 peptide (1 μg, by intravitreal injection). Eyes were collected after 2 weeks. (af) P2x7 (a), Tnf-α (b), Il-1β (c), Nos2 (d), Icam-1 (e) and Ccl2 mRNAs (f) were assessed by quantitative real-time PCR. (g) Adherent leucocytes in the retinal vasculature were quantified by labelling with concanavalin A. Horizontal bars represent mean ± SEM (n=6–12 mice per group). Arrowhead shows adherent leucocyte within the vasculature in retinal flat-mount. Scale bar, 20 μm. ***p<0.001 by ANOVA. CD40-T2,3 ri CD40–TRAF2,3 peptide; Ctr P, ri control peptide; DM, diabetic; ND, non-diabetic

Similar articles

Cited by

References

    1. Peters AL, Stunz LL, Bishop GA. CD40 and autoimmunity: the dark side of a great activator. Semin Immunol. 2009;21(5):293–300. doi: 10.1016/j.smim.2009.05.012. - DOI - PMC - PubMed
    1. Roy S, Kern TS, Song B, Stuebe C. Mechanistic Insights into Pathological Changes in the Diabetic Retina: Implications for Targeting Diabetic Retinopathy. Am J Pathol. 2017;187(1):9–19. doi: 10.1016/j.ajpath.2016.08.022. - DOI - PMC - PubMed
    1. Kern TS, Antonetti DA, Smith LEH. Pathophysiology of Diabetic Retinopathy: Contribution and Limitations of Laboratory Research. Ophthalmic Res. 2019;62(4):196–202. doi: 10.1159/000500026. - DOI - PMC - PubMed
    1. Portillo J-AC, Greene JA, Okenka G, et al. CD40 promotes the development of early diabetic retinopathy. Diabetologia. 2014;57:2222–2231. doi: 10.1007/s00125-014-3321-x. - DOI - PMC - PubMed
    1. Portillo J-AC, Lopez Corcino Y, Miao Y, et al. CD40 in retinal Muller cells induces P2X7-dependent cytokine expression in macrophages/microglia in diabetic mice and development of early experimental diabetic retinopathy in mice. Diabetes. 2017;66:483–493. doi: 10.2337/db16-0051. - DOI - PMC - PubMed

Publication types