. 2022 Sep 12;23(9):3621-3647.
doi: 10.1021/acs.biomac.2c00545. Epub 2022 Aug 3.

Interactions between Nitric Oxide and Hyaluronan Implicate the Migration of Breast Cancer Cells

Affiliations

Interactions between Nitric Oxide and Hyaluronan Implicate the Migration of Breast Cancer Cells

Amir M Alsharabasy et al. Biomacromolecules. .

Abstract

Nitric oxide (NO) is one of the prominent free radicals, playing a pivotal role in breast cancer progression. Hyaluronic acid (HA) plays an essential role in neutralizing free radicals in tumor tissues. However, its interactions with nitric oxide have not been thoroughly investigated. Hence, this study attempts to understand the mechanism of these interactions and the different effects on the intracellular NO levels and migration of breast cancer cells. The affinity of HA to scavenge NO was investigated alongside the accompanying changes in specific physico-chemical properties and the further effects on the NO-induced attachment and migration of the breast cancer cell lines, MDA-MB-231 and HCC1806. The reaction of the nitrogen dioxide radical, formed via NO/O2 interactions, with HA initiated a series of oxidative reactions, which, in the presence of NO, induce the fragmentation of the polymeric chains. Furthermore, these interactions were found to hinder the NO-induced migration of cancer cells. However, the NO-induced HA modification/fragmentation was inhibited in the presence of hemin, a NO-scavenging compound. Collectively, these results help toward understanding the involvement of HA in the NO-induced cell migration and suggest the possible modification of HA, used as one of the main materials in different biomedical applications.


Conflict of interest statement

The authors declare no competing financial interest.

Figures

Scheme 1
Scheme 1. General Methods and Characterization Techniques Employed for (1) Measurement of the NO Scavenging by 1000 kDa HA, (2) Characterization of HA Following Modification by NO, and (3) In Vitro Testing of the Effects of the Different Products on Breast Cancer Cells. Schematic Created with BioRender.com.
Figure 1
Figure 1
Temporal changes in the NO levels in PBS: (A) Average release profile of NO from 300 μM DETA-NO only (black color) and the changes in its concentrations after the further addition of 1000 kDa HA with the concentrations of 200 (red color), 500 (green color), and 1000 μg/mL (blue color). HA was added 18 min after DETA-NO injection, as indicated by an arrow. (B) Average release profile of NO from 300 μM DETA-NO, injected into an overnight-polarized PBS solution containing 1000 μg/mL HA (magenta color) or DMTMM-activated HA (brown color). (C) Box and whisker plots showing the mathematical area under the curves, and data represented are the means ± S.E.M. (D). NO levels released from 30, 150, 300, and 600 μM DETA-NO, followed by the injection of HA for a final concentration of 1000 μg/mL, as indicated by an arrow. The data are represented as the mean NO concentration of three measurements per group. *p < 0.05 compared to the control group (DETA-NO only group) using a two-tailed unpaired Student t-test.
Figure 2
Figure 2
Detection of nitrite generated from (A) different concentrations of DETA-NO, incubated for 2 h in phosphate buffer (50 mM, pH 7.4) at 37 °C, (B) mixing of different concentrations of 1000 kDa HA with 300 μM DETA-NO and incubation for 2 h at 37 °C, and (C) incubation of a mixture of 500 or 1000 μg of HA with 300 μM DETA-NO for 24 h, with the measurement of the nitrite concentration at certain intervals using Griess assay. After the incubation period, 150 μL of each sample was mixed with 130 μL of phosphate buffer and 20 μL of the working reagent, incubated at RT for 30 min, and the absorbance was then measured at 548 nm. Data are represented as mean ± SD, n = 3. *,#, P < 0.05 in the case of 500 and 1000 μg/mL HA, respectively, versus the HA-free group using a two-tailed unpaired Student t-test.
Figure 3
Figure 3
Effects of 1000 kDa HA on the NO-enhanced luminescence signal. (A) Luminescence intensity was measured over 125 min following the incubation of a mixture of 1 mM SNP with 100, 200, and 500 μg/mL HA in phosphate buffer (50 mM, pH 7.4). (B) Corresponding luminescence intensity in the absence of NO. (C) Box and whisker plots showing the mathematical area under the curves, and data represented are the means ± SD, n = 3. *, P < 0.05 compared to the control group (DETA-NO only group) using a two-tailed unpaired Student t-test.
Figure 4
Figure 4
1H NMR spectrum of untreated and lyophilized 1000 kDa HA at 400 MHz and a temperature of 25 °C. The sample was dissolved in D2O.
Figure 5
Figure 5
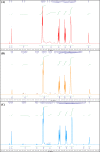
Comparison of the 1H NMR spectra of (A) HA/30-DETA-NO, (B) HA/300-DETA-NO (6 h), and (C) HA/300-DETA-NO (24 h). Following the lyophilization of the different HA products, they were dissolved in D2O, and the NMR spectra were recorded at 400 MHz. A description of each HA product is given in Table 1.
Figure 6
Figure 6
Comparison of the 1H NMR spectra of (A) HA/600-DETA-NO, (B) HA/300-DETA-NO/4-Hemin, and (C) HA/300-DETA-NO/8-Hemin. Following the lyophilization of the different HA products, they were dissolved in D2O, and the NMR spectra were recorded at 400 MHz. A description of each HA product is given in Table 1.
Figure 7
Figure 7
FTIR spectrum of (A) 1000 kDa lHA, (B) HA/30-DETA-NO, (C) HA/150-DETA-NO, (D) HA/300-DETA-NO, (E) HA/600-DETA-NO, (F) HA/300-DETA-NO/4-Hemin, and (G) HA/300-DETA-NO/8-Hemin. A description of each HA product is presented in Table 1.
Figure 8
Figure 8
HA fragmentation following different treatments. (A) Change in viscosity calculated over time of 1000 kDa HA following treatment with 30, 300, and 600 μM DETA-NO; a mixture of 300 μM DETA-NO and 8 μM hemin; deactivated 300 μM DETA-NO; 1000 μM H2O2; or 100 U/mL hyaluronidase. At time 0, the initial viscosity of 1000 μg/mL HA in PBS was measured, followed by the different treatments and incubation at 37 °C for 24 h when calculating the viscosity of each solution after 1.5, 6, and 24 h. Data are represented as mean ± SD, n = 3. (B) Comparison of the HPLC-RID chromatograms of nHA, unmodified lHA, HA/30-DETA-NO, HA/150-DETA-NO, HA/300-DETA-NO, and HA/600-DETA-NO. (C) Comparison of the chromatograms of nHA, lHA, HA/300-DETA-NO, HA/300-DETA-NO/4-Hemin, and HA/300-DETA-NO/8-Hemin. (D) Comparison of the chromatograms of lHA, HA/SNP, HA/SNAP, HA/SIN-1, HA/500-H2O2, HA/1000-H2O2, and HA/HAase. Following the incubation of each mixture in PBS for 24 h at 37 °C, it was lyophilized, dissolved in HPLC grade water for a final concentration of 500 μg/mL, and separated by the HPLC system and detected by RID. The description of each HA product is given in Table 1.
Scheme 2
Scheme 2. Cascade of the Main Extracellular Radical Reactions Involved in the Degradation of HA and How This Was Evaluated
The reaction starts with (1) the initiation phase in which either OH or NO2, produced from the reaction of NO with molecular oxygen, attacks the C atoms forming the main rings of the monomer units, followed by (2) the propagation phase in the presence of O2. The reaction is terminated by steps within (3) the termination phase, starting with NO, leading finally to a partial fragmentation of the HA chains, which can either close the catalytic cycle or start a new initiation phase. These radical-induced reactions are compared with the hyaluronidase-catalyzed HA degradation. Schematic created with BioRender.com.
Figure 9
Figure 9
In vitro cytotoxicity of 1000 kDa nHA and HA products. (A) Metabolic activity of MDA-MB-231 (red color) and iNOS-transfected HCC1806 (blue color) against different concentrations of 1000 kDa HA (nHA) after 24 and 48 h of culture. (B) Metabolic activity of MDA-MB-231 after 24 (black color) and 48 h (gray color) of culture with nHA, untreated lHA, HA/30-DETA-NO, HA/300-DETA-NO, HA/600-DETA-NO, HA/300-DETA-NO/4-hemin, and HA/300-DETA-NO/8-hemin. Each HA product was diluted in FBS-free RPMI to a final concentration of 500 μg/mL, added to the cells cultured further at 37 °C in 5% CO2. The metabolic activity was measured using the alamarBlue assay. Data are represented as mean ± SD, n = 3. *,#, P < 0.05 versus the cells treated with lHA only for 24 and 48 h, respectively, using a two-tailed unpaired Student t-test. A description of each HA product is presented in Table 1. The effects of different concentrations of DETA-NO on the metabolic activity of MDA-MB-231 were evaluated before. To assess the possibility of the remaining NO donor or H2O2 in the lyophilized HA products, these were dissolved in PBS containing 1 mM luminol, and the luminescence readings were measured over time. This was to find whether these products contain certain components which can enhance the luminescence intensity, such as ROS or RNS. An example of the results after 50 min of incubation at 37 °C is shown in Figure S12. There is still a probability that non-degraded DETA-NO is present in the lyophilized HA products, which enhanced the luminescence signal upon dissolving HA in PBS. However, this does not explain the sharp decrease observed in metabolic activity of cells in HA/30-DETA-NO compared to the other HA/DETA-NO products. Similarly, although the HA/H2O2 products did not enhance the luminescence signal, these products strongly inhibited cell viability. Accordingly, the observed effects of the different HA products are due to the modified HA chains compared to the released radicals in solution.
Figure 10
Figure 10
Kinetics of the changes in intracellular NO levels revealed by the NO-specific indicator DAF-FM-DA and its fluorescence in MDA-MB-231 cells in response to 300 μM DETA-NO in the presence of different concentrations of 1000 kDa HA (A) and the typical fluorescence in the presence of HA without a NO donor (B) and iNOS-transfected HCC1806 cells in response to the treatment with different concentrations of HA (C). The cells were treated with DAF-FM-DA for 1 h and then photographed after adding the different treatments using the real-time Incucyte imaging system (phase contrast and green fluorescence signals). Data are represented as the mean of readings of three samples per group.
Figure 11
Figure 11
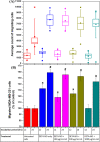
Effects of DETA-NO and 1000 kDa HA on the migration of MDA-MB-231 cells. (A) Box-whisker blot showing the distribution of the number of counted cells migrated through the transwell membranes toward the chemoattractant composed of 300 μM DETA-NO in FBS-containing RPMI in the presence or absence of 100, 500, and 1000 μg/mL HA. The whiskers represent the SD values. (B) % of migrated cells normalized to the count in the control group (untreated cells migrated toward the medium only). Following culture for 12 and 24 h, the number of migrated cells was counted. Data are represented as mean ± SD, n = 3. *,#, P < 0.05 versus the untreated cells (negative control) left to migrate for 12 and 24 h, respectively, using a two-tailed unpaired Student t-test.
Figure 12
Figure 12
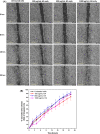
Effects of DETA-NO and 1000 kDa HA on MDA-MB-231 cell migration. (A) Images of scratches at 0, 8, 16, and 24 h in the case of untreated cells or cells treated with 300 μM DETA-NO only, 500 μg/mL HA, or a mixture of 300 μM DETA-NO and 500 μg/mL HA. Scale bar: 800 μm. (B) Quantification of the percentage of the wounded area closed over time concerning the initial wound area (at time 0). The scratch was generated using a 2-well insert. Following the treatment of cells with the different treatments, each well was imaged using an IncuCyte S3 Automated Live-Cell Analysis System at regular intervals of 1 h for 24 h. The change in wound area was quantified using ImageJ software. Data are represented as mean ± SD, n = 3.
Figure 13
Figure 13
Effects of different concentrations of 1000 kDa HA on iNOS-transfected HCC1806 cell migration. (A) Images of scratches at 0, 8, 16, and 22 h in the case of untreated cells or cells treated with 100, 500, or 1000 μg/mL HA. Scale bar: 800 μm. (B) Quantification of the percentage of the wounded area closed over time concerning the initial wound area (at time 0). The scratch was generated using a 2-well insert. Following the treatment of cells with the different treatments, each well was imaged using the IncuCyte S3 Automated Live-Cell Analysis System at regular intervals of 2 for 22 h. The change in wound area was quantified using ImageJ software. Data are represented as mean ± SD, n = 3.

References

    1. Laurent T. C.; Fraser J. R. E. Hyaluronan 1. FASEB J. 1992, 6, 2397–2404. 10.1096/fasebj.6.7.1563592. - DOI - PubMed
    1. Vigetti D.; Karousou E.; Viola M.; Passi A.; Analysis of Hyaluronan Synthase Activity. Methods in Molecular Biology; Humana Press: New York, NY, 2015; Vol. 1229, pp 201–208. - PubMed
    1. Karihtala P.; Soini Y.; Auvinen P.; Tammi R.; Tammi M.; Kosma V.-M. Hyaluronan in Breast Cancer: Correlations With Nitric Oxide Synthases and Tyrosine Nitrosylation. J. Histochem. Cytochem. 2007, 55, 1191–1198. 10.1369/jhc.7A7270.2007. - DOI - PubMed
    1. Wu W.; Chen L.; Wang Y.; Jin J.; Xie X.; Zhang J. Hyaluronic Acid Predicts Poor Prognosis in Breast Cancer Patients. Medicine 2020, 99, e2043810.1097/MD.0000000000020438. - DOI - PubMed
    1. Walsh E. M.; Keane M. M.; Wink D. A.; Callagy G.; Glynn S. A. Review of Triple Negative Breast Cancer and the Impact of Inducible Nitric Oxide Synthase on Tumor Biology and Patient Outcomes. Crit. Rev. Oncog. 2016, 21, 333–351. 10.1615/CritRevOncog.2017021307. - DOI - PMC - PubMed

Publication types