. 2022 Aug 3:11:e78634.
doi: 10.7554/eLife.78634.

Robust and Efficient Assessment of Potency (REAP) as a quantitative tool for dose-response curve estimation

Affiliations

Robust and Efficient Assessment of Potency (REAP) as a quantitative tool for dose-response curve estimation

Shouhao Zhou et al. Elife. .

Abstract

The median-effect equation has been widely used to describe the dose-response relationship and identify compounds that activate or inhibit specific disease targets in contemporary drug discovery. However, the experimental data often contain extreme responses, which may significantly impair the estimation accuracy and impede valid quantitative assessment in the standard estimation procedure. To improve the quantitative estimation of the dose-response relationship, we introduce a novel approach based on robust beta regression. Substantive simulation studies under various scenarios demonstrate solid evidence that the proposed approach consistently provides robust estimation for the median-effect equation, particularly when there are extreme outcome observations. Moreover, simulation studies illustrate that the proposed approach also provides a narrower confidence interval, suggesting a higher power in statistical testing. Finally, to efficiently and conveniently perform common lab data analyses, we develop a freely accessible web-based analytic tool to facilitate the quantitative implementation of the proposed approach for the scientific community.

Keywords: Shiny; cancer biology; dose-response; drug potency; none; quantitative tool; robust estimation; software.

Plain language summary

Finding a new drug which is both safe and efficient is an expensive and time-consuming endeavour. In particular, establishing the ‘dose-effect relationship’ – how beneficial a drug is at different dosages – can be challenging. Predicting this curve requires gathering experimental data by exposing and recording how cells respond to various levels of the drug. However, extreme values are often observed at low and high dosages, potentially introducing errors that are hard to correct in the prediction process. Yet, these extreme observations are sometimes genuine so researchers cannot just ignore them. To improve dose-effect estimation, Zhou, Liu, Fang et al. developed a new general-purpose approach. It uses advanced statistical modelling to account for extremes in lab data. This strategy outperformed other methods when dealing with these observations while also providing higher efficiency in data analysis with more uniform data in experiments. To facilitate implementation, Zhou, Liu, Fang et al. set up a user-friendly tool baptized ‘REAP’; this free online resource allows scientists without advanced statistical experience to harness the new approach and to perform dose-effect analysis more easily and accurately. This could boost research across many different disciplines that examine the effects of chemicals on cells.


Conflict of interest statement

SZ, XL, XF, VC, MW, HW, ND, CS, JL No competing interests declared

Figures

Figure 1.
Figure 1.. Dose-response curve fitting with extreme observations.
The original data points are on the true curve. The leftmost data point is changed from 0.005 to 1e-6, referring to a small white noise that cannot be visually recognized. The change leads to the obvious departure between the estimated curve by linear regression model (dotted) and the true curve (solid), which demonstrates that standard regression is sensitive to extreme values. The response at the true IC50 (dotdashed, vertical, left) is only 22% from the estimated curve; the estimated IC50 (dotdashed, vertical, right) corresponds to the 70% fraction of cell affected, effecting a substantive 20% inflation (50% ->70%) in estimation error. In contrast, the estimated curve by beta regression model (dashed) is almost overlapped with the true curve (solid), which shows that BRM is much more robust to extreme values. LRM: linear regression model; BRM: robust beta regression model. Detailed model descriptions of LRM and BRM are provided in Materials and methods section.
Figure 2.
Figure 2.. Comparison of estimation efficiency and accuracy using linear regression model and beta regression model.
Deleting the extreme values could not eliminate the bias (panel A), but only harmed the accuracy with worse coverage probabilities (panel B) and impaired the efficiency of interval estimation with wider nominal 95% confidence intervals (panel C). A total of 1000 data sets were generated following the data simulating process described in Appendix 1, using the dose sets and true dose-response curve under 7 dose setting with a precision parameter of 100. Responses ≤5% or ≥95% were considered extreme responses. Dashed line in panel B denotes 95% nominal coverage probability. BRM: beta regression with extreme data points; LRM: linear regression model with extreme data points; LRM(t): linear regression model with truncated dataset after deleting extreme values. Detailed model descriptions of LRM and BRM are provided in Materials and methods section.
Figure 3.
Figure 3.. REAP App interface, with a highlight of Output section.
Using the robust beta regression method, REAP produces a dose-response curve plot with effect and model estimations. The left panel allows users to specify model features and design plot specifics. REAP also provides hypothesis testing results to compare effect estimations, slopes and models.
Figure 4.
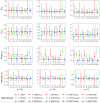
Figure 4.. Comparison of the point estimates and 95% confidence intervals using linear regression model, heavy-tailed linear regression model and robust beta regression model, with data simulated from normal error term.
The vertical solid lines indicate the true values. The dots represent the averaged point estimates and the bars represent the averaged lower and upper bound of 95% CIs. The point estimation by robust beta regression is consistently closer to the true value with a narrower 95% CI compared to the linear regression model. The 95% CI of heavy-tailed linear regression underestimates the nominal coverage probability. LRM: linear regression model; LRM-7: LRM under 7-dose dataset with extreme data points; LRM-6noL: LRM under 6 dose dataset after removing the highest dose data point; LRM-6noS: LRM under 6-dose dataset after removing the lowest dose data point; LRM-7lessE: LRM under 7-dose dataset with less extreme data points; LRM-7NCP: LRM under 7-dose dataset with extreme data points and dose-dependent precision; HLRM: heavy-tailed linear regression model; HLRM-7: Heavy-tailed LRM under 7-dose dataset with extreme data points; HLRM-6noL: Heavy-tailed LRM under 6-dose dataset after removing the highest dose data point; HLRM-6noS: Heavy-tailed LRM under 6-dose dataset after removing the lowest dose data point; HLRM-7lessE: Heavy-tailed LRM under 7-dose dataset with less extreme data points; HLRM-7NCP: Heavy-tailed LRM under 7-dose dataset with extreme data points and dose-dependent precision; BRM: robust beta regression model; BRM-7: BRM under 7-dose dataset with extreme data points; BRM-6noL: BRM under 6-dose dataset after removing the highest dose data point; BRM-6noS: BRM under 6-dose dataset after removing the lowest dose data point; BRM-7lessE: BRM under 7-dose dataset with less extreme data points; BRM-7NCP: BRM under 7-dose dataset with extreme data points and dose-dependent precision. Detailed model descriptions of LRM, HLRM, and BRM are provided in Materials and methods section.
Figure 5.
Figure 5.. Dose-response curve estimation of auranofin (μM) under different MCL cell lines.
The dose-response curve was fitted with a dose-dependent precision with log(dose) as an additional regressor for the precision estimator. Observed dose effects are displayed with interval bars, which end with arrows when estimated intervals exceed (0,1). Triangles at the bottom indicate IC50 values for each MCL cell line. MCL: mantle cell lymphoma.
Figure 6.
Figure 6.. Dose-response curve estimation of anti-viral drugs under the same biological batch with SARS-CoV-2 data.
The robust beta regression gives reasonable estimations to the dose-response curve of hydroxychloroquine, compared to the inconclusive dose-response curve fitted by linear regression in Bobrowski et al. (2020). The plot is generated without selecting the option of mean and confidence interval for observations. Triangles indicate the estimated EC50 values for each drug.
Appendix 1—figure 1.
Appendix 1—figure 1.. Comparison of the point estimates and 95% confidence intervals using linear regression model, heavy-tailed linear regression model and robust beta regression model, with data simulated from beta error term.
The vertical solid lines indicate the true values. The dots represent the averaged point estimates and the bars represent the averaged lower and upper bound of 95% CIs. The point estimation by robust beta regression is consistently closer to the true value with a narrower 95% CI compared to the linear regression model. The 95% CI of heavy-tailed linear regression underestimates the nominal coverage probability. LRM: linear regression model; LRM-7: LRM under 7 dose dataset with extreme data points; LRM-6noL: LRM under 6 dose dataset after removing the highest dose data point; LRM-6noS: LRM under 6 dose dataset after removing the lowest dose data point; LRM-7lessE: LRM under 7 dose dataset with less extreme data points; LRM-7NCP: LRM under 7 dose dataset with extreme data points and dose-dependent precision; HLRM: heavy-tailed linear regression model; HLRM-7: Heavy-tailed LRM under 7 dose dataset with extreme data points; HLRM-6noL: Heavy-tailed LRM under 6 dose dataset after removing the highest dose data point; HLRM-6noS: Heavy-tailed LRM under 6 dose dataset after removing the lowest dose data point; HLRM-7lessE: Heavy-tailed LRM under 7 dose dataset with less extreme data points; HLRM-7NCP: Heavy-tailed LRM under 7 dose dataset with extreme data points and dose-dependent precision; BRM: robust beta regression model; BRM-7: BRM under 7 dose dataset with extreme data points; BRM-6noL: BRM under 6 dose dataset after removing the highest dose data point; BRM-6noS: BRM under 6 dose dataset after removing the lowest dose data point; BRM-7lessE: BRM under 7 dose dataset with less extreme data points; BRM-7NCP: BRM under 7 dose dataset with extreme data points and dose-dependent precision.

Similar articles

Cited by

References

    1. Bickel P, Doksum K. Mathematical Statistics: Basic Ideas and Selected Topics. Chapman and Hall/CRC; 2015.
    1. Blaauboer BJ, Boekelheide K, Clewell HJ, Daneshian M, Dingemans MML, Goldberg AM, Heneweer M, Jaworska J, Kramer NI, Leist M, Seibert H, Testai E, Vandebriel RJ, Yager JD, Zurlo J. The use of biomarkers of toxicity for integrating in vitro hazard estimates into risk assessment for humans. ALTEX. 2012;29:411–425. doi: 10.14573/altex.2012.4.411. - DOI - PubMed
    1. Bobrowski T, Chen L, Eastman RT, Itkin Z, Shinn P, Chen CZ, Guo H, Zheng W, Michael S, Simeonov A, Hall MD, Zakharov AV, Muratov EN. Synergistic and antagonistic drug combinations against SARS-CoV-2. Molecular Therapy. 2021;29:873–885. doi: 10.1016/j.ymthe.2020.12.016. - DOI - PMC - PubMed
    1. Byrne HJ, Maher MA. Numerically modelling time and dose dependent cytotoxicity. Computational Toxicology. 2019;12:100090. doi: 10.1016/j.comtox.2019.100090. - DOI
    1. Chou TC. Derivation and properties of Michaelis-Menten type and Hill type equations for reference ligands. Journal of Theoretical Biology. 1976;59:253–276. doi: 10.1016/0022-5193(76)90169-7. - DOI - PubMed

Publication types

MeSH terms