. 2022 Oct 1;33(12):ar110.
doi: 10.1091/mbc.E22-03-0091. Epub 2022 Aug 3.

Identification of a Golgi-localized peptide reveals a minimal Golgi-targeting motif

Affiliations

Identification of a Golgi-localized peptide reveals a minimal Golgi-targeting motif

Alexandra P Navarro et al. Mol Biol Cell. .

Abstract

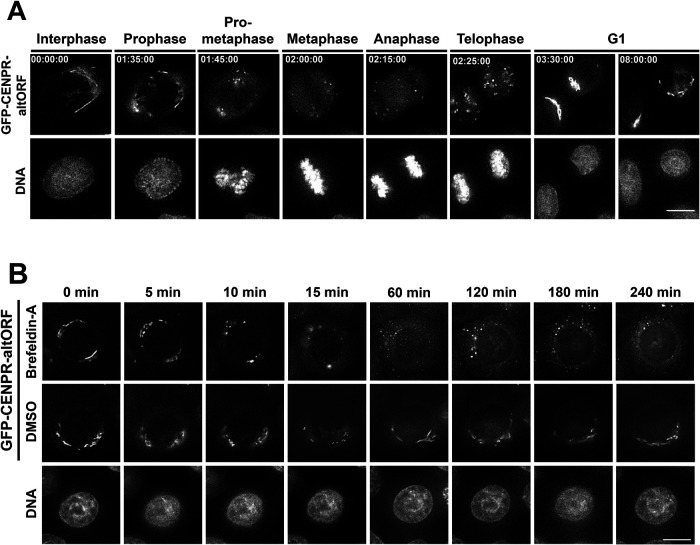
Prior work has identified signal sequences and motifs that are necessary and sufficient to target proteins to specific subcellular regions and organelles such as the plasma membrane, nucleus, endoplasmic reticulum, and mitochondria. In contrast, minimal sequence motifs that are sufficient for Golgi localization remain largely elusive. In this work, we identified a 37-amino acid alternative open reading frame (altORF) within the mRNA of the centromere protein CENP-R. This altORF peptide localizes specifically to the cytoplasmic surface of the Golgi apparatus. Through mutational analysis, we identify a minimal 10-amino acid sequence and a critical cysteine residue that are necessary and sufficient for Golgi localization. Pharmacological perturbations suggest that this peptide undergoes lipid modification to promote its localization. Together, our work defines a minimal sequence that is sufficient for Golgi targeting and provide a valuable Golgi marker for live cell imaging.


Figures

FIGURE 1:
FIGURE 1:
A CENP-R altORF robustly localizes to the Golgi. (A) Visual representation of altORF translation from the canonical CENP-R transcript. The altORF begins upstream of the canonical ATG and has a different reading from the canonical protein. (B) Multiple sequence alignment of the altORF peptide sequence across New and Old World primates. (C) Localization of CENP-R altORF during interphase and mitosis as compared with the canonical CENP-R after transfection of GFP tagged constructs in HeLa cells. The CENP-R altORF shows localization distinct from that of canonical CENP-R, which localizes to centromeres. GFP boost was used to amplify GFP signal and kinetochores are stained with ACA. Images in this figure are deconvolved and max projected. Scale bars, 10 μm. (D) The CENP-R altORF colocalizes with the Golgi markers GM130 (cis-Golgi) and GGA2 (trans-Golgi), but not with the ER marker anti-KDEL. Representative images of fixed cells stably expressing altORF peptide are shown. Cells were imaged using high-resolution Airyscan confocal microscopy. Images represent a single Z position. Inset represents a 5 μm × 5 μm area. (E) The CENP-R altORF localizes to the Golgi in a variety of cell lines, including mouse fibroblast 3T3 cells. The CENP-R altORF was transiently transfected into each cell lines and assessed for colocalization with Golgi marker GM130. The GM130 antibody does not recognize the mouse protein so it was not included in the 3T3 panel. Images are deconvolved and max projected. Scale bar, 10 μm.
FIGURE 2:
FIGURE 2:
The CENP-R altORF marks the Golgi throughout dynamic processes. (A) Images from a time-lapse sequence in a cell line stably expressing the CENP-R altORF. DNA was stained using SiR-DNA. Cells were imaged for 12 h at 5-min intervals at 37°C in CO2-independent media. The time-lapse video was deconvolved. Scale bar, 10 μm. (B) Images from time-lapse sequence of a cell line stably expressing the CENP-R altORF following treatment with 0.2 μM Brefeldin A. DNA was stained with SiR-DNA. Cells were imaged every 5 min for 4 h immediately after the addition of Brefeldin A. Selected frames show the breakdown of the Golgi and the association of the altORF to the Golgi throughout this process. Scale bar, 10 μm.
FIGURE 3:
FIGURE 3:
CENP-R altORF associates to the cytoplasmic surface of the Golgi. (A)Localization of the GFP-CENPR altORF peptide stably expressed in HeLa cells in the presence of transfected mCherry-TEV protease construct. Localization to the Golgi was determined based on colocalization with Golgi marker GM130. Images are deconvolved and maximally projected. Scale bar, 10 μm. (B) Hydrophobicity plot of the CENPR altORF peptide sequence. Sequence was run through the Phobius program (https://phobius.sbc.su.se/poly.html). Probability values assigned to amino acids to determine transmembrane topology are plotted. (C) Western showing the presence of GFP-altORF or GM130 following lysis with buffers of various amounts of the detergent NP40. Asynchronous HeLa cells stably expressing the altORF peptide were used in this experiment. Following cell lysis, lysates were centrifuged to pellet the cellular debris. From this the supernatant was taken and labeled as the “Sup.” sample and the pellet was resuspended in loading sample buffer and used as the “Pellet” sample.
FIGURE 4:
FIGURE 4:
Cysteine residues are required for altORF localization to the Golgi. (A) Figures representing the truncation mutants generated and tested for localization. (B) Localization of the truncated altORF constructs transfected in HeLa cells. Localization to the Golgi was determined based on colocalization with Golgi marker GM130. Cells were fixed and imaged 48 h post transfection. Images are deconvolved and max projected. Scale bar, 10 μm. (C) Localization of the dual cysteine mutant altORF constructs transfected in HeLa cells. Localization to the Golgi was determined based on colocalization with Golgi marker GM130. Cells were fixed and imaged 48 h post transfection. Images are deconvolved and max projected. Scale bar is 10 μm. (D) Localization of the altORF peptide following treatment with 2-bromopalmitate. Cells were treated with either DMSO or 10 μM 2-bromopalmitate for 3 h before being fixed. Images are deconvolved. Scale bar, 10 μm. GFP signal is graphed as a ratio of GM130 fluorescence per cell. Quantification of GFP signal in DMSO and 2-BP treated cells with N = 34 and N = 22, respectively. The Golgi area was determined blindly using GM130 as the guide; the GFP fluorescence intensity was then recorded. Background signal was subtracted from fluorescence intensity. Background signal was determined by measuring the fluorescence intensity of a region of the same area as the Golgi selected from an area of the image neighboring the selection. Error bars represent the mean and SD. Statistical significance **** p < 0.0001 as determined by Mann–Whitney test.
FIGURE 5:
FIGURE 5:
FCF motif not sufficient to confer Golgi localization. (A) Representative images of the FCF mutant localization in HeLa cells. Cells were fixed and imaged 48 h posttransfection. Images are deconvolved and max projected. Scale bar is 10 μm. (B) Localization of GFP-tagged altORF mutant testing sufficiency of FCF motif. Constructs were transiently transfected in HeLa cells and expressed for 48 h before fixation. Images are deconvolved and max projected. Scale bar, 10 μm. (C) Localization of GFP-tagged Sabaeus altORF and motif mutant testing sufficiency of FCF motif. Constructs were transiently transfected in HeLa cells and expressed for 48 h before fixation. Images are deconvolved and max projected. Scale bar, 10 μm. (D) Representative images of the alanine mutants of the 10–amino acid peptide sequence. Constructs were transiently expressed in HeLa cells for 48 h before fixation. Images were deconvolved and max projected. Scale bar, 10 μm. (E) Table summarizing the mutants that failed to localize and the proposed consensus sequence required for Golgi localization. In the consensus sequence the () brackets represent the amino acids that can be substituted into that position and the {} brackets represent amino acids that cannot be included within a given position. The φ represents amino acids that are hydrophobic.

References

    1. Aicart-Ramos C, Valero RA, Rodriguez-Crespo I (2011). Protein palmitoylation and subcellular trafficking. Biochim Biophys Acta 1808, 2981–2994. - PubMed
    1. Banfield DK (2011). Mechanisms of protein retention in the Golgi. Cold Spring Harb Perspect Biol 3, a005264. - PMC - PubMed
    1. Bankaitis VA, Garcia-Mata R, Mousley CJ (2012). Golgi membrane dynamics and lipid metabolism. Curr Biol 22, R414–R424. - PMC - PubMed
    1. Chacinska A, Koehler CM, Milenkovic D, Lithgow T, Pfanner N (2009). Importing mitochondrial proteins: machineries and mechanisms. Cell 138, 628–644. - PMC - PubMed
    1. Cheeseman IM, Desai A (2005). A combined approach for the localization and tandem affinity purification of protein complexes from metazoans. Sci STKE 2005, pl1. - PubMed

Publication types