. 2023 May 1;77(5):1654-1669.
doi: 10.1002/hep.32705. Epub 2023 Apr 17.

Enhanced mitochondrial activity reshapes a gut microbiota profile that delays NASH progression

Affiliations

Enhanced mitochondrial activity reshapes a gut microbiota profile that delays NASH progression

María Juárez-Fernández et al. Hepatology. .

Abstract

Background and aims: Recent studies suggest that mitochondrial dysfunction promotes progression to NASH by aggravating the gut-liver status. However, the underlying mechanism remains unclear. Herein, we hypothesized that enhanced mitochondrial activity might reshape a specific microbiota signature that, when transferred to germ-free (GF) mice, could delay NASH progression.

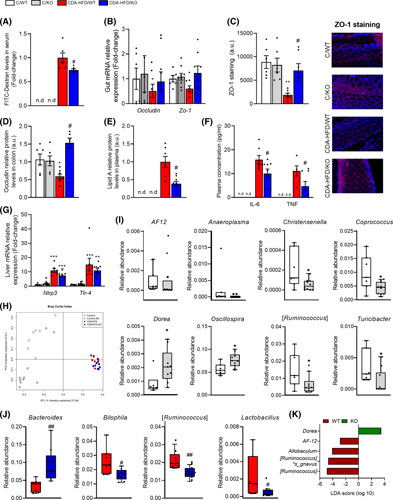
Approach and results: Wild-type and methylation-controlled J protein knockout (MCJ-KO) mice were fed for 6 weeks with either control or a choline-deficient, L-amino acid-defined, high-fat diet (CDA-HFD). One mouse of each group acted as a donor of cecal microbiota to GF mice, who also underwent the CDA-HFD model for 3 weeks. Hepatic injury, intestinal barrier, gut microbiome, and the associated fecal metabolome were then studied. Following 6 weeks of CDA-HFD, the absence of methylation-controlled J protein, an inhibitor of mitochondrial complex I activity, reduced hepatic injury and improved gut-liver axis in an aggressive NASH dietary model. This effect was transferred to GF mice through cecal microbiota transplantation. We suggest that the specific microbiota profile of MCJ-KO, characterized by an increase in the fecal relative abundance of Dorea and Oscillospira genera and a reduction in AF12 , Allboaculum , and [ Ruminococcus ], exerted protective actions through enhancing short-chain fatty acids, nicotinamide adenine dinucleotide (NAD + ) metabolism, and sirtuin activity, subsequently increasing fatty acid oxidation in GF mice. Importantly, we identified Dorea genus as one of the main modulators of this microbiota-dependent protective phenotype.

Conclusions: Overall, we provide evidence for the relevance of mitochondria-microbiota interplay during NASH and that targeting it could be a valuable therapeutic approach.


Conflict of interest statement

Dr. Rincón is the Scientific Founder of Mitotherapeutix LLC, and Dr. Martínez‐Chantar advises Mitotherapeutix LLC.

María Juárez-Fernández and Naroa Goikoetxea-Usandizaga joint first authors.

Figures

None
Graphical abstract
FIGURE 1
FIGURE 1
Effect of methylation‐controlled J protein knockout (MCJ‐KO) genotype on gut‐liver axis and microbiota composition. (A) Fluorescein isothiocyanate (FITC)‐dextran serum levels. (B) Occludin and Zonula occludens 1 (Zo‐1) gut messenger RNA (mRNA) relative expression. (C) Quantification and representative ZO‐1–stained ileum sections. (D) Densitometry analysis of Occludin levels in the ileum expressed as relativized to control‐fed WT group (C/WT). (E) Densitometry analysis of Lipid A plasma levels expressed as relativized to choline‐deficient, L‐amino acid–defined, high‐fat diet (CDA‐HFD)/wild type (WT). (F) IL‐6 and TNF plasma concentration. (G) NOD, LRR‐, and pyrin domain‐containing protein 3 (Nlrp3) and Toll‐like receptor‐4 (Tlr‐4) hepatic mRNA relative expression. (H) Principal Coordinates Analysis plot based on Bray–Curtis' dissimilarity index at operational taxonomic unit (OTU) level. Differences in the relative abundance at genus level between WT and MCJ‐KO mice fed with control (I) and CDA‐HFD (J). (K) Linear discriminant analysis effect size at genus and species level of WT and MCJ‐KO mice (threshold = 2.0 and p < 0.05). At least n = 6 were used in each experimental group. *p < 0.05, **p < 0.01, ***p < 0.001 versus C/WT; # p < 0.05, ## p < 0.01 versus CDA‐HFD/WT
FIGURE 2
FIGURE 2
NAFLD‐associated features development on transplanted germ‐free mice from selected donors. (A) Hematoxylin and eosin–stained liver sections (×100) and NAFLD activity score (calculated from individual scores for steatosis, lobular inflammation, and ballooning). (B) Intrahepatic triglyceride content. (C) Alanine aminotransferase (ALT) and aspartate aminotransferase (AST) plasmatic levels. (D) Liver messenger RNA (mRNA) relative expression of inflammatory C‐C chemokine receptor 5 (Ccr5), Il‐1β, Il‐6, and Tnf. (E) Quantification and representative alpha‐smooth muscle actin (α‐SMA)–stained liver sections. (F) Liver mRNA relative expression of fibrosis markers collagen type 1 alpha 1 chain (Col1a1), matrix metallopeptidase 9 (Mmp9), and transforming growth factor beta (Tgf‐β). At least n = 6 were used in each experimental group. *p < 0.05, **p < 0.01, ***p < 0.001 versus wild‐type (WT) control diet–fed donor (dC/WT) (control diet); # p < 0.05, ## p < 0.01, ### p < 0.001 versus dC/WT (choline‐deficient, L‐amino acid–defined, high‐fat diet [CDA‐HFD]); a p < 0.05, aa p < 0.01, aaa p < 0.001 versus WT CDA‐HFD–fed donor (dCDA‐HFD/WT) (CDA‐HFD)
FIGURE 3
FIGURE 3
Effect of methylation‐controlled J protein knockout (MCJ‐KO) genotype transplantation in choline‐deficient, L‐amino acid–defined, high‐fat diet (CDA‐HFD)–fed germ‐free (GF) mice on gut‐liver axis and gut microbiota composition. (A) Hematoxylin and eosin–stained gut sections (×100), histological evaluation. (B) Claudin‐1 and Zonula occludens 1 (Zo‐1) gut messenger RNA (mRNA) relative expression. (C) NOD, LRR‐, and pyrin domain‐containing protein 3 (Nlrp3) and Toll‐like receptor‐4 (Tlr‐4) hepatic mRNA relative expression. (D) Venn diagrams at operational taxonomic unit (OTU) level (relative abundance >0.01%) from each donor to each recipient group of GF mice. (E) Principal coordinates analysis plot derived from Bray–Curtis dissimilarity index at OTU level of CDA‐HFD–fed GF mice. Differences in the relative abundance at genus level in A Model (F) and in CDA‐HFD–fed germ‐free mice (B Model) (G). At least n = 7 were used in each experimental group. *p < 0.05, **p < 0.01, ***p < 0.001 versus wild‐type (WT) control diet–fed donor (dC/WT) (CDA‐HFD); # p < 0.05, ### p < 0.001 versus WT CDA‐HFD–fed donor (dCDA‐HFD/WT) (CDA‐HFD)
FIGURE 4
FIGURE 4
Hepatic fatty acid oxidation and nicotinamide adenine dinucleotide (NAD+) production in both A and B Models. A Model: (A) Liver messenger RNA (mRNA) relative expression of AcadI and fatty acid transport protein 2 (Fatp2). (B) Liver mRNA relative expression of NAD+ synthesis enzymes nicotinamide phosphoribosyltransferase (Nampt) and Sirtuin (Sirt) 1. (C) Hepatic levels of total NAD (NADt), reduced nicotinamide adenine dinucleotide (NADH), and NAD+/NADH ratio. B Model: (D) Liver mRNA relative expression of NAD+ synthesis enzymes Nampt and Sirt1. (E) Hepatic levels of NADt, NADH, and NAD+/NADH ratio. (F) Fatty acid oxidation assay. (G) Liver mRNA relative expression of AcadI and Fatp2. At least n = 6 were used in each experimental group. *p < 0.05; **p < 0.01 versus choline‐deficient, L‐amino acid–defined, high‐fat diet (CDA‐HFD)/wild type (WT). Pearson's correlation coefficients, p values, and linear relationships between the relative abundance of Dorea and (H) the hepatic NAD+/NADH ratio and (I) the relative mRNA expression of Sirt1 in A Model (black line and squares). (J) Pearson's correlation coefficients, p values, and linear relationships between the relative abundance of Dorea and the hepatic relative mRNA expression of Nampt and Sirt1 in B Model (blue line and dots)
FIGURE 5
FIGURE 5
Fecal metabolomic analysis of A Model. (A) Principal component analysis of metabolite profiles. PC1 and PC2 values are shown in parentheses. Shaded areas denote sample clusters according to diet and genotype. (B) Differences in the metabolites between wild‐type (WT) and methylation‐controlled J protein knockout (MCJ‐KO) mice independently of the diet. (C) Differences in the metabolites between WT and MCJ‐KO mice fed with control diet. (D) Differences in the metabolites between WT and MCJ‐KO mice fed with choline‐deficient, L‐amino acid–defined, high‐fat diet (CDA‐HFD). *p < 0.05. (E) Fecal concentration of the main short‐chain fatty acids: acetate, butyrate, propionate, and isobutyrate. (F) Pearson's correlation coefficients, p values, and linear relationships of Dorea relative abundance and the peak area of adenosine, betaine, and riboflavin. At least n = 5 were used in each experimental group
FIGURE 6
FIGURE 6
Intestinal nicotinamide adenine dinucleotide (NAD+) metabolism in both B and A Models. B Model, gut: (A) Relative messenger RNA (mRNA) expression of NAD+ synthesis enzymes nicotinamide phosphoribosyltransferase (Nampt) and Sirtuin (Sirt) 1. (B) Levels of total NAD (NADt), reduced nicotinamide adenine dinucleotide (NADH) and NAD+/NADH ratio. (C,D) Pearson's correlation coefficient, p value and linear relationship of the relative abundance of Dorea and (C) total NAD and (D) relative mRNA expression of Sirt1 in animals fed with choline‐deficient, L‐amino acid–defined, high‐fat diet (CDA‐HFD) (blue line and dots). A Model, gut: (E) mRNA relative expression of NAD+ synthesis enzymes Nampt and Sirt1. (F) Levels of NADt, NADH, and NAD+/NADH ratio. At least n = 6 were used in each experimental group. *p < 0.05; **p < 0.01, ***p < 0.001 versus CDA‐HFD/wild type (WT). (G) Pearson's correlation coefficient, p value, and linear relationship of the relative abundance of Dorea and the relative mRNA expression of Sirt1 in animals fed with CDA‐HFD (black line and squares)

References

    1. Ballard JWO, Towarnicki SG. Mitochondria, the gut microbiome and ROS. Cell Signal. 2020;75:109737. - PubMed
    1. Ye JZ, Li YT, Wu WR, Shi D, Fang DQ, Yang LY, et al. . Dynamic alterations in the gut microbiota and metabolome during the development of methionine‐choline‐deficient diet‐induced nonalcoholic steatohepatitis. World J Gastroenterol. 2018;24:2468–81. - PMC - PubMed
    1. Boursier J, Mueller O, Barret M, Machado M, Fizanne L, Araujo‐Perez F, et al. . The severity of nonalcoholic fatty liver disease is associated with gut dysbiosis and shift in the metabolic function of the gut microbiota. Hepatology. 2016;63:764–75. - PMC - PubMed
    1. Clark A, Mach N. The crosstalk between the gut microbiota and mitochondria during exercise. Front Physiol. 2017;8:319. - PMC - PubMed
    1. Saint‐Georges‐Chaumet Y, Edeas M. Microbiota‐mitochondria inter‐talk: consequence for microbiota‐host interaction. Pathog Dis. 2016;74:ftv096. - PubMed

Publication types

MeSH terms