. 2022 Aug 5;8(31):eabp9908.
doi: 10.1126/sciadv.abp9908. Epub 2022 Aug 3.

The global distribution of known and undiscovered ant biodiversity

Affiliations

The global distribution of known and undiscovered ant biodiversity

Jamie M Kass et al. Sci Adv. .

Abstract

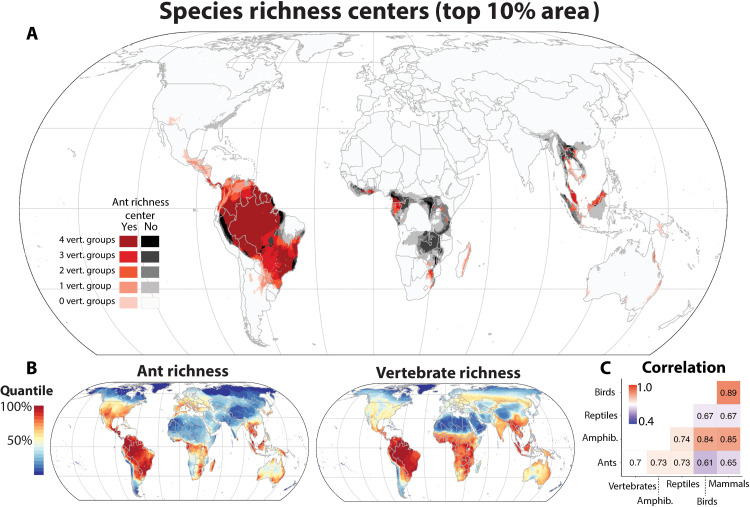
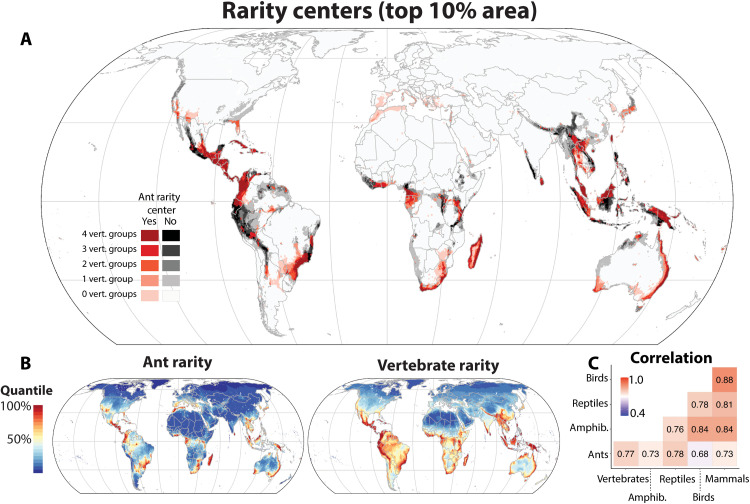
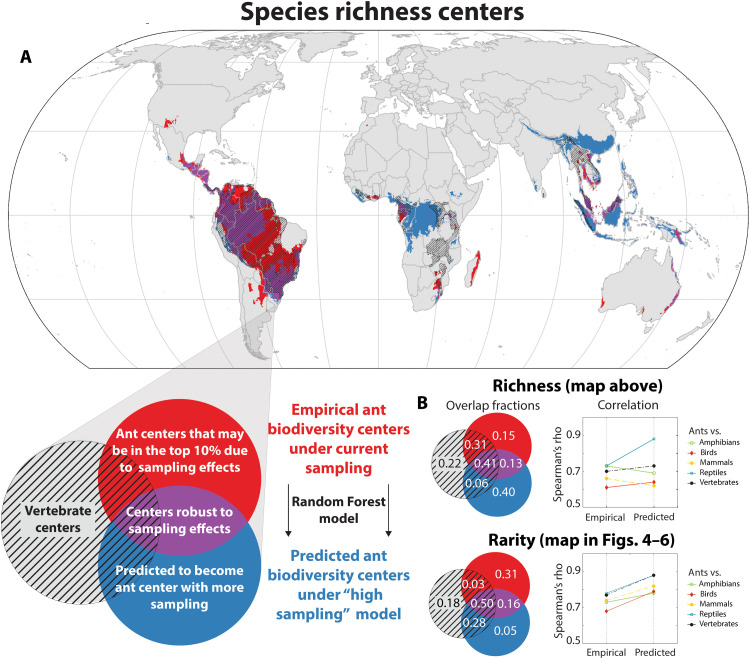
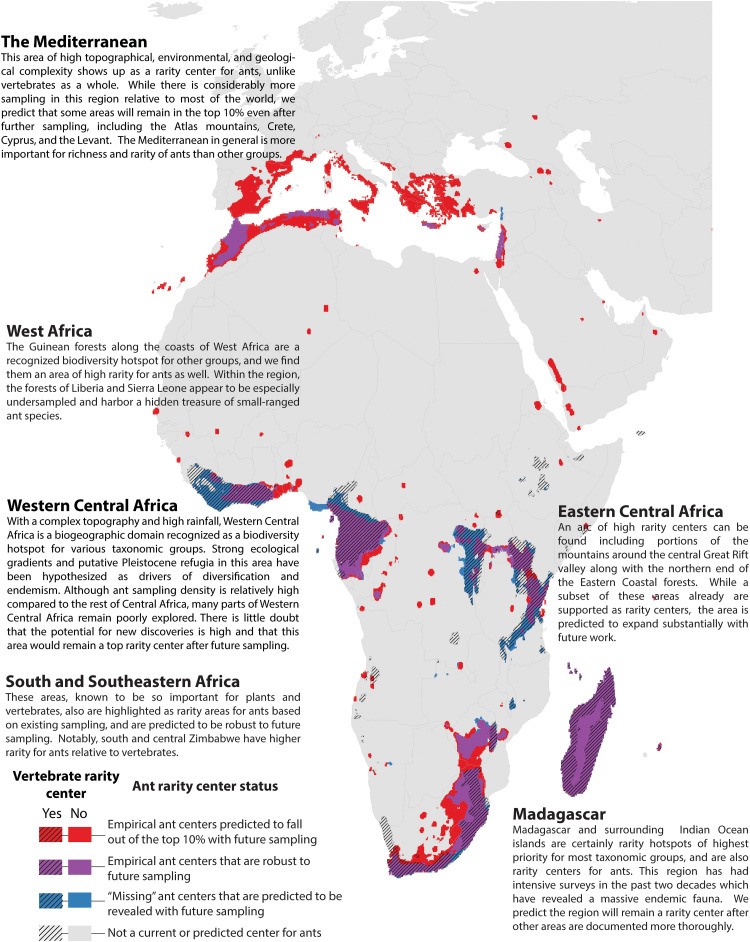
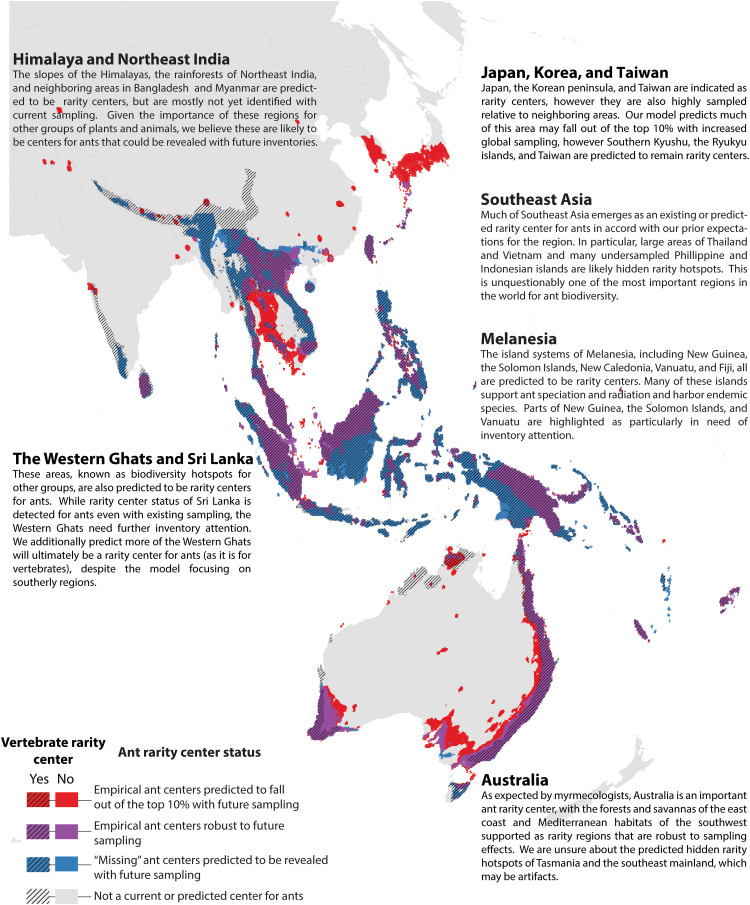
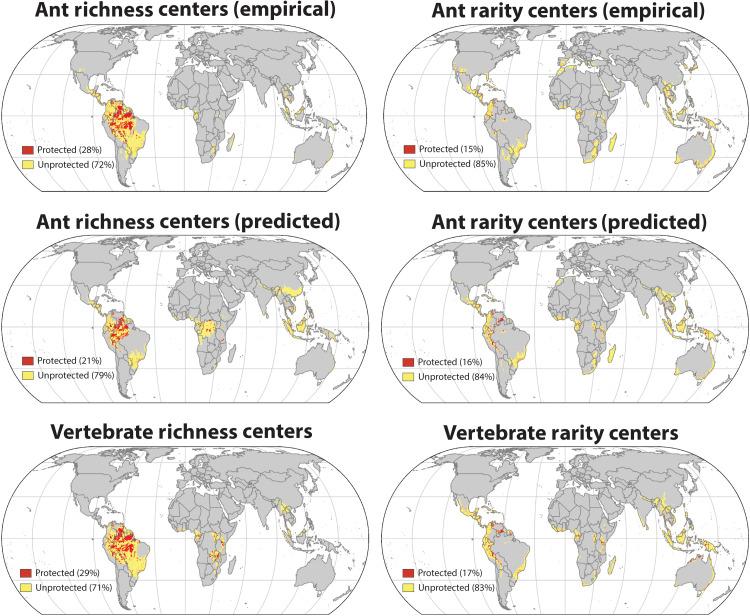
Invertebrates constitute the majority of animal species and are critical for ecosystem functioning and services. Nonetheless, global invertebrate biodiversity patterns and their congruences with vertebrates remain largely unknown. We resolve the first high-resolution (~20-km) global diversity map for a major invertebrate clade, ants, using biodiversity informatics, range modeling, and machine learning to synthesize existing knowledge and predict the distribution of undiscovered diversity. We find that ants and different vertebrate groups have distinct features in their patterns of richness and rarity, underscoring the need to consider a diversity of taxa in conservation. However, despite their phylogenetic and physiological divergence, ant distributions are not highly anomalous relative to variation among vertebrate clades. Furthermore, our models predict that rarity centers largely overlap (78%), suggesting that general forces shape endemism patterns across taxa. This raises confidence that conservation of areas important for small-ranged vertebrates will benefit invertebrates while providing a "treasure map" to guide future discovery.


Figures

Fig. 1.
Fig. 1.. Global ant species richness patterns in comparison with terrestrial vertebrates.
(A) Species richness centers (top 10% of area) for amphibians, birds, mammals, reptiles, and ants, indicating areas of congruence and incongruence of biodiversity centers across taxa. (B) Species richness maps based on stacking individual species range estimates for ants and vertebrates. (C) Spearman’s correlation matrix for grid cell–level species richness across taxa.
Fig. 2.
Fig. 2.. Global patterns of ant rarity and comparison with terrestrial vertebrates.
(A) The concordance of different rarity (i.e., rarity-weighted richness, a metric indicating a concentration of small-ranged species) centers (top 10% of area) for amphibians, birds, mammals, reptiles, and ants. (B) Continuous rarity maps for ants and vertebrates. (C) Spearman’s correlation matrix for grid cell–level rarity across taxa.
Fig. 3.
Fig. 3.. Machine learning predicts how increased sampling could change our understanding of ant richness and rarity centers.
Random Forest models were trained to predict ant species richness and rarity values as a function of climate (7 vars.), topography, biogeographic realm, vertebrate biodiversity, and sampling density. We then used the models to predict (A) richness and rarity values under a “universal high sampling” scenario, revealing which areas may drop out of the top 10% with increased global sampling (red), which are robust to sampling (purple), and which centers are predicted to enter the top 10% with increased sampling (blue). The latter represents a treasure map indicating areas that should be prioritized for future sampling. The top 10% areas for vertebrates are indicated by hatched regions. (B) Overlap fractions for empirical and projected center designations for richness and rarity, and Spearman’s correlations continuous richness and rarity values.
Fig. 4.
Fig. 4.. Empirical and predicted rarity centers of the Western Hemisphere.
Rarity centers based on current knowledge and projected by a Random Forest model under a “universal high sampling” scenario. See Fig. 3 for more explanation.
Fig. 5.
Fig. 5.. Empirical and predicted rarity centers of Europe, Africa, and West Asia.
Rarity centers based on current knowledge and projected by a Random Forest model under a “universal high sampling” scenario. See Fig. 3 for more explanation.
Fig. 6.
Fig. 6.. Empirical and predicted rarity centers of Eastern Asia and Oceania.
Rarity centers based on current knowledge and projected by a Random Forest model under a “universal high sampling” scenario. See Fig. 3 for more explanation.
Fig. 7.
Fig. 7.. Global protection status of richness and rarity centers.
Richness and rarity centers (top 10% of area) are overlaid with protected areas using data retrieved from the World Database of Protected Areas (protectedplanet.net) and processed. Biodiversity centers for ants based on current sampling (top row), predicted ant centers under universal high sampling (second row), and vertebrate centers (bottom row) are presented.

References

    1. Wilson E. O., The little things that run the world (the importance and conservation of invertebrates). Conserv Biol. 1, 344–346 (1987).
    1. W. W. Weisser, E. Siemann, The various effects of insects on ecosystem functioning, in Insects and Ecosystem Function, W. W. Weisser, E. Siemann, Eds. (Springer, 2008), vol. 173.
    1. McCary M. A., Schmitz O. J., Invertebrate functional traits and terrestrial nutrient cycling: Insights from a global meta-analysis. J. Anim. Ecol. 90, 1714–1726 (2021). - PubMed
    1. Wagner D. L., Grames E. M., Forister M. L., Berenbaum M. R., Stopak D., Insect decline in the Anthropocene: Death by a thousand cuts. Proc. Natl. Acad. Sci. U.S.A. 118, e2023989118 (2021). - PMC - PubMed
    1. Clark J. A., May R. M., Taxonomic bias in conservation research. Science 297, 191–192 (2002). - PubMed