. 2022 Aug 5;8(31):eabn3986.
doi: 10.1126/sciadv.abn3986. Epub 2022 Aug 3.

A SOX2-engineered epigenetic silencer factor represses the glioblastoma genetic program and restrains tumor development

Affiliations

A SOX2-engineered epigenetic silencer factor represses the glioblastoma genetic program and restrains tumor development

Valerio Benedetti et al. Sci Adv. .

Abstract

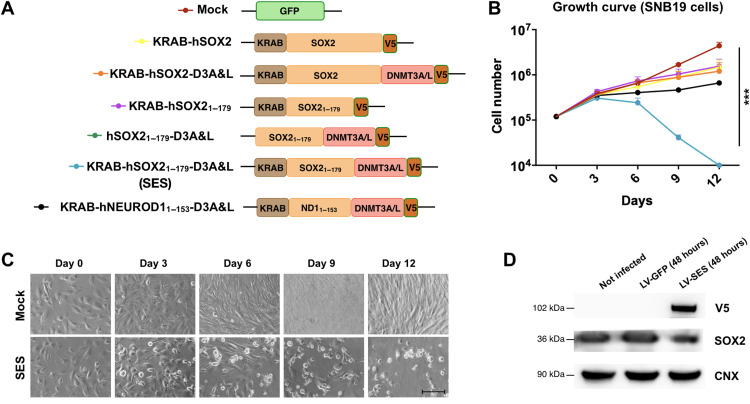
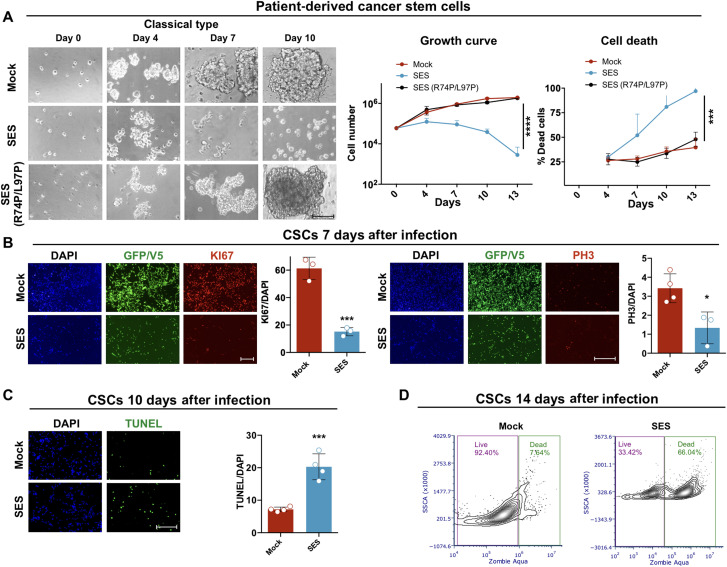
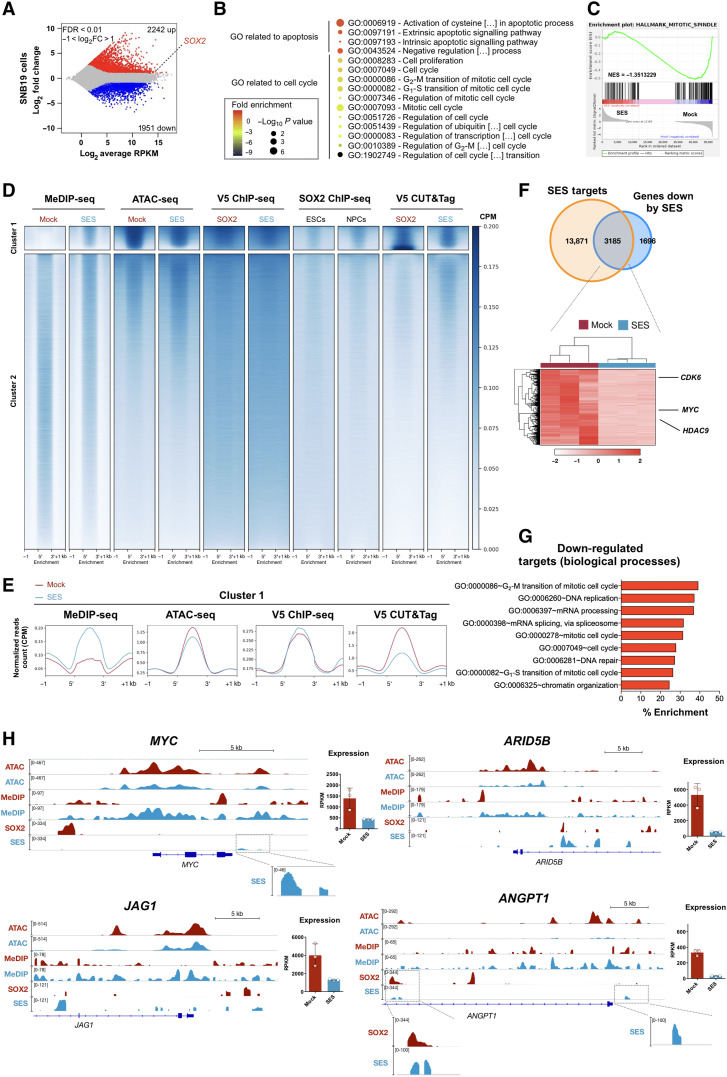
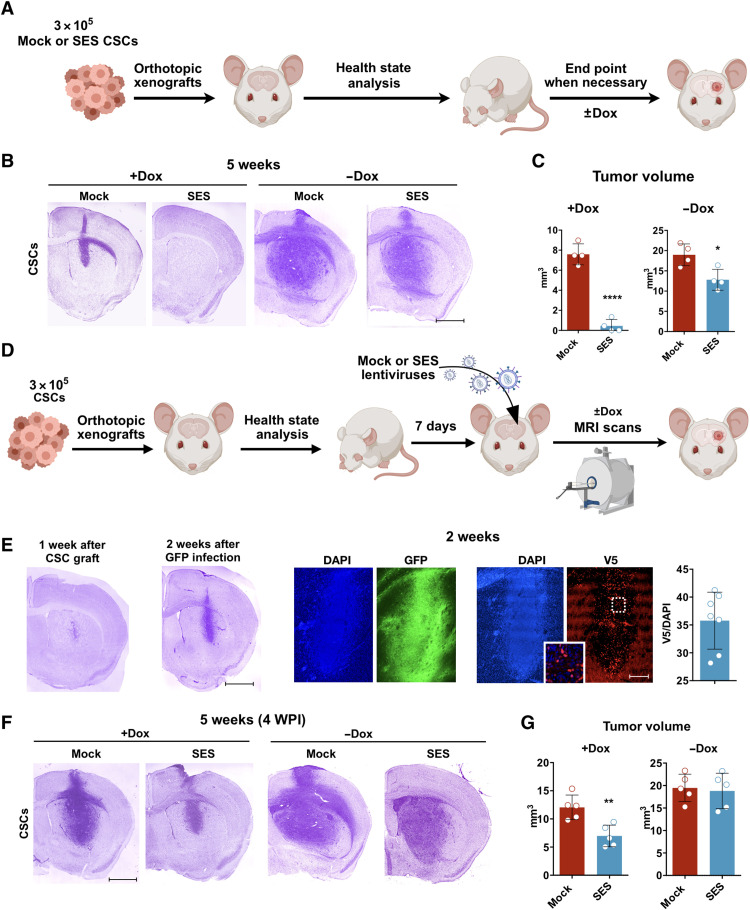
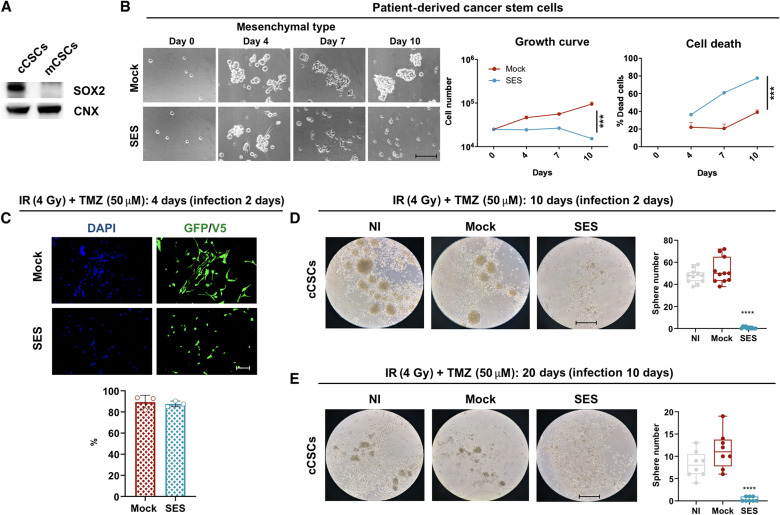
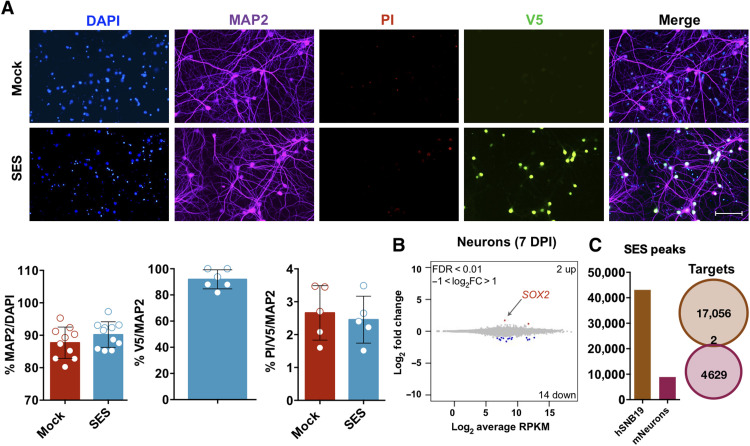
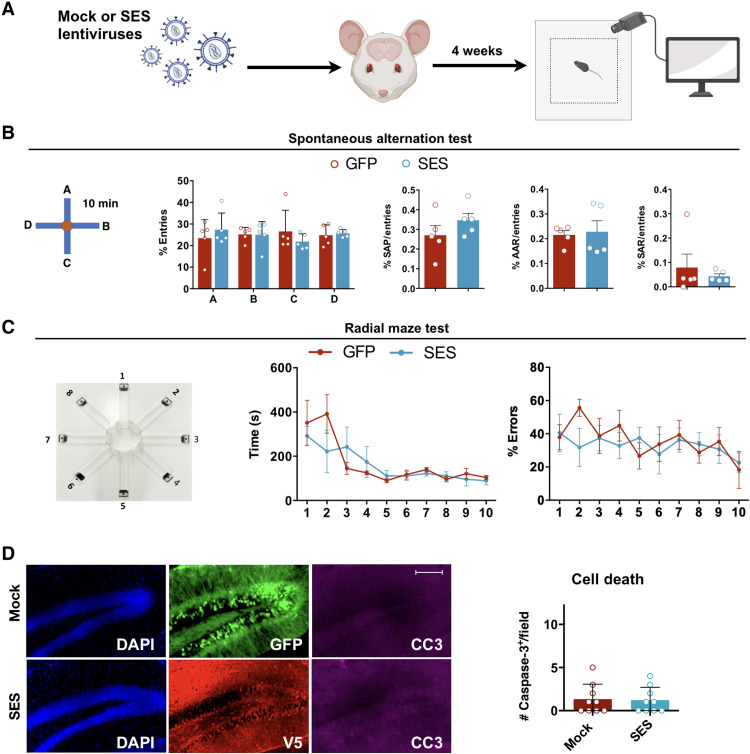
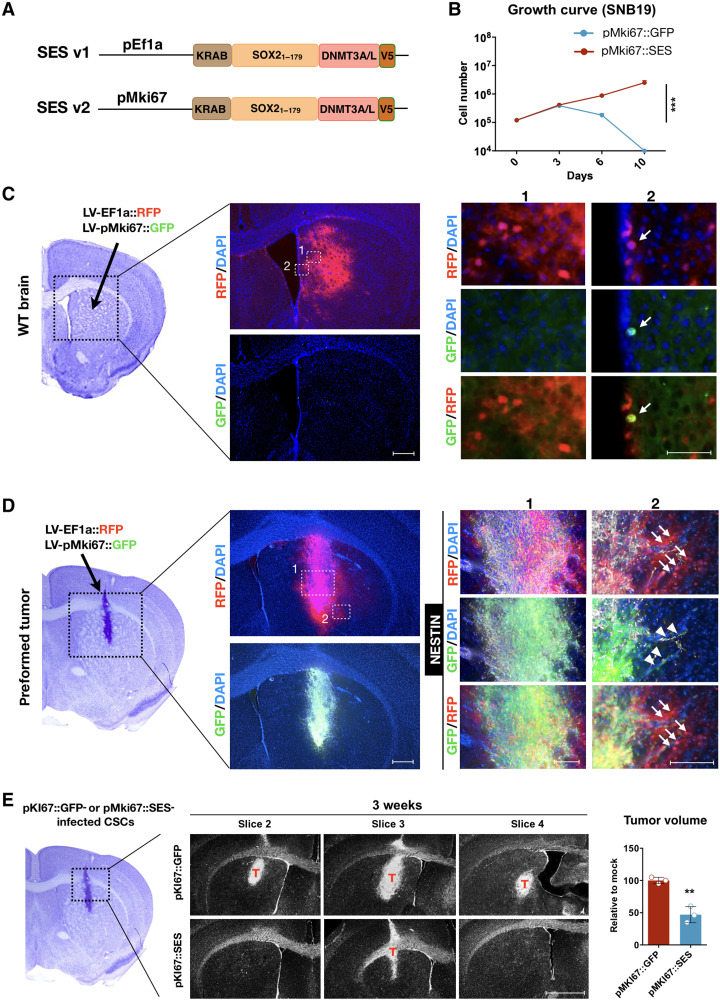
Current therapies remain unsatisfactory in preventing the recurrence of glioblastoma multiforme (GBM), which leads to poor patient survival. By rational engineering of the transcription factor SOX2, a key promoter of GBM malignancy, together with the Kruppel-associated box and DNA methyltransferase3A/L catalytic domains, we generated a synthetic repressor named SOX2 epigenetic silencer (SES), which induces the transcriptional silencing of its original targets. By doing so, SES kills both glioma cell lines and patient-derived cancer stem cells in vitro and in vivo. SES expression, through local viral delivery in mouse xenografts, induces strong regression of human tumors and survival rescue. Conversely, SES is not harmful to neurons and glia, also thanks to a minimal promoter that restricts its expression in mitotically active cells, rarely present in the brain parenchyma. Collectively, SES produces a significant silencing of a large fraction of the SOX2 transcriptional network, achieving high levels of efficacy in repressing aggressive brain tumors.


Figures

Fig. 1.
Fig. 1.. Generation and in vitro efficacy of the SOX2 epigenetic silencer.
(A) Constructs were generated on the basis of human SOX2 TF and the epigenetic domain KRAB, DNMT3A (3A), and DNMT3L (3L), and V5 was added as tag. A factor based on human NEUROD1 TF and the epigenetic domain KRAB, DNMT3A (3A), DNMT3L (3L), and V5 were added as additional control. (B) Growth curve of SNB19 cells infected with the indicated constructs indicates that SES is able to kill the cells after 12 days in culture. ***P = 0.001; statistically compared with two-way analysis of variance (ANOVA). n = 3. (C) Microphotographs of the cells at the indicated time points from the infection with either mock-expressing (GFP, green fluorescent protein) or SES-expressing lentiviruses. (D) Western blot (WB) for V5, SOX2, and calnexin (CNX) (as loading control) in SNB19 cells either not infected or infected with lentivirus carrying GFP or SES. Scale bar, 100 μm (C).
Fig. 2.
Fig. 2.. SES efficacy in patient-derived CSCs.
(A) Microphotographs, growth curve, and percentage of dead cells (trypan blue automatic counting) of patient-derived CSCs of classical GBM subtype infected with either GFP (mock), SES, or SES (R74P/L97P). Growth curve: ****P < 0.0001; dead cells: ***P = 0.007; statistically compared with two-way ANOVA. n = 3. (B) Left: Immunocytochemistry for KI67 mitotic marker and for GFP and V5 tag, counterstained with 4′,6-diamidino-2-phenylindole (DAPI) in CSCs 7 days after GFP or SES viral infection. Quantification as percentage of KI67+ cells on the total number of DAPI nuclei (means ± SEM); ***P = 0.0008; statistically compared using unpaired t test. n = 3. Right: Immunocytochemistry for PH3 (marker for mitoses) and for GFP and V5 tag, counterstained with DAPI in CSCs 7 days after GFP or SES infection. Quantification as percentage of PH3+ cells on the total number of DAPI nuclei (means ± SEM); *P = 0.0183; statistically compared using unpaired t test. n = 3. (C) Terminal deoxynucleotidyl transferase–mediated deoxyuridine triphosphate nick end labeling (TUNEL) assay counterstained with DAPI in CSCs 10 days after GFP or SES infection. Quantification as percentage of KI67+ cells on the total number of DAPI nuclei (means ± SEM); ***P = 0.0006; statistically compared using unpaired t test. n = 3. (D) Fluorescence-activated cell sorting analysis using the Zombie Aqua dye staining for assessing cell death in both mock- and SES-infected CSCs after 14 days from the infection. Gating strategy was based on unstained cells. Scale bars, 100 μm (B left), 300 μm (A), and 200 μm (B right and C). SSCA, side scatter area.
Fig. 3.
Fig. 3.. SES induces extensive transcriptomic and epigenomic changes.
(A) SES causes massive gene deregulation in SNB19 cells 2 days after the infection, as assessed by RNA sequencing (RNA-seq). FDR, false discovery rate; FC, fold change; RPKM, reads per kilobase of transcript per million. (B) Gene Ontology (GO) analysis indicates that genes associated with apoptosis (up-regulation) and cell cycle regulation (down-regulation) are impaired by SES expression. (C) Enrichment plots from gene set enrichment analysis for Hallmark Mitotic spindle (see also table S2). NES, normalized enrichment score. (D) Heatmaps showing relative enrichment for MeDIP-seq, ATAC-seq, ChIP-seq (V5 tag for SOX2 and SES overexpression), and CUT&Tag (V5 tag for SOX2 and SES overexpression) in both control and SES conditions as well as data from publicly available ChiP-seq for endogenous SOX2 in ESCs and NPCs (GSE69479) in all the called peaks (n = 1,048,756 unique rows). Enrichments show as color scale in peak bodies of ±1 kb. (E) Density plots summarizing the mean of the signals for the indicate dataset in the regions belonging cluster 1 in (D). (F) Top: Venn diagram illustrating the overlap between genes with regions of cluster 1 in (D) (SES targets) and genes down-regulated (FDR < 0.1; FC < 0). Bottom: Heatmaps with genes both direct targets and down-regulated by SES (3185 rows). (G) GO analysis indicates that genes associated with chromatin organization, mRNA processing, and cell cycle regulation are enriched among genes that are both SES targets and down-regulated by its expression. (H) IGV (Integrative Genomics Viewer) snapshots of SES targets showing both ATAC-seq, MeDIP-seq, and V5–ChIP-seq tracks in both mock-infected (red tracks) and SES-infected (blue tracks) cells. Strong chromatin remodeling is observed nearby the SOX2/SES binding sites. Expression data (RPKM from RNA-seq experiments) are also shown on the right.
Fig. 4.
Fig. 4.. SES treatment inhibits orthotopic xenograft growth in immunodeficient mice.
(A) Schematic representation of the orthotopic xenograft by brain injection (striatum) of 300,000 CSCs (classical type), preinfected with either mock (Tta and TetOn-GFP) or SES (rtTA and TetOn-SES) in NSG mice (±dox). (B) Nissl staining of representative section of the indicated models 5 weeks after the transplant. (C) Quantification of tumor volume (four animals per group, means ± SEM): +dox: ****P < 0.0001; −dox: *P = 0.0164; statistically compared with unpaired t test. n = 4 from four tumors. (D) The orthotopic xenograft is generated by injection of 300,000 undifferentiated CSCs (classic type) in the striatum of NSG mice; after 7 days, the animals are reoperated to inject lentivirus carrying either mock (rtTA and TetON-GFP) or SES (rtTA and TetOn-GFP) and evaluated longitudinally by magnetic resonance imaging (MRI) or by histological staining at indicated time points. (E) Evaluation of tumor infection after 2 weeks from the LV injection by Nissl staining (left) and immunohistochemistry on coronal sections (50 μm of thickness) for GFP/V5 counterstained with DAPI. Quantification of the V5+ cells on the total number of DAPI nuclei in the SES-treated tumors is also shown (four tumors). n = 7 from four tumors. (F) Nissl staining of representative sections of the indicated models 5 weeks after the transplant and 4 weeks after the LV injection. (G) Quantification of tumor volume (five animals per group, means ± SEM): +dox: **P = 0.0046; −dox: P = 0.7731; statistically compared with unpaired t test. n = 5 from five tumors. Scale bars, 1 mm (B; E, left; and F) and 300 μm (E, right). WPI, weeks post infection.
Fig. 5.
Fig. 5.. SES is active in mesenchymal CSCs.
(A) WB for SOX2 and CNX (as loading control) in classic CSCs (cCSCs) and mesenchymal CSCs (mCSCs) confirm that our line of mCSCs is SOX2. (B) Microphotographs, growth curve, and percentage of death cells (trypan blue automatic counting) of mCSCs. Growth curve: ***P = 0.0004; death cells: ***P = 0.006; statistically compared with two-way ANOVA. n = 3. (C) Immunocytochemistry for GFP and V5 tag, counterstained with DAPI in CSCs after 4 days of irradiation (IR) + TMZ and 2 days after GFP or SES viral infection. Quantification as percentage of GFP+ or V5+ cells on the total number of DAPI nuclei (means ± SEM). (D) Clones of mesenchymal shifted CSCs emerged after 10 days of IR + TMZ (infection at 2 days). Quantification as number of tumor spheres per well in either not infected (NI) cultures or GFP infected (mock) or SES infected (as boxplot shown as box for interquartile range, and median line and whiskers for highest and lowest values): GFP versus SES, ****P < 0.0001; statistically compared with one-way ANOVA. n = 11. (E) Clones of mesenchymal shifted CSCs emerged after 20 days of IR + TMZ (infection at 10 days after replating). Quantification as number of tumor spheres per well in either NI cultures or GFP infected (mock) or SES infected (as boxplot shown as box for interquartile range, and median line and whiskers for highest and lowest values): GFP versus SES, ****P < 0.0001; statistically compared with one-way ANOVA. n = 8. Scale bars, 300 μm (B), 100 μm (C), and 500 μm (D and E).
Fig. 6.
Fig. 6.. SES expression is unharmful in cultured neurons.
(A) Immunocytochemistry with MAP2 (neuronal marker), PI (cell death), and V5 (tag) of primary murine hippocampal neurons 15 days after the infection with either mock or SES-expressing viruses, indicating no specific neurodegeneration induced by SES. Quantification (means ± SEM): MAP2 P = 0.2051 (n = 10); PI+/MAP2+ (or MAP2+V5+ in the case of SES): P = 0.6842 (n = 5); statistically compared with unpaired t test. (B) SES causes only marginal gene expression changes in mouse primary neurons as assessed by RNA-seq (7 DPI). (C) Quantification of CUT&Tag SES peaks in SNB19 cells (brown) and neurons (violet) (left). Venn diagram showing that the associated genes in SN19 and neurons are completely different (right). Scale bar, 100 μm (A).
Fig. 7.
Fig. 7.. SES expression is safe in healthy brain.
(A) Schematic representation of mock (GFP)/SES infection in hippocampi of wild-type (WT) mice followed by behavioral testing. (B) Spontaneous alternation test suggests no difference between mock- and SES-injected mice, as assessed by the percentage of the entries in the different arms and both the percentage of spontaneous alternation performance (SAP), the percentage of alternate arm return (AAR), and the percentage of same arm return (SAR) on the total entries. Quantification (means ± SEM): % entries: A, P = 0.8011; B, P > 0.9999; C, P= 0.6812; and D, P = 0.9990; statistically compared with two-way ANOVA. SAP: P = 0.3095; AAR: P = 0.9444; SAR: P = 0.9.444; statistically compared with Mann-Whitney test. n = 5 animals per group. (C) Radial maze test indicates no difference in the time to accomplish the task or tendency of SES-treated animals in committing errors during the entire protocol of the test compared to the mock-injected animals. Statistically compared with two-way ANOVA. n = 5 animals per group. (D) Quantification of CC3+ cells within infected hippocampi shows no difference between the conditions, indicating that SES is not toxic for murine neural cells. n = 9. Scale bar, 100 μm (D).
Fig. 8.
Fig. 8.. Restricted SES expression in mitotically active cells by the pMki67.
(A) Scheme depicts the original SES (v1) and the further version (v2) carrying the Mki67 promoter. (B) Growth curve of SNB19 cells: ***P = 0.0005; two-way ANOVA. n = 3. (C) Stereotactical injection in striatal region of WT mice of a mixture of LVs carrying either the Ef1α-RFP or the pMki67-GFP. After 1 week, the RFP protein is largely diffused in the striatum, while the expression of the GFP is confined in mitotically active neural progenitors lining the ventricles. Right: Magnification of the fields indicated in the images on the left. (D) Stereotactic injection in preformed tumors (CSCs injected 2 weeks before) within the striatal region of NSG mice with a mixture of LVs carrying either the Ef1α-RFP or the pMki67-GFP. After 1 week, both RFP staining and GFP staining are largely diffused in the tumor mass (human specific antibody: hNESTIN+). RFP+ cells (arrows) are also present in the mouse brain parenchyma (hNESTIN), where the rare GFP+ (arrowheads) is infiltrating tumor cells (hNESTIN+), sustaining the specificity of the promoter. Right: Magnification of the fields indicated on the left. (E) DAPI-stained consecutive sections (400-μm distance between each pairs) of xenografts preinfected with either pMKI67::GFP or pMKI67::SES in NSG mice. T, tumor mass. Tumor volume quantification relative to the mean of the control (means ± SEM): P = 0.0024; unpaired t test. n = 3. Scale bars, 500 μm (C, left; D, left; and E) and 100 μm (C, 2; D, 1; and D, 2).

References

    1. Ostrom Q. T., Cioffi G., Gittleman H., Patil N., Waite K., Kruchki C., Barnholtz-Sloan J. S., CBTRUS statistical report: Primary brain and Ooher central nervous system tumors diagnosed in the United States in 2012-2016. Neuro Oncol. 21, 1–100 (2019). - PMC - PubMed
    1. Stupp R., Mason W. P., van den Bent M. J., Weller M., Fisher B., Taphoorn M. J., Belanger K., Brandes A. A., Marosi C., Bogdahn U., Curschmann J., Janzer R. C., Ludwin S. K., Gorlia T., Allgeier A., Lacombe D., Cairncross J. G., Eisenhauer E., Mirimanoff R. O.; European Organisation for Research and Treatment of Cancer Brain Tumor and Radiotherapy Groups; National Cancer Institute of Canada Clinical Trials Group , Radiotherapy plus concomitant and adjuvant temozolomide for glioblastoma. N. Engl. J. Med. 352, 987–996 (2005). - PubMed
    1. Delgado-López P. D., Corrales-García E. M., Survival in glioblastoma: A review on the impact of treatment modalities. Clin. Transl. Oncol. 18, 1062–1071 (2016). - PubMed
    1. Taylor O. G., Brzozowski J. S., Skelding K. A., Glioblastoma multiforme: An overview of emerging therapeutic targets. Front. Oncol. 9, 963 (2019). - PMC - PubMed
    1. Singh S. K., Hawkins C., Clarke I. D., Squire J. A., Bayani J., Hide T., Henkelman R. M., Cusimano M. D., Dirks P. B., Identification of human brain tumour initiating cells. Nature 432, 396–401 (2004). - PubMed

Substances