. 2022 Aug 5;8(31):eabo4413.
doi: 10.1126/sciadv.abo4413. Epub 2022 Aug 3.

Combinations of anti-GITR antibody and CD28 superagonist induce permanent allograft acceptance by generating type 1 regulatory T cells

Affiliations

Combinations of anti-GITR antibody and CD28 superagonist induce permanent allograft acceptance by generating type 1 regulatory T cells

Weitao Que et al. Sci Adv. .

Abstract

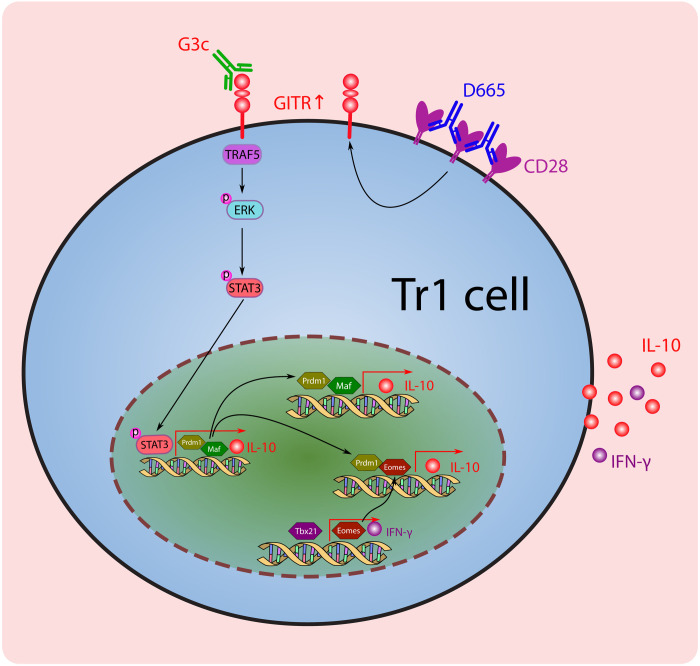
Type 1 regulatory T (Tr1) cells represent a subset of IL-10-producing CD4+Foxp3- T cells and play key roles in promoting transplant tolerance. However, no effective pharmacological approaches have been able to induce Tr1 cells in vivo. We herein report the combined use of a CD28 superagonist (D665) and anti-glucocorticoid-induced tumor necrosis factor receptor-related protein monoclonal antibody (G3c) to induce Tr1 cells in vivo. Large amounts of IL-10/interferon-γ-co-producing CD4+Foxp3- Tr1 cells were generated by D665-G3c sequential treatment in mice. Mechanistic studies suggested that D665-G3c induced Tr1 cells via transcription factors Prdm1 and Maf. G3c contributed to Tr1 cell generation via the activation of mitogen-activated protein kinase-signal transducer and activator of transcription 3 signaling. Tr1 cells suppressed dendritic cell maturation and T cell responses and mediated permanent allograft acceptance in fully major histocompatibility complex-mismatched mice in an IL-10-dependent manner. In vivo Tr1 cell induction is a promising strategy for achieving transplant tolerance.


Figures

Fig. 1.
Fig. 1.. Protocol for the induction of IL-10/IFN-γ–co-producing CD4+Foxp3 Tr1 cells.
(A) D665 (250 μg per mouse) and G3c (250 μg per mouse) were intraperitoneally injected on days −3 and 0 sequentially. (B) Representative flow cytometry (FCM) analysis and frequency of Treg cells in the splenocytes of D665- and immunoglobulin G (IgG)–treated mice on day 0 (n = 6 for each group). ****P < 0.0001. (C and D) The median fluorescence intensity (MFI) of the GITR on CD4+Foxp3+ Treg cells and CD4+Foxp3 Teff cells in the splenocytes of D665- and IgG-treated mice on day 0 (n = 5 for each group). **P < 0.01 and ****P < 0.0001. (E) Representative FCM analysis of CD4+Foxp3+ Treg cells and CD4+Foxp3IL-10+ Tr1 cells in the splenocytes of each treatment group day 3 (D3) and D7 (n = 4 for each group). (F) Frequency of CD4+Foxp3IL-10+ Tr1 cells in the splenocytes of each treatment group on day 3 and day 7 (n = 4 for each group). *P < 0.05, **P < 0.01, and ****P < 0.0001. (G) Frequency of CD4+Foxp3+ Treg cells in the splenocytes of each treatment group on day 3 and day 7 (n = 4 for each group). *P < 0.05, ***P < 0.001, and ****P < 0.0001. Values are shown as the mean ± SEM.
Fig. 2.
Fig. 2.. The phenotype of Treg and Tr1 cells.
(A) Representative histogram of molecule markers on CD4+Foxp3(GFP)+ Treg cells as evaluated by FCM (n = 4 for each group). (B) Representative histogram of molecule markers on CD4+Foxp3IL-10(Venus)+ Tr1 cells as evaluated by FCM (n = 4 for each group).
Fig. 3.
Fig. 3.. Tr1 cells suppress immune responses via IL-10 signaling.
(A) Representative histogram of surface MHC-II, CD40, CD80, and CD86 on BMDCs in each group (n = 4 for each group). (B) Quantitative data of the MFI of surface MHC-II, CD40, CD80, and CD86 on BMDCs in each group (n = 4 for each group). *P < 0.05, **P < 0.01, ***P < 0.001, and ****P < 0.0001. (C) Representative histogram of CFSE dilution of CD8+ T cells in each group (n = 4 for each group). (D) Quantitative data of the proportion of CFSEdim proliferating CD8+ T cells in each group (n = 4 for each group). Values are shown as the mean ± SEM; ***P < 0.001 and ****P < 0.0001.
Fig. 4.
Fig. 4.. Results of an RNA-seq analysis of CD4+IL-10+ and CD4+IL-10 T cells.
(A) Total CD4+ T cells were purified by magnetic-activated cell sorting (MACS) from the splenocytes of D665-G3c–treated IL-10–Venus mice on day 7 and then subjected to CD4+IL-10+ and CD4+IL-10 T cell sorting based on the Venus expression. The isolated CD4+IL-10+ and CD4+IL-10 T cell samples were prepared in three duplicates for the subsequent transcriptome RNA-seq analysis. (B) The relative mRNA expression of IL-10 and Ifng in CD4+IL-10+ and CD4+IL-10 T cells, detected by qRT-PCR, normalized with 18S for each sample (n = 4 for each group). Paired Student’s t test; *P < 0.05 and **P < 0.01. (C) The volcano plot shows the DEGs, with a threshold of absolute log2FC of >0.5 and adjusted P value of <0.05, between CD4+IL-10+ T cells versus CD4+IL-10 T cells. ns, not significant. (D) The heatmap shows 1963 DEGs, among which 525 were up-regulated and 1438 were down-regulated, between CD4+IL-10+ cells versus CD4+IL-10 cells. (E) GO cluster plot displaying a circular dendrogram of the clustering of the DEGs with color-coded log2FC (inner ring) and the assigned functional terms (outer ring). (F) Heatmap of differentially expressed TFs known to regulate Tr1 differentiation. (G) The relative mRNA expression of differentially expressed TFs identified in (F), validated by qRT-PCR, and normalized with 18S for each sample (n = 4 for each group). Paired Student’s t test; *P < 0.05 and **P < 0.01. Values are shown as the mean ± SEM.
Fig. 5.
Fig. 5.. The mechanism underlying the Tr1 cell functions.
(A) The relative mRNA expression of differentially expressed TFs identified in Fig. 4F on day 3 and day 7, normalized with 18S for each sample (n = 4 for each group). *P < 0.05, **P < 0.01, ***P < 0.001, and ****P < 0.0001. (B) Results of a Western blot analysis of the phosphorylated STAT3 (p-STAT3), STAT3, p-ERK, ERK, Blimp1, c-Maf, and β-actin protein expression in each group on day 7. Data are representative of three independent experiments. (C) Quantitative data for the expression of p-STAT3 relative to STAT3, p-ERK relative to ERK, and Blimp1 and c-Maf relative to β-actin in each group on day 7 (n = 3 for each group). *P < 0.05, **P < 0.01, ***P < 0.001, and ****P < 0.0001. (D) The relative mRNA expression of IL-27p28 and Ebi3 on day 3 and day 7, normalized with 18S for each sample (n = 4 for each group). **P < 0.01. Values are shown as the mean ± SEM.
Fig. 6.
Fig. 6.. D665-G3c treatment induced permanent allograft acceptance.
(A) Treatment protocol of D665 and G3c in mouse heart transplantation. D665 (250 μg per mouse) and G3c (250 μg per mouse) were intraperitoneally injected on days −3 and 0 sequentially. Heart transplantation was performed on day 0. (B) The survival of cardiac allografts in each group (n = 9 to 12 for each group). The graft survival of each group was evaluated using Kaplan-Meier curves and log-rank tests. ****P < 0.0001. (C) Representative hematoxylin and eosin staining of cardiac grafts in each treatment group on POD7 (n = 6 for each group). Scale bars, 100 μm. (D) A representative FCM analysis of CD4+CD25+Foxp3+ Treg cells in the splenocytes of each treatment group on POD3 and POD7. (E) A representative FCM analysis of IL-10/IFN-γ–co-producing CD4+ Tr1 cells in the splenocytes (SPs) and GILs of each treatment group on POD7 (n = 4 for each group). (F) A representative FCM analysis of CD4+ T and CD8+ T cells in the splenocytes and GILs of each treatment group on POD7 (n = 4 for each group). (G) Representative CD8 (blue), 5-bromo-2′-deoxyuridine (BrdU) (red), and type IV collagen (yellow) triple immunohistochemistry staining of heart grafts in each group on POD7 (n = 4 for each group). Scale bars, 100 μm. (H) Survival of cardiac allografts in each group (n = 6 for each group). The graft survival of each group was evaluated using Kaplan-Meier curves and log-rank tests. ***P < 0.001.
Fig. 7.
Fig. 7.. The proposed cellular and transcriptional regulation of Tr1 cell development in D665-G3c–treated mice.
The CD28 superagonist D665 induced up-regulation of GITR along with activation and expansion of TH1 cells. The application of G3c targeting GITR contributes the conversion of TH1 cells into IL-10/IFN-γ–co-producing CD4+Foxp3 Tr1 cells via the activation of MAPK-STAT3 signaling. TF Blimp1, c-Maf, Eomes, and Tbx21 are responsible for IL-10/IFN-γ production in D665-G3c–induced Tr1 cells. TRAF5, TNFR-associated factor 5.

References

    1. Leventhal J. R., Mathew J. M., Outstanding questions in transplantation: Tolerance. Am. J. Transplant 20, 348–354 (2020). - PubMed
    1. Roncarolo M. G., Gregori S., Bacchetta R., Battaglia M., Gagliani N., The biology of T regulatory type 1 cells and their therapeutic application in immune-mediated diseases. Immunity 49, 1004–1019 (2018). - PubMed
    1. Song Y., Wang N., Chen L., Fang L., Tr1 cells as a key regulator for maintaining immune homeostasis in transplantation. Front. Immunol. 12, 671579 (2021). - PMC - PubMed
    1. Lühder F., Huang Y., Dennehy K. M., Guntermann C., Müller I., Winkler E., Kerkau T., Ikemizu S., Davis S. J., Hanke T., Hünig T., Topological requirements and signaling properties of T cell–Activating, anti-CD28 antibody superagonists. J. Exp. Med. 197, 955–966 (2003). - PMC - PubMed
    1. Evans E. J., Esnouf R. M., Manso-Sancho R., Gilbert R. J. C., James J. R., Yu C., Fennelly J. A., Vowles C., Hanke T., Walse B., Hünig T., Sørensen P., Stuart D. I., Davis S. J., Crystal structure of a soluble CD28-Fab complex. Nat. Immunol. 6, 271–279 (2005). - PubMed