. 2022 Aug 5;8(31):eabo0412.
doi: 10.1126/sciadv.abo0412. Epub 2022 Aug 3.

Deacetylation of ATG4B promotes autophagy initiation under starvation

Affiliations

Deacetylation of ATG4B promotes autophagy initiation under starvation

Liangbo Sun et al. Sci Adv. .

Abstract

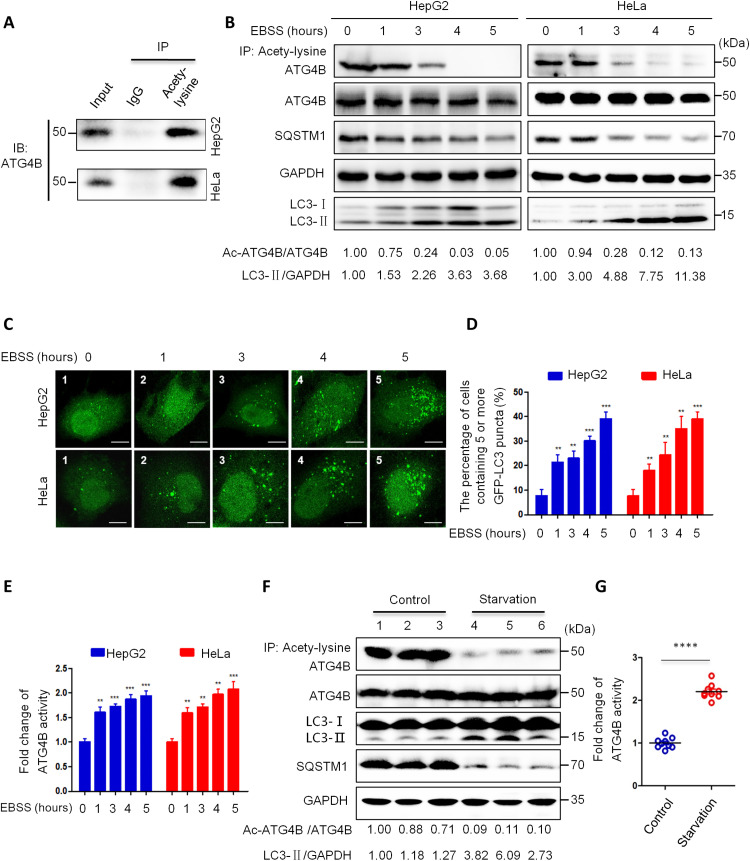
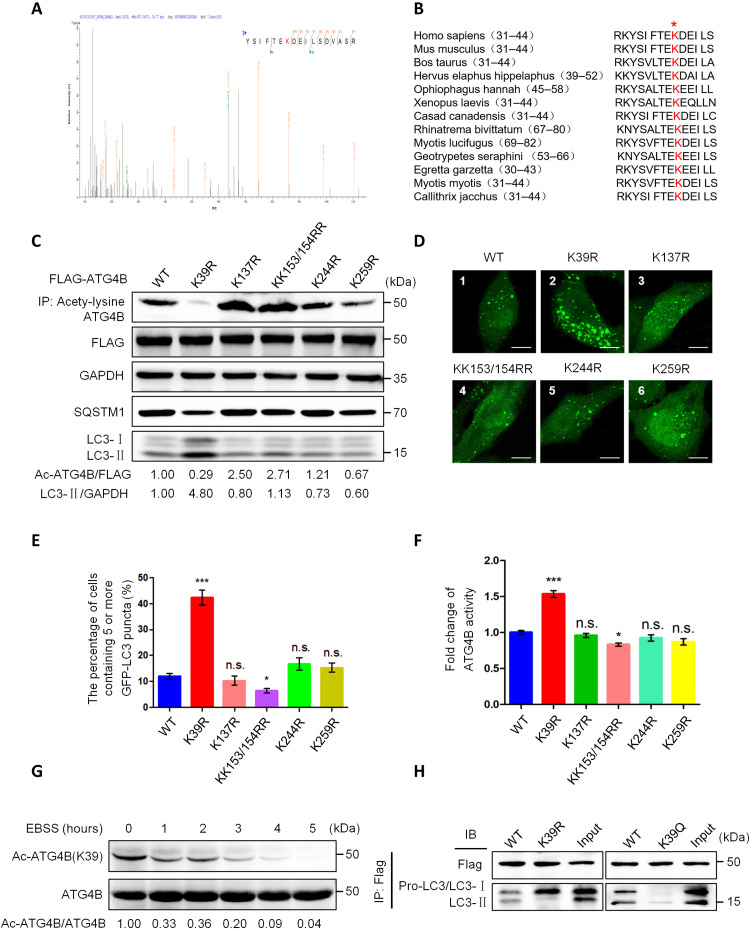
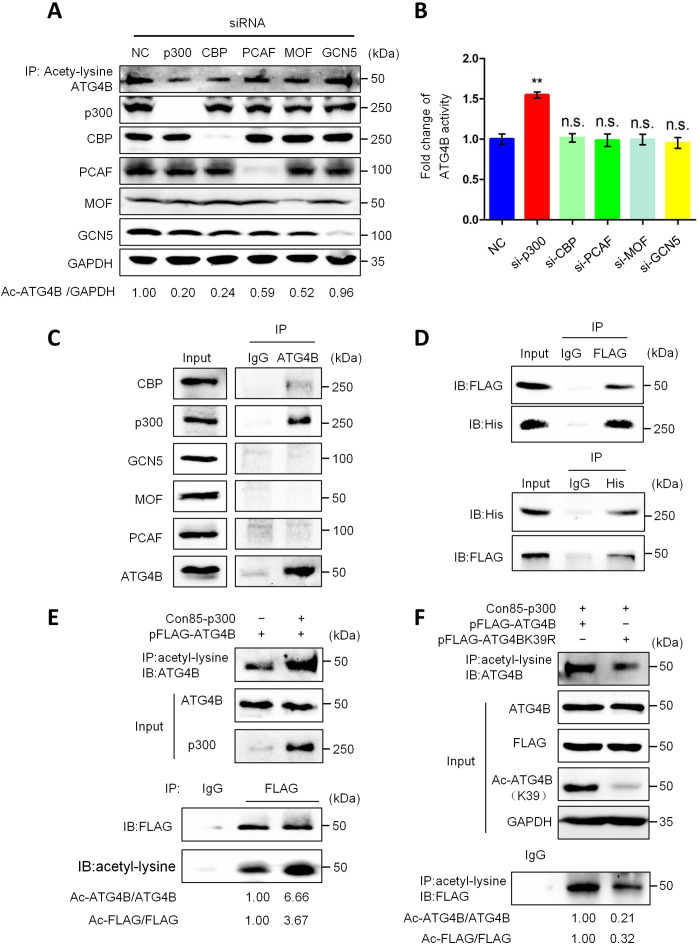
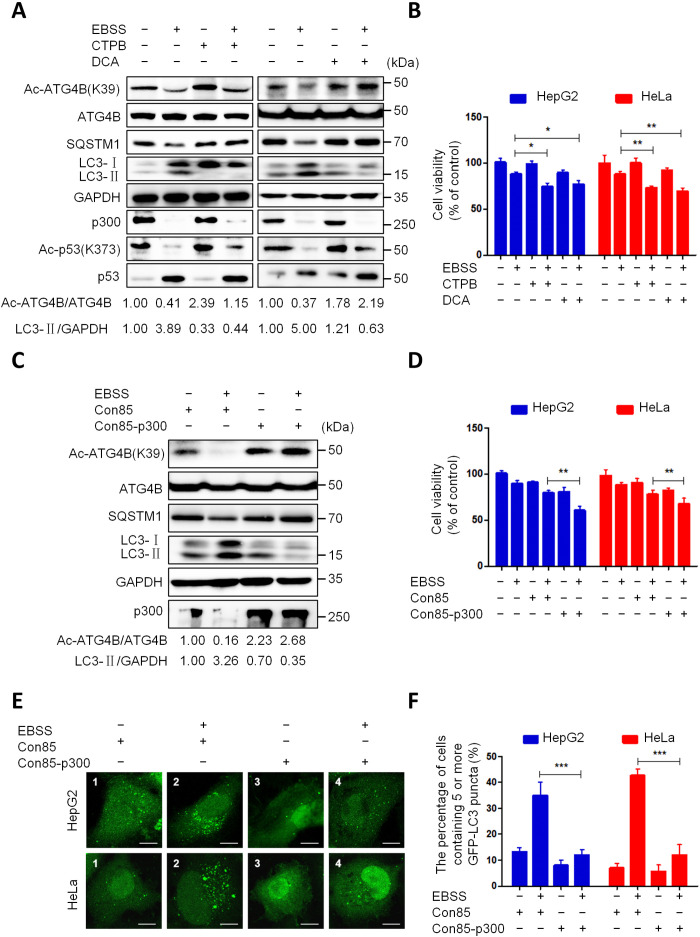
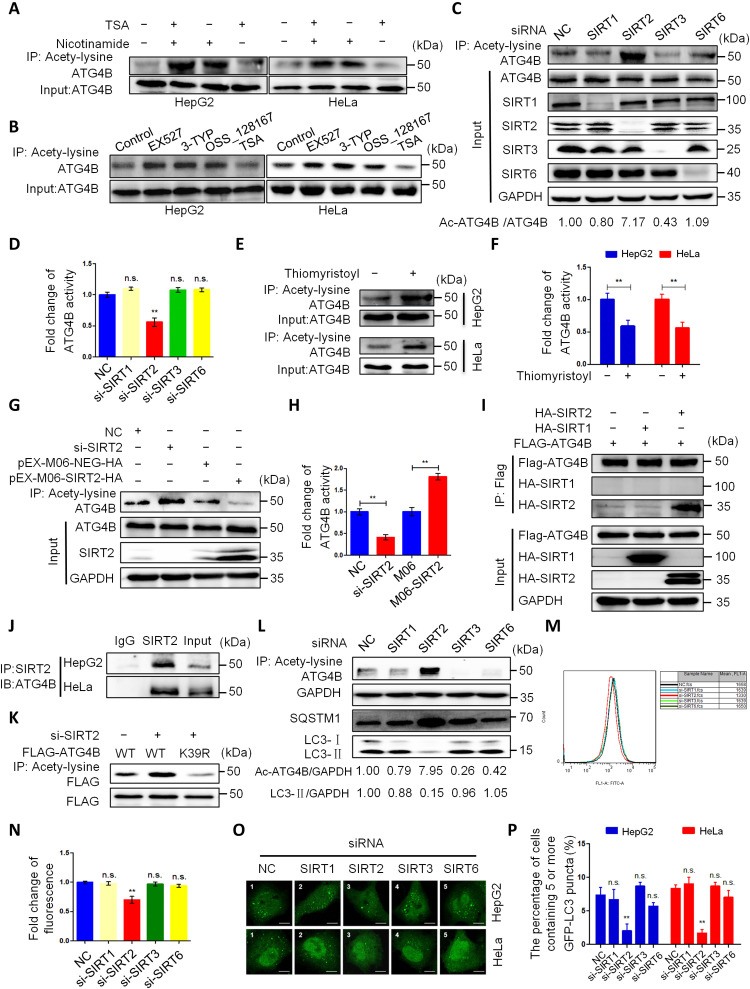
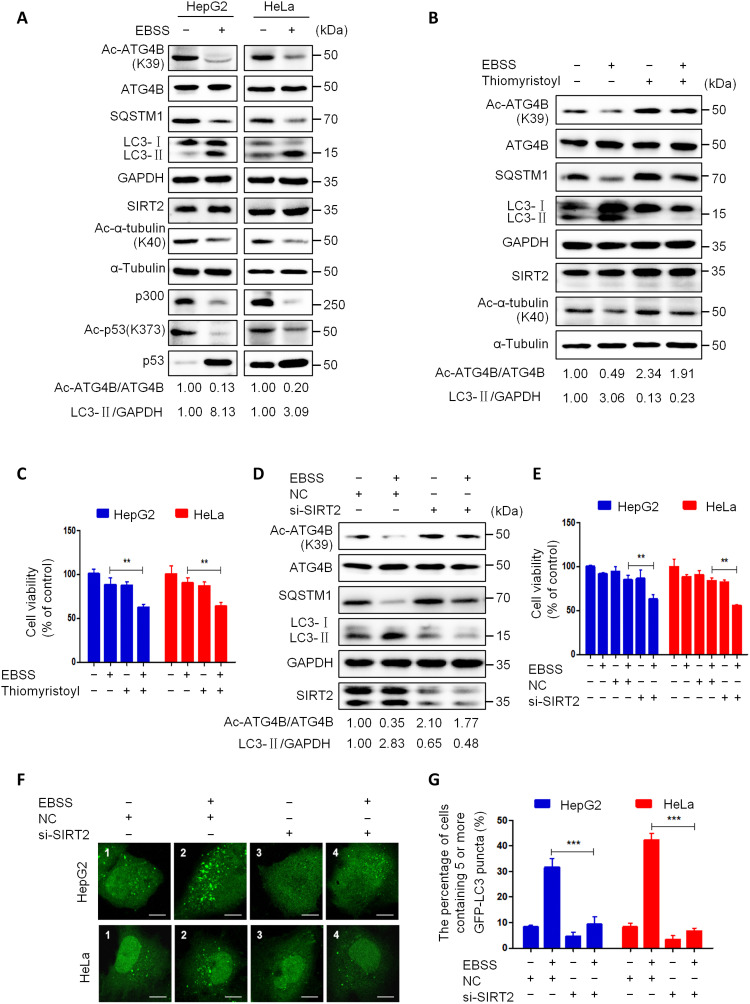
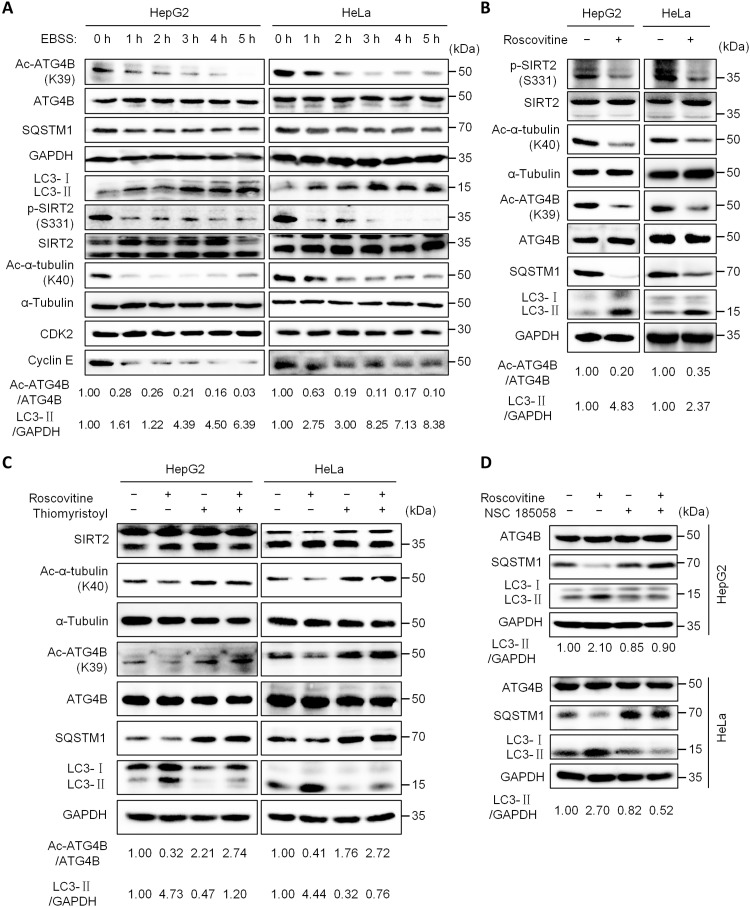
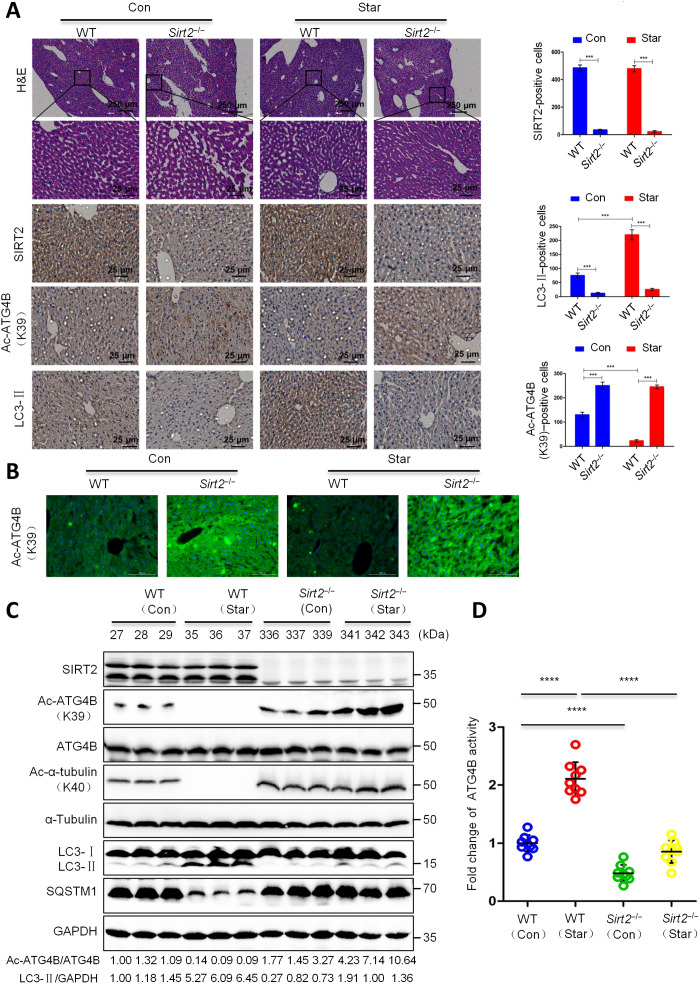
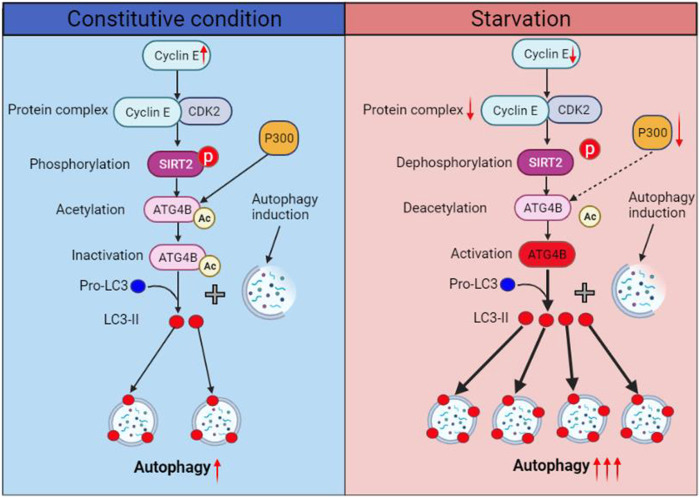
Eukaryotes initiate autophagy when facing environmental changes such as a lack of external nutrients. However, the mechanisms of autophagy initiation are still not fully elucidated. Here, we showed that deacetylation of ATG4B plays a key role in starvation-induced autophagy initiation. Specifically, we demonstrated that ATG4B is activated during starvation through deacetylation at K39 by the deacetylase SIRT2. Moreover, starvation triggers SIRT2 dephosphorylation and activation in a cyclin E/CDK2 suppression-dependent manner. Meanwhile, starvation down-regulates p300, leading to a decrease in ATG4B acetylation at K39. K39 deacetylation also enhances the interaction of ATG4B with pro-LC3, which promotes LC3-II formation. Furthermore, an in vivo experiment using Sirt2 knockout mice also confirmed that SIRT2-mediated ATG4B deacetylation at K39 promotes starvation-induced autophagy initiation. In summary, this study reveals an acetylation-dependent regulatory mechanism that controls the role of ATG4B in autophagy initiation in response to nutritional deficiency.


Figures

Fig. 1.
Fig. 1.. Starvation induces the deacetylation of ATG4B.
(A) Acetylated proteins were immunoprecipitated (IP) from cell lysates using an antibody against acetylated lysine, and the acetylation level of endogenous ATG4B was determined by immunoblotting (IB). (B) HepG2 and HeLa cells were treated with EBSS for the indicated time, the acetylation level of ATG4B was assessed as in (A), and the levels of listed proteins were evaluated by Western blot. (C) Cells with stable GFP-LC3 expression were treated with EBSS for the indicated time and then observed under a fluorescence microscope. Representative images were shown. Scale bar, 5 μm. (D) The findings from (C) were quantified as the proportion of cells with five or more GFP-LC3 puncta. (E) After treatment as in (B), cells were lysed and the activity of ATG4B was determined using the AU4S substrate. (F) Six C57BL/6N mice were randomly separated into two groups and either given conventional laboratory chow (mice 1, 2, and 3) or deprived (mice 4, 5, and 6) for 48 hours. Mice were then slaughtered, and their livers were harvested and lysed. Following that, the acetylation level of ATG4B and the protein levels of ATG4B, SQSTM1, and LC3-I/II were detected. (G) The activity of ATG4B in mouse liver tissue lysates was measured as in (E). The relative intensity of listed proteins in each lane was calculated and normalized with control (lane 1) after quantification and shown in (B) and (F). Data are means ± SD (n = 3). **P < 0.01, ***P < 0.001, and ****P < 0.0001. Ac, acetylated; IgG, immunoglobulin G; EBSS, Earle’s balanced salt solution; GFP, green fluorescent protein.
Fig. 2.
Fig. 2.. The K39 acetylation of ATG4B regulates ATG4B activity and autophagy initiation.
(A) The acetylation sites of ATG4B were detected using mass spectrometry after ATG4B protein was purified by IP and SDS-PAGE. Schematic representation of the acetylated sites on ATG4B. (B) Sequence analysis of the conservation degree of Lys39 in different species of ATG4B. (C) ATG4BCRISPR HepG2 cells (ATG4B hemizygous knockout cells) were transfected with the indicated expression plasmids with point mutation. Cell lysates were used for IP and Western blot assays with the corresponding antibody. (D) The ATG4BCRISPR HepG2 cells with stable GFP-LC3 expression were transfected with the indicated expression plasmids following observation under a fluorescence microscope. Representative images were shown. Scale bar, 5 μm. (E) Quantification of the data from (D); the proportion of cells harboring five or more GFP-LC3 puncta was calculated. (F) The activity of ATG4B in (C) was measured. (G) HepG2 cells were treated with EBSS for various times, and ATG4B acetylation was assessed by Western blot using the K39-acetylated ATG4B antibody. (H) ATG4BCRISPR HepG2 cells were transfected with the wild-type (WT) or K39R mutated or K39Q mutated ATG4B plasmids for 24 hours, following treatment with EBSS for 5 hours, and then whole-cell lysates were immunoprecipitated using an antibody against FLAG tag and analyzed by IB with LC3 antibody. The lysates containing K39R mutation ATG4B or K39Q mutation ATG4B were used as input control. The relative intensity of listed proteins in each lane was calculated and normalized with control (lane 1) after quantification and shown in (C) and (G). Data are means ± SD (n = 3). n.s., no significance; *P < 0.05 and ***P < 0.001.
Fig. 3.
Fig. 3.. p300 is the acetyltransferase of ATG4B.
(A) HepG2 cells were transfected with indicated siRNAs of five acetyltransferases for 24 hours, and then cell lysates were used for IP and Western blot assays with the corresponding antibody. (B) The activity of ATG4B in (A) was measured. (C) The association of endogenous ATG4B and different acetyltransferases was assessed by IP and Western blot. (D) HepG2 cells were cotransfected with pHIS-p300 and pFLAG-ATG4B plasmids, and then cell lysates were used for IP and IB assays with the corresponding antibodies. (E) HepG2 cells were transfected with pFLAG-ATG4B with or without pHIS-p300 plasmids, and then the acetylation level of ATG4B was detected by IP and IB. (F) HepG2 cells were transfected with indicated plasmids, and then the acetylation level of ATG4B was analyzed as in (E). The relative intensity of listed proteins in each lane was calculated and normalized with control (lane 1) after quantification and shown in (A), (E), and (F). Data are means ± SD (n = 3). **P < 0.01.
Fig. 4.
Fig. 4.. Starvation down-regulates the expression of p300.
(A) HepG2 cells were treated with EBSS alone, EBSS combined with CTPB (100 μM), or EBSS combined with DCA (20 mM) for 24 hours. The levels of Ac-ATG4BK39, Ac-p53K373, and listed proteins were analyzed by Western blot. (B) Cells were treated as in (A), and cell viability was detected using the CCK-8 kit. (C) HepG2 cells were transfected with a control vector or pHIS-p300 for 36 hours, following treatment with EBSS or normal medium for 5 hours, and then the levels of Ac-ATG4BK39 and listed proteins were analyzed as in (A). (D) Cells were treated as in (C), and cell viability was measured using the CCK-8 kit. (E) Cells with stable GFP-LC3 expression were treated as in (C) and then observed under a fluorescence microscope. Representative images were shown. Scale bar, 5 μm. (F) Quantification of the data from (E); the proportion of cells carrying five or more GFP-LC3 puncta were calculated. The relative intensity of listed proteins in each lane was calculated and normalized with control (lane 1) after quantification and shown in (A) and (C). Data are means ± SD (n = 3). *P < 0.05, **P < 0.01, and ***P < 0.001.
Fig. 5.
Fig. 5.. SIRT2 is the deacetylase of ATG4B.
(A and B) Cells were treated with indicated reagents for 24 hours, and then cell lysates were used for IP and Western blot. (C and D) HepG2 cells were transfected with the indicated siRNAs for 24 hours, and cell lysates were used for IP, Western blot (C), and ATG4B activity (D) assays. (E and F) Cells were treated with thiomyristoyl for 24 hours, and then the level of Ac-ATG4B (E) and ATG4B activity (F) was measured. (G to I) HepG2 cells were transfected with the indicated siRNAs or plasmids for 24 hours, and then cell lysates were used for IP, Western blot (G and I), and ATG4B activity (H) analysis. (J) The association of endogenous ATG4B and SIRT2 was assessed by IP and IB. (K) ATG4BCRISPR HepG2 cells were transfected with the indicated plasmids or siRNAs, and then the level of Ac-ATG4B was determined. (L and M) HepG2 cells were treated as in (C), and cell lysates were used for IP and Western blot (L). Meanwhile, the treated cells were stained with CYTO-ID Green, fluorescence intensity of autophagosomes was detected with a flow cytometer, and autophagic cells were calculated (M). (N) Quantification of the data from (M). (O) Cells with stable GFP-LC3 expression were treated as in (C) and then observed under a fluorescence microscope. Representative images were shown. Scale bar, 5 μm. (P) Quantifying the data from (O) and showing as the percentage of cells containing five or more GFP-LC3 puncta. The relative intensity of listed proteins in each lane was calculated and normalized with control (lane 1) after quantification and shown in (C) and (L). Data are means ± SD (n = 3). **P < 0.01.
Fig. 6.
Fig. 6.. Starvation activates SIRT2 in cells.
(A) Cells were treated with EBSS for 5 hours; the levels of Ac-ATG4BK39, Ac-α-tubulinK40, Ac-p53K373, and listed proteins were analyzed by Western blot using the corresponding antibodies. (B) HepG2 cells were treated with EBSS, thiomyristoyl (50 μM), or EBSS combined with thiomyristoyl for 24 hours, and then the protein levels were detected as in (A). (C) Cells were treated as in (B); cell viability was detected using the CCK-8 kit. (D) HepG2 cells were transfected with a control siRNA or SIRT2 siRNA for 24 hours following treatment with EBSS or normal medium for 5 hours, and then protein levels were analyzed as in (A). (E) Cells were treated as described in (D), and the vitality of cells was determined using the CCK-8 kit. (F) Cells expressing GFP-LC3 were treated as described in (D) and then viewed under a fluorescence microscope. Representative images were shown. Scale bar, 5 μm. (G) Quantification of the data from (F); data were expressed as the percentage of cells containing five or more GFP-LC3 puncta. The relative intensity of listed proteins in each lane was calculated and normalized with control (lane 1) after quantification and shown in (A), (B), and (D). Data are means ± SD (n = 3). **P < 0.01 and ***P < 0.001.
Fig. 7.
Fig. 7.. Starvation activates SIRT2 by suppressing cyclin E/CDK2.
(A) Cells were treated with EBSS for the indicated time; the levels of Ac-ATG4BK39, Ac-α-tubulinK40, p-SIRT2S331, and listed proteins were analyzed by Western blot using the corresponding antibodies. (B) Cells were treated with roscovitine (100 μM) for 24 hours, and then the protein levels were analyzed as in (A). (C) Cells were treated with roscovitine (100 μM), thiomyristoyl (50 μM), or their combination for 24 hours, and then the protein levels were analyzed as in (A). (D) Cells were treated with roscovitine (100 μM), NSC 185058 (50 μM), or their combination for 24 hours, and then the protein levels were analyzed as in (A). The relative intensity of listed proteins in each lane was calculated and normalized with control (lane 1) after quantification and shown in (A) to (D). The experiments were repeated three times, with similar results obtained.
Fig. 8.
Fig. 8.. SIRT2 is a key modulator of ATG4B deacetylation and autophagy in vivo.
WT C57BL/6N mice or Sirt2 knockout mice (Sirt2−/−) were starved or not for 2 days, and then liver tissues were used for further analysis. (A) The levels of SIRT2, Ac-ATG4BK39, and LC3 were detected by immunohistochemistry. Positive cells were counted among a total of 1000 cells on average. Images were obtained at ×4 or ×20 magnification. Scale bar, 250 or 25 μm. ***P < 0.001. (B) The level of Ac-ATG4BK39 was assessed by immunofluorescent staining. Scale bar, 25 μm. (C) The levels of Ac-ATG4BK39, Ac-α-tubulinK40, and listed proteins were evaluated by Western blot. Relative intensity of Ac-ATG4B and LC3-II in each lane was calculated and normalized with control (lane 1) after quantification and shown. The experiments were repeated three times, with similar results obtained. (D) The activity of ATG4B was measured. ****P < 0.0001.
Fig. 9.
Fig. 9.. Schematic illustration for the ATG4B deacetylation–induced autophagy initiation.
In a sufficient nutrient environment (left), cyclin E and p300 are in relative high levels in cells. Cyclin E is sufficient to form the cyclin E/CDK2 complex with CDK2 and maintain the activity of CDK2. The active CDK2 phosphorylates SIRT2 at S331 and inhibits its activity. The low activity of SIRT2 and the high level of p300 cause a high acetylation level of ATG4B at K39, leading to low levels of ATG4B activity and autophagy initiation. In a nutrient deficiency (starvation) environment (right), cyclin E and p300 are down-regulated in cells. The amount of the cyclin E/CDK2 complex is not enough to keep the activity of CDK2. Subsequently, the phosphorylation of SIRT2 is suppressed and the activity of SIRT2 is increased. The high activity of SIRT2 and the low level of p300 bring a low acetylation level of ATG4B at K39, resulting in high levels of ATG4B activity and autophagy initiation. Ac, acetylation; p, phosphorylation; ↑, up-regulation; ↓, down-regulation.

Similar articles

Cited by

References

    1. Ohsumi Y., Historical landmarks of autophagy research. Cell Res. 24, 9–23 (2014). - PMC - PubMed
    1. Nakatogawa H., Mechanisms governing autophagosome biogenesis. Nat. Rev. Mol. Cell Biol. 21, 439–458 (2020). - PubMed
    1. Fukuda T., Kanki T., Atg43, a novel autophagy-related protein, serves as a mitophagy receptor to bridge mitochondria with phagophores in fission yeast. Autophagy 17, 826–827 (2021). - PMC - PubMed
    1. Levine B., Kroemer G., Biological functions of autophagy genes: A disease perspective. Cell 176, 11–42 (2019). - PMC - PubMed
    1. Cadwell K., Crosstalk between autophagy and inflammatory signalling pathways: Balancing defence and homeostasis. Nat. Rev. Immunol. 16, 661–675 (2016). - PMC - PubMed