. 2022 Aug 3;14(656):eabn7571.
doi: 10.1126/scitranslmed.abn7571. Epub 2022 Aug 3.

Triple-negative breast cancer metastasis involves complex epithelial-mesenchymal transition dynamics and requires vimentin

Affiliations

Triple-negative breast cancer metastasis involves complex epithelial-mesenchymal transition dynamics and requires vimentin

Eloïse M Grasset et al. Sci Transl Med. .

Abstract

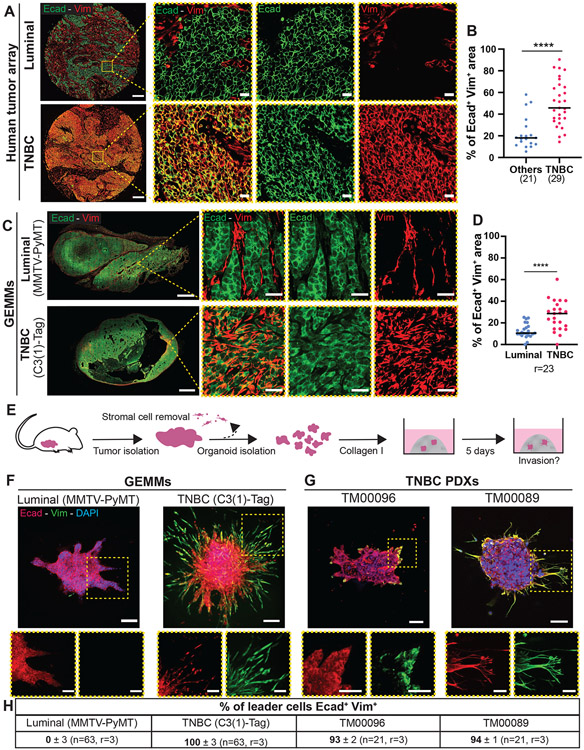
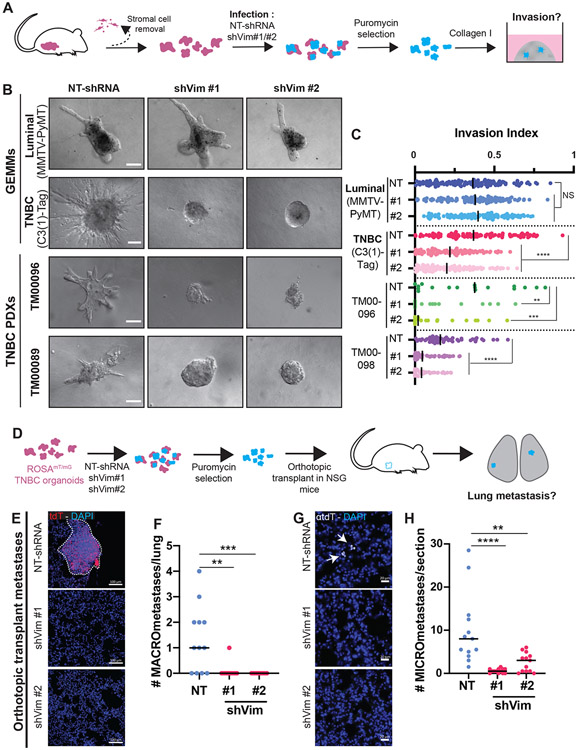
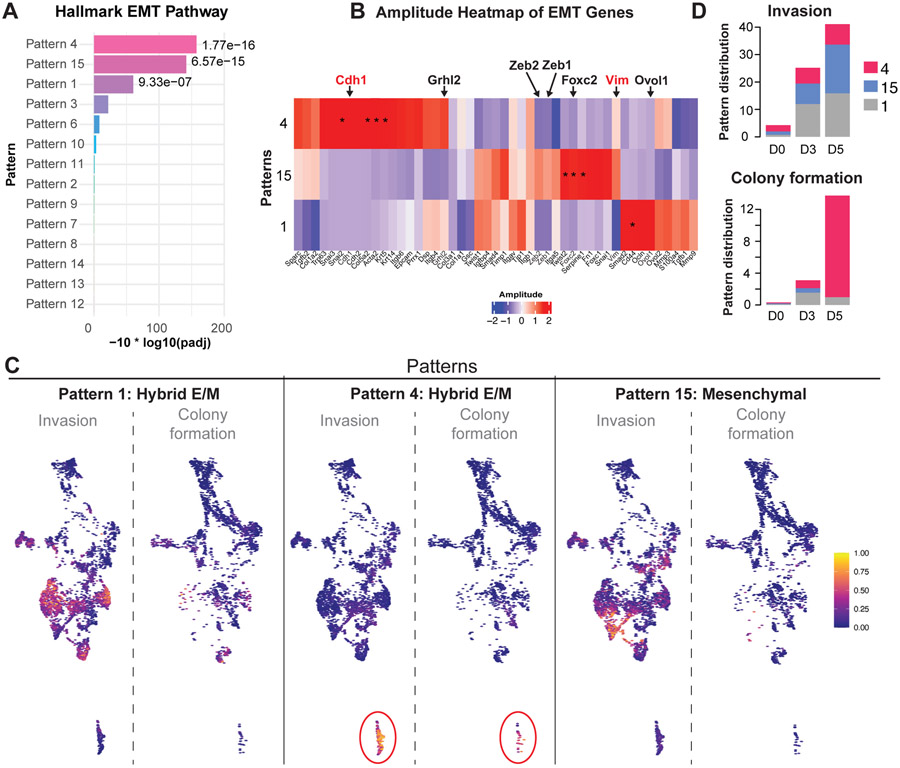
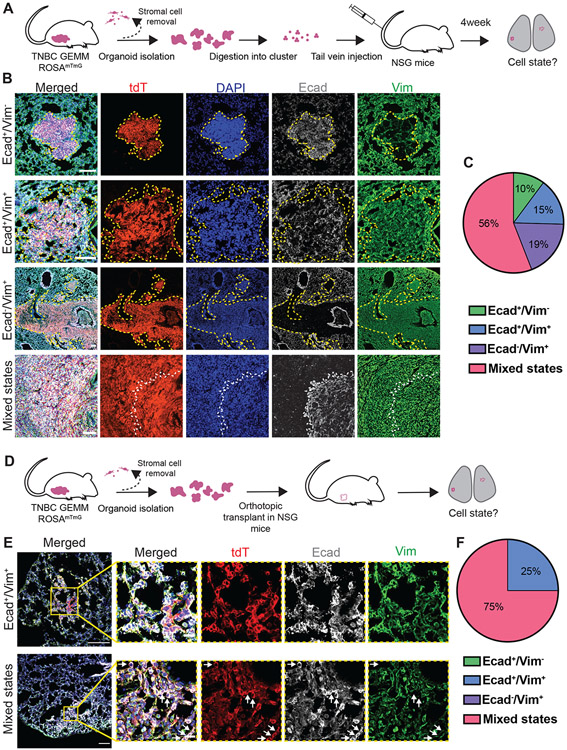
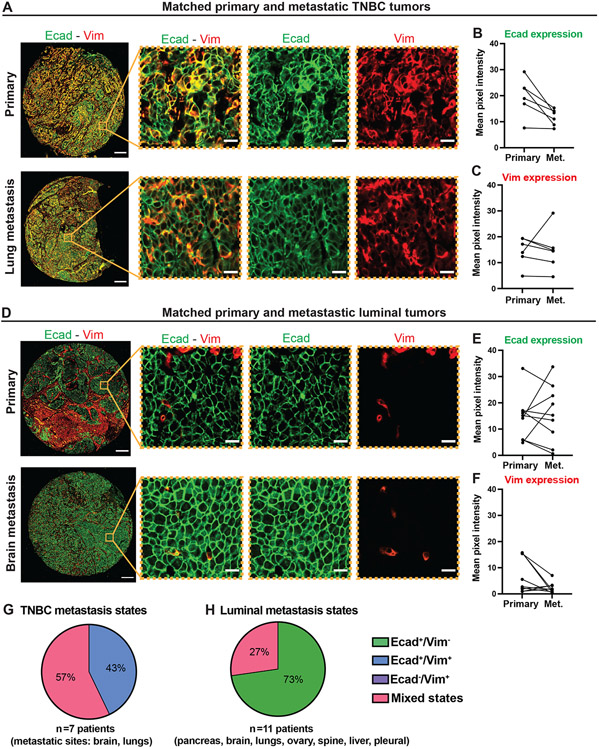
Triple-negative breast cancer (TNBC) is an aggressive subtype associated with early metastatic recurrence and worse patient outcomes. TNBC tumors express molecular markers of the epithelial-mesenchymal transition (EMT), but its requirement during spontaneous TNBC metastasis in vivo remains incompletely understood. We demonstrated that spontaneous TNBC tumors from a genetically engineered mouse model (GEMM), multiple patient-derived xenografts, and archival patient samples exhibited large populations in vivo of hybrid E/M cells that lead invasion ex vivo while expressing both epithelial and mesenchymal characteristics. The mesenchymal marker vimentin promoted invasion and repressed metastatic outgrowth. We next tested the requirement for five EMT transcription factors and observed distinct patterns of utilization during invasion and colony formation. These differences suggested a sequential activation of multiple EMT molecular programs during the metastatic cascade. Consistent with this model, our longitudinal single-cell RNA analysis detected three different EMT-related molecular patterns. We observed cancer cells progressing from epithelial to hybrid E/M and strongly mesenchymal patterns during invasion and from epithelial to a hybrid E/M pattern during colony formation. We next investigated the relative epithelial versus mesenchymal state of cancer cells in both GEMM and patient metastases. In both contexts, we observed heterogeneity between and within metastases in the same individual. We observed a complex spectrum of epithelial, hybrid E/M, and mesenchymal cell states within metastases, suggesting that there are multiple successful molecular strategies for distant organ colonization. Together, our results demonstrate an important and complex role for EMT programs during TNBC metastasis.


Figures

Figure 1:
Figure 1:. Primary TNBC tumors from patients and animal models contain hybrid E/M cells that lead invasion.
A) Representative epifluorescence images of human primary breast tumors stained with Ecad and Vim. Scale bar is 200 μm and 20 μm (insets). B) Percentage of Ecad+ Vim+ double positive area in human breast tumors (n=21 non-TNBC, n= 29 TNBC tumors). Percentage calculated by pixel colocalization analysis. Each dot corresponds to a tumor, bars are medians. ****P<0.0001 (Mann-Whitney). C) Representative epifluorescence (whole tumor, left) and confocal image (zoom, right) of MMTV-PyMT and C3(1)-Tag primary tumors stained with Ecad and Vim. Scale bars are 2000 μm and 25 μm for (insets). D) Percentage of Ecad+ Vim+ area in whole MMTV-PyMT and C3(1)-Tag primary tumors. Percentage calculated by pixel colocalization analysis. Each dot corresponds to a tumor, bars show the medians. ****P<0.0001 (two side T-Test) E) Schema of organoid isolation and invasion assay. The primary tumor is digested into tumor organoids and the stromal cells are removed by differential centrifugations. Each organoid is composed of 200 to 500 adherent cancer cells and embedded in 3D collagen I matrix. After 5 days, the organoids are fixed for immunostaining. F, G) Representative confocal maximum intensity projections of whole organoids stained with anti-Ecad and anti-Vim antibodies and DAPI in GEMMs (F) and TNBC PDXs (G). Scale bars are 100 μm and 50 μm (insets). H) Frequency of leader cells expressing Ecad and Vim with the median of the percentage and the standard error of mean (SEM).
Figure 2:
Figure 2:. Vimentin is required for TNBC invasion and orthotopic metastasis formation
A) Schema of collagen I invasion assay with shRNA knockdown. After isolation, organoids are infected with either non-targeting shRNA (NT-shRNA) or either of two shRNA sequences against vimentin (shVim #1 and shVim #2). After puromycin selection to eliminate non-infected cells, organoids are plated into collagen I. B) Representative DIC images of organoids infected with NT-shRNA, shVim #1, or shVim #2 after 5 days in collagen I matrix. Scale bars are 100 μm. C) Quantification of organoid invasion represented in B. Each dot corresponds to one organoid, bars show the medians. NS: not significant, ****P<0.0001, **P=0.0065 and ***P=0.0002 (Kruskal-Wallis). n=926 organoids, r=3 biological replicates. D) Schema of transplant assay to study metastasis. Fluorescent organoids expressing membrane tdTomato are isolated and infected with lentivirus expression NT-shRNA, shVim #1, or shVim#2. After puromycin selection organoids are orthotopically transplanted into the cleared mammary fat pad of NSG mice. After 6-8 weeks, when the primary tumors are 20 mm, lungs are collected. E) Representative confocal images of lung sections stained with DAPI. Metastasis are detected by membrane tomato (tdT) signal. Scale bars are 100 μm. F) Quantification of the number of MACROmetastases (>100 cells). Each dot corresponds to the number of macrometastases in whole lungs. Bars show the medians. **P=0.0019, ***P=0.0006 (Kruskal-Wallis). G) Representative epifluorescence of MICROmetastases in the lungs. Micrometastases were detected by anti-tdT immunostaining and DAPI. Scale bars are 20 μm. Arrows indicate single cell micrometastases. N=35 mice, r=3 biological replicates. H) Number of MICROmetastases per lung section (20 μm thickness). Each dot corresponds to the number of micrometastases in a lung section. Bars show medians. **P=0.0082, ****P<0.0001 (Kruskal-Wallis). N=39 sections, r=3 biological replicates.
Figure 3:
Figure 3:. Vimentin represses colony formation ex vivo and tail vein experimental metastasis in vivo.
A) Schema of colony formation assay using shRNA. After isolation, organoids are infected with either NT-shRNA or either of two shRNA sequences against vimentin (shVim #1 and shVim #2). After puromycin selection to eliminate non-infected cells, organoids are dissociated into clusters and embedded in Matrigel. B) Representative DIC images of colonies infected with NT-shRNA, shVim #1, or shVim #2 after 5 days (GEMM) or 10 days (PDX) in Matrigel. Scale bars are 100 μm. C) Number of colonies per well. Each dot represents the number of colonies in one well, bars show the medians. NS = not significant, **P=0.008, ***P<0.001 ****P<0.0001 (one-way ANOVA). n=89, r=3. D) Tail vein assay schema to study the late steps of the metastatic cascade. Fluorescent organoids are infected with NT-shRNA, shVim #1, or shVim #2. After selection, organoids are dissociated into clusters and injected into the tail vein of NSG mice. After 4 weeks, the number of metastases in the lungs is assessed. E) Representative epifluorescence images of whole lungs. Macrometastases indicated by arrows are detected by tdT signal. F) Number of macrometastases per lung. Each dot corresponds to a lung. Bars show medians. **P=0.0036, ***P=0.0004 (Kruskal-Wallis). n=24 mice, r=2 biological replicates.
Figure 4:
Figure 4:. Cancer cells transition to hybrid E/M states and require different EMT TFs during invasion and colony formation.
A) Schema of the longitudinal single-cell RNA sequencing experiment. After isolation, C3(1)-Tag organoids are embedded in collagen I or dissociated into clusters and embedded in Matrigel. After 12h, 3 days and 5 days, organoids are extracted from the matrix and dissociated into single cells. Single tumor cells and 4T1 cells, used as a reference for batch correction, are barcoded per condition before flow sorting for live cells using propidium iodide. Live cells are next used for 10X Genomics barcoding and library preparation. All conditions are then sequenced together. B) UMAP representation of the sequenced cells from invasion and colony formation assay. Each dot corresponds to single cell and the colors indicate the day the cells were extracted from the matrix. C) Distribution of the proportion of Ecad+ and/or Vim+ cells by matrix and day. D) Schema for shRNA-based gene knock-down in the invasion and colony formation assays. After isolation, organoids are infected with either NT-shRNA or a pool of 3 shRNA sequences against a specific gene. After puromycin selection to eliminate non-infected cells, organoids are either directly lysed to extract mRNA for qPCR analysis, embedded into collagen I, or dissociated into clusters and embedded in Matrigel. After 5 days, the invasion or the number of colonies is measured. E) mRNA fold change, assayed by qRT-PCR, of Ecad (Cdh1) and Vim gene expression in C3(1)-Tag organoids knocked-down for Grhl2, Zeb2, Foxc2, Zeb1 and Ovol1. Histogram of mean with SEM. r ≥3. * P<0.05, ***P<0.005 (paired T-test, two sided on the deltaCT value between NT-shRNA and shRNA against specific gene). F) Representative confocal images of maximum intensity projection of whole C3(1)-Tag organoids stained with Vim. GFP indicates infected cells. Scale bars are 100 μm. G) Quantification of organoid invasion represented in F. Each dot corresponds to one organoid, bars show the medians. **P=0.0016, ***P=0.0003, ****P<0.0001 (Kruskal-Wallis), n=163 organoids, r=3 biological replicates. H) Representative epifluorescence images of maximum intensity projection of C3(1)-Tag colonies. GFP indicates infected cells. Scale bars are 500 μm. I) Number of colonies per well. Each dot represents the number of colonies in one well, bars show the medians. *P=0.0267, **P=0.034 (Kruskal-Wallis), n=67 wells, r=3 biological replicates.
Figure 5:
Figure 5:. scRNA-seq reveals different EMT programs during invasion and colony formation
A) Barplot representing the p-value of the enrichment of hallmark EMT pathway for the genes associated with patterns learned from the single-cell data with CoGAPS Bayesian non-negative matrix factorization. B) Heatmap of weights of genes associated with patterns learned from the single-cell data with CoGAPS Amplitude matrix for EMT genes. *indicates unique association of genes with each pattern with the CoGAPS patternMarker statistic. C) Cell weights for each of the four CoGAPS patterns associated with the EMT pathway plotted on the UMAP embedding of the scRNA-seq data. D) Distribution of the proportion of cells associated with each of the four CoGAPS patterns associated with the EMT pathway by matrix and day.
Figure 6:
Figure 6:. TNBC GEMM metastases are heterogeneous and typically maintain mesenchymal gene expression.
A) Schema of tail vein experimental metastasis assay to characterize EMT states during colony formation in vivo. C3(1)-Tag fluorescent organoids expressing membrane tdTomato are isolated, digested into single cells and clusters and injected into the tail vein of NSG mice. Lungs are collected at 4 weeks and immunostained for epithelial and mesenchymal markers. B) Representative epifluorescence images of the different metastasis states detected in lung sections stained for Ecad and Vim. Scale bars are 100 μm. C) Proportion of macrometastases from tail vein experimental metastasis assays composed of Ecad+/Vim cells, Ecad+/Vim+ cells, Ecad/Vim+ cells, and mixed states (composed of cells in two or three of the previous categories). N=21 mice, r=5 biological replicates. D) Scheme of orthotopic transplant assay to study metastases in vivo. C3(1)-Tag fluorescent organoids expressing membrane tdTomato are isolated and transplanted into the cleared mammary fat pad of NSG mice. Lungs are collected after 6-8 weeks, when primary tumors reach 20 mm. E) Representative confocal images of the different metastasis states detected in lung sections stained for Ecad and Vim. Scale bars are 100 μm and 20 μm (insets). White arrows indicate epithelial cells (Ecad+/Vim). F) Proportion of orthotopic macrometastases composed of Ecad+/Vim cells, Ecad+/Vim+ cells, Ecad/Vim+ cells, and mixed states (composed of cells in two or three of the previous categories). n=6 mice, r=2 biological replicates.
Figure 7:
Figure 7:. EMT states in paired patient primary and metastatic TNBC or luminal tumors.
A) Representative epifluorescence images of paired primary and metastatic TNBC tumors. Scale bars are 200 μm and 20 μm (insets). B, C) Quantification of the mean pixel intensity of Ecad (B) and Vim (C) staining in cancer cells from primary and metastatic TNBC tumors from individual patients. Each dot corresponds to the mean pixel intensity of cancer cells from a tumor. n=5 primary tumors and 6 metastases. D) Representative epifluorescence images of paired primary and metastatic luminal tumors. Scale bars are 200 μm and 20 μm (insets). E, F) Quantification of the mean pixel intensity of Ecad (E) and Vim (F) staining in cancer cells from primary and metastatic luminal tumors from individual patients. Each dot corresponds to the mean pixel intensity of cancer cells from a tumor. n=8 primary tumors and 9 metastases. G, H) Proportion of patient TNBC (G) and luminal (H) metastases composed of Ecad+/Vim cells, Ecad+/Vim+ cells, Ecad/Vim+ cells, and mixed states (composed of cells in two or three of the previous categories).

References

    1. Siegel RL, Miller KD, Fuchs HE, Jemal A, Cancer Statistics, 2021. CA Cancer J Clin 71, 7–33 (2021); published online EpubJan (10.3322/caac.21654). - DOI - PubMed
    1. Voduc KD, Cheang MC, Tyldesley S, Gelmon K, Nielsen TO, Kennecke H, Breast cancer subtypes and the risk of local and regional relapse. J Clin Oncol 28, 1684–1691 (2010); published online EpubApr 1 (JCO.2009.24.9284 [pii] 10.1200/JCO.2009.24.9284). - DOI - PubMed
    1. Dang TT, Prechtl AM, Pearson GW, Breast cancer subtype-specific interactions with the microenvironment dictate mechanisms of invasion. Cancer Res 71, 6857–6866 (2011); published online EpubNov 1 (0008-5472.CAN-11-1818 [pii] 10.1158/0008-5472.CAN-11-1818). - DOI - PMC - PubMed
    1. Kast K, Link T, Friedrich K, Petzold A, Niedostatek A, Schoffer O, Werner C, Klug SJ, Werner A, Gatzweiler A, Richter B, Baretton G, Wimberger P, Impact of breast cancer subtypes and patterns of metastasis on outcome. Breast Cancer Res Treat, (2015); published online EpubMar 18 (10.1007/s10549-015-3341-3). - DOI - PubMed
    1. Gupta GP, Massagué J, Cancer Metastasis: Building a Framework. Cell 127, 679–695 (2006); published online Epub2006/11/17/ (10.1016/j.cell.2006.11.001). - DOI - PubMed

Publication types