

Identification of a Molecularly-Defined Subset of Breast and Ovarian Cancer Models that Respond to WEE1 or ATR Inhibition, Overcoming PARP Inhibitor Resistance
- PMID: 35921524
- PMCID: PMC9561606
- DOI: 10.1158/1078-0432.CCR-22-0568
Identification of a Molecularly-Defined Subset of Breast and Ovarian Cancer Models that Respond to WEE1 or ATR Inhibition, Overcoming PARP Inhibitor Resistance
Abstract
Purpose: PARP inhibitors (PARPi) induce synthetic lethality in homologous recombination repair (HRR)-deficient tumors and are used to treat breast, ovarian, pancreatic, and prostate cancers. Multiple PARPi resistance mechanisms exist, most resulting in restoration of HRR and protection of stalled replication forks. ATR inhibition was highlighted as a unique approach to reverse both aspects of resistance. Recently, however, a PARPi/WEE1 inhibitor (WEE1i) combination demonstrated enhanced antitumor activity associated with the induction of replication stress, suggesting another approach to tackling PARPi resistance.
Experimental design: We analyzed breast and ovarian patient-derived xenoimplant models resistant to PARPi to quantify WEE1i and ATR inhibitor (ATRi) responses as single agents and in combination with PARPi. Biomarker analysis was conducted at the genetic and protein level. Metabolite analysis by mass spectrometry and nucleoside rescue experiments ex vivo were also conducted in patient-derived models.
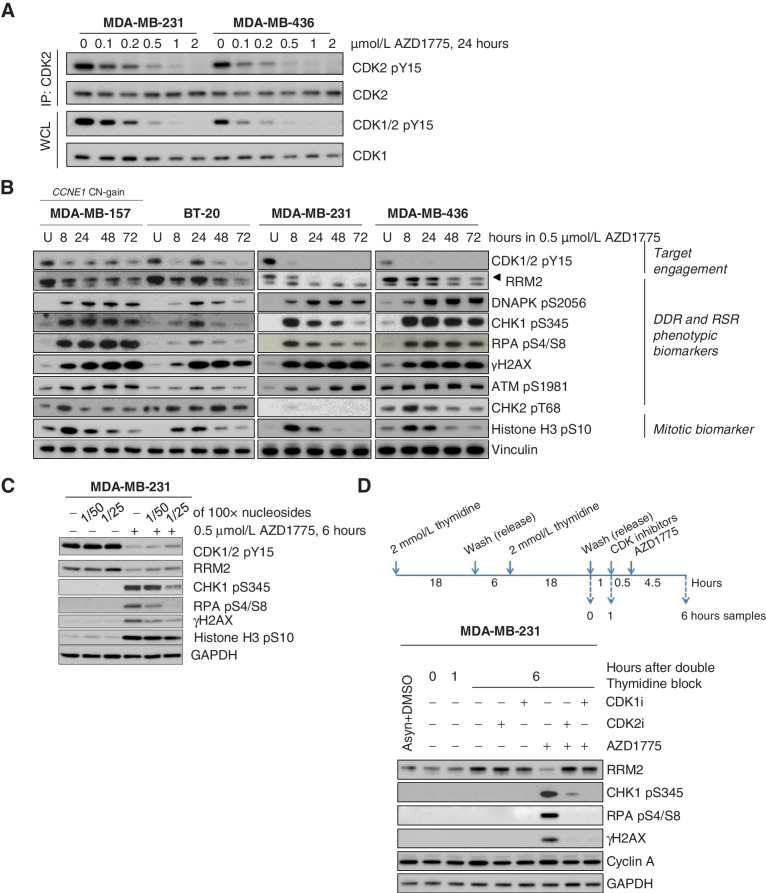
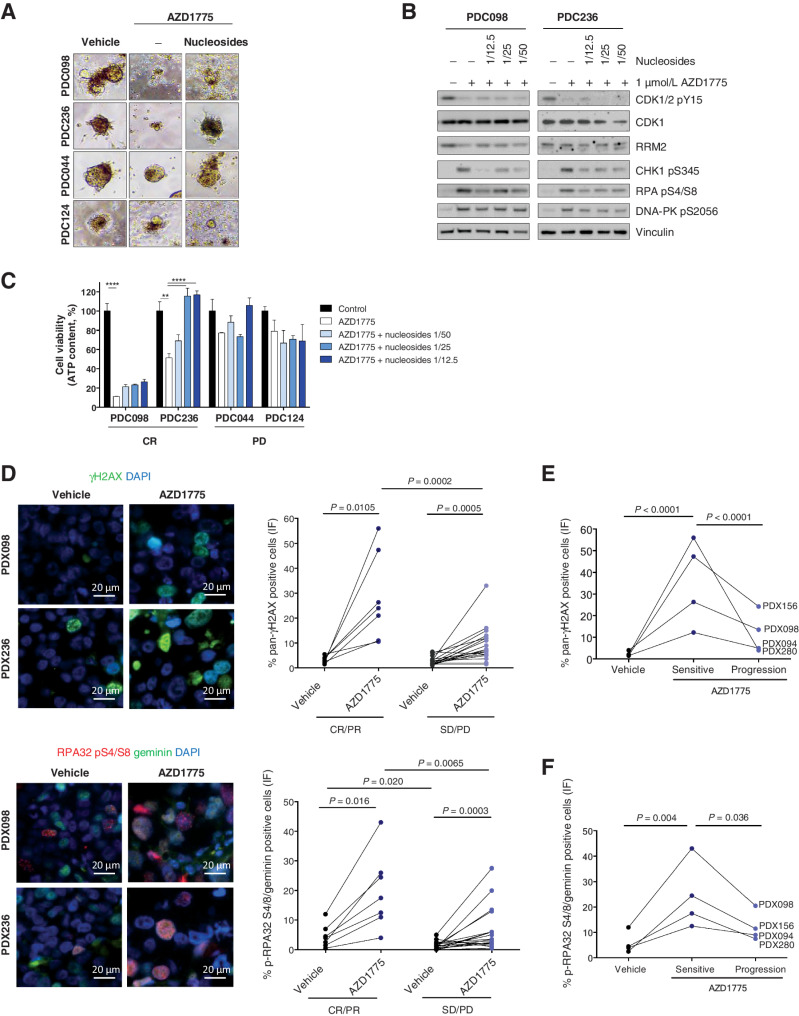
Results: Although WEE1i response was linked to markers of replication stress, including STK11/RB1 and phospho-RPA, ATRi response associated with ATM mutation. When combined with olaparib, WEE1i could be differentiated from the ATRi/olaparib combination, providing distinct therapeutic strategies to overcome PARPi resistance by targeting the replication stress response. Mechanistically, WEE1i sensitivity was associated with shortage of the dNTP pool and a concomitant increase in replication stress.
Conclusions: Targeting the replication stress response is a valid therapeutic option to overcome PARPi resistance including tumors without an underlying HRR deficiency. These preclinical insights are now being tested in several clinical trials where the PARPi is administered with either the WEE1i or the ATRi.
©2022 The Authors; Published by the American Association for Cancer Research.
Figures
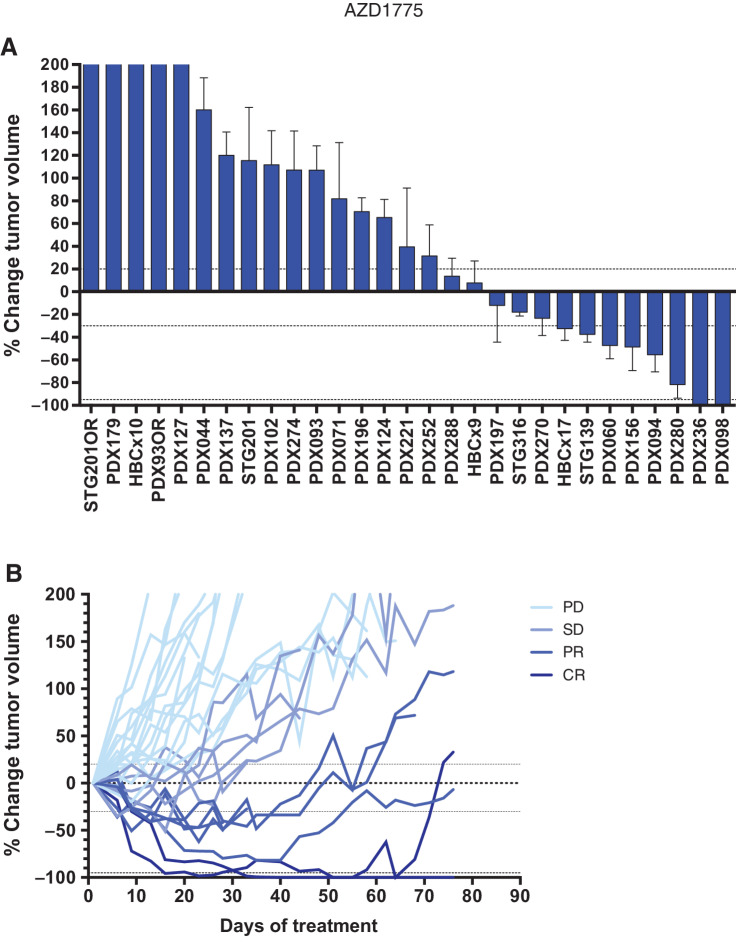
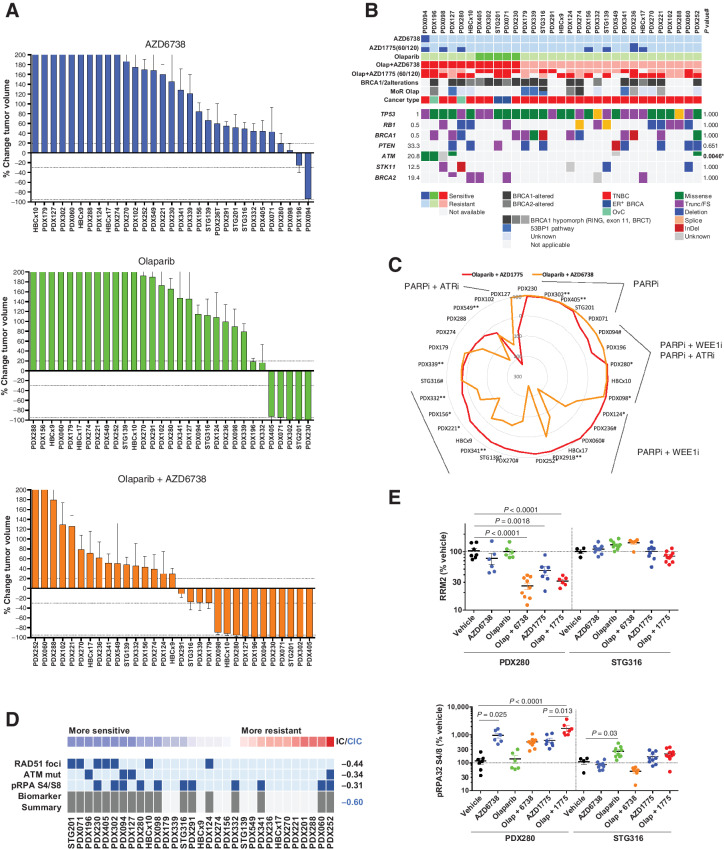
![Figure 2. Response biomarkers to AZD1775. A, Summary of selected DDR genetic alterations (see Materials and Methods, for the complete gene list) identified by exome sequencing in the PDX cohort from Fig. 1A. Sensitivity (CR+PR) or resistance (SD+PD) to AZD1775 is indicated, as well as the cancer subtype. The frequency of each mutation within the PDX cohort and the P value for the association of each alteration with AZD1775 response is shown. Different colors indicate the specific type of mutation. B, Forest plot and odds ratio analysis of the response to AZD1775 according to the IHC/genetic markers LKB1, pRb/RB1 and PTEN (n = 28). Null, no expression by IHC; mut, mutant. C, Sensitivity to AZD1775 of MCF10A p53−/− Rb−/− cells upon LKB1 knockdown using two independent siRNAs separately and pooled. Bars indicate the AUC relative to the control siRNA (siCON). Error bars indicate SD of three independent experiments. P values are shown. D, Metabolite data annotation to KEGG metabolic pathways for PDX098 and PDX060 (AZD1775-sensitive), compared with PDX102 (AZD1775-resistant). Nodes represent metabolic pathways and the depicted color indicates the number of significant changes following treatment with AZD1775 for 8 or 24 hours compared with vehicle [|log2(fold change)|>0.5, P-value <0.05, QC CV < 30%]. E, REVEALER analysis for AZD1775 antitumor response in the PDX cohort. The nonlinear information coefficient (IC) and conditional information coefficient (CIC) values are provided.](https://cdn.ncbi.nlm.nih.gov/pmc/blobs/af0f/9561606/b21d6de34121/4536fig2.jpg)
References
Publication types
MeSH terms
Substances
Grants and funding
LinkOut - more resources
Full Text Sources
Other Literature Sources
Medical
Research Materials
Miscellaneous
