. 2022 Nov 3;140(18):1937-1950.
doi: 10.1182/blood.2022015451.

Clonal germinal center B cells function as a niche for T-cell lymphoma

Affiliations

Clonal germinal center B cells function as a niche for T-cell lymphoma

Manabu Fujisawa et al. Blood. .

Abstract

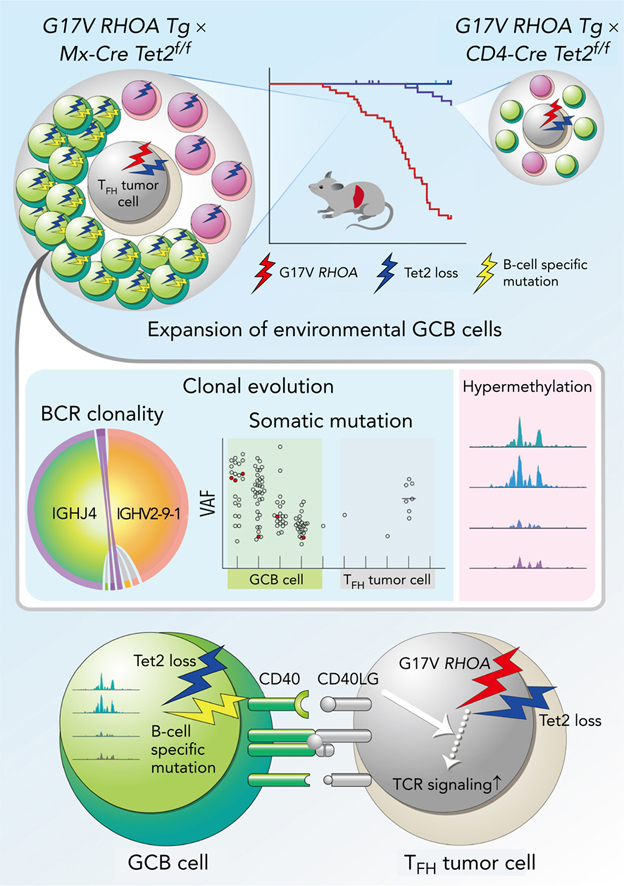
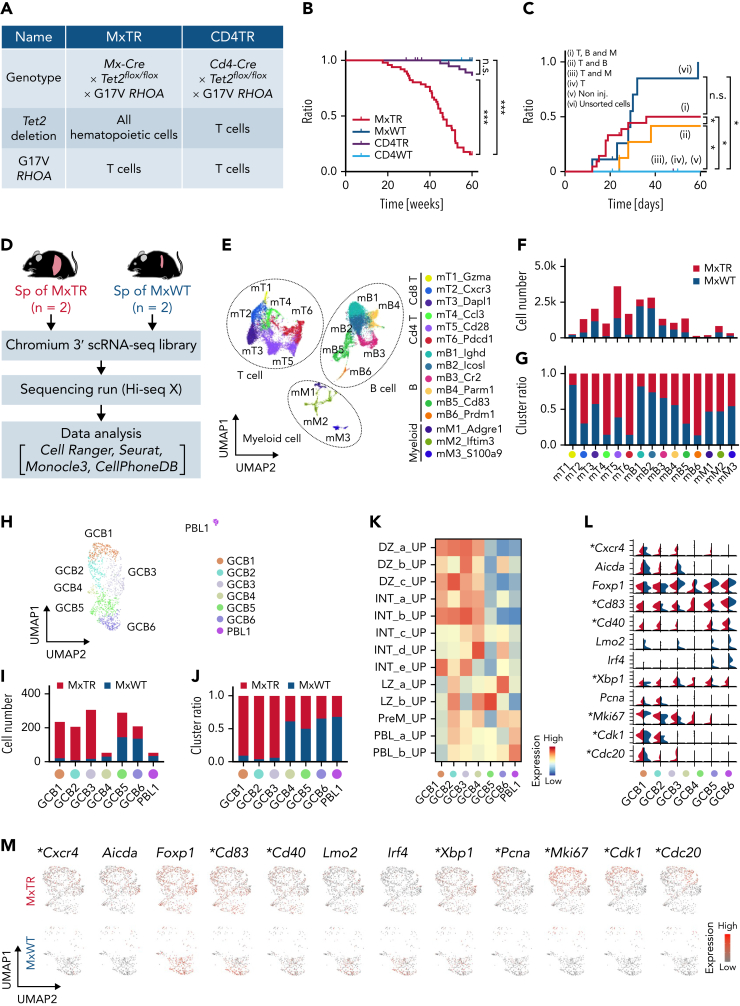
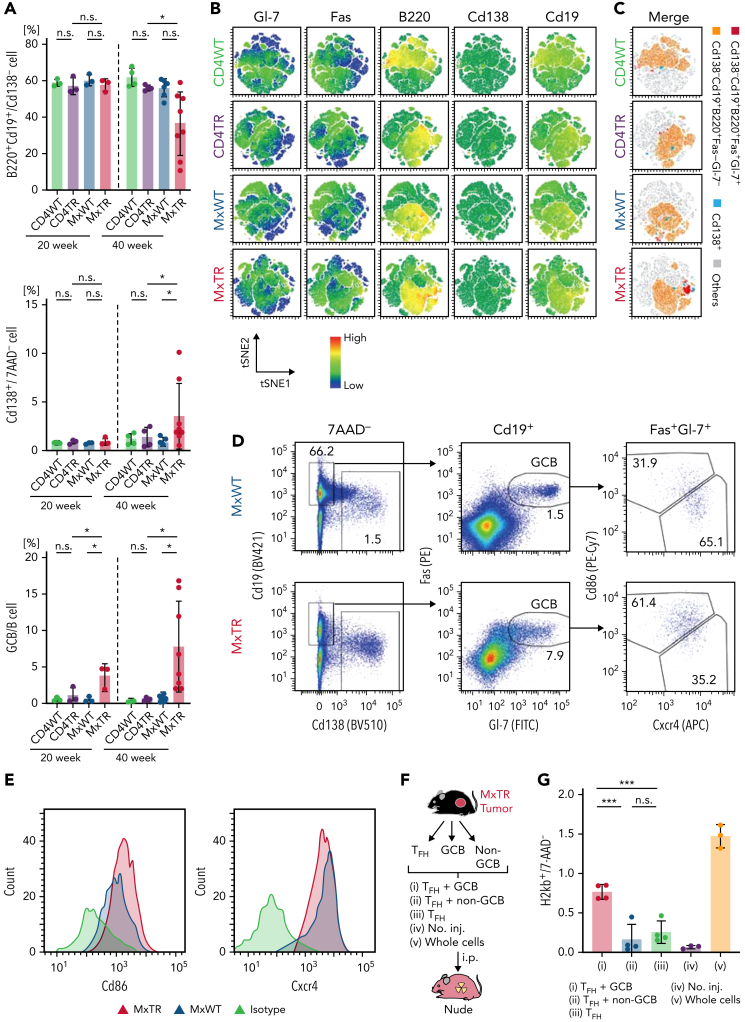
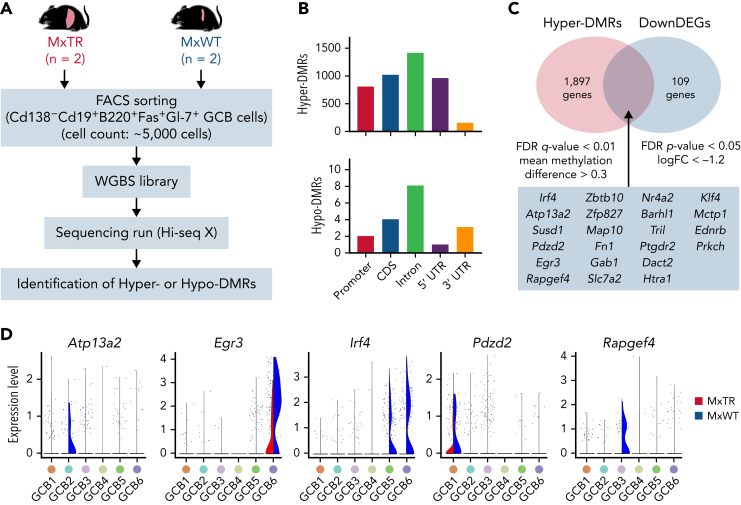
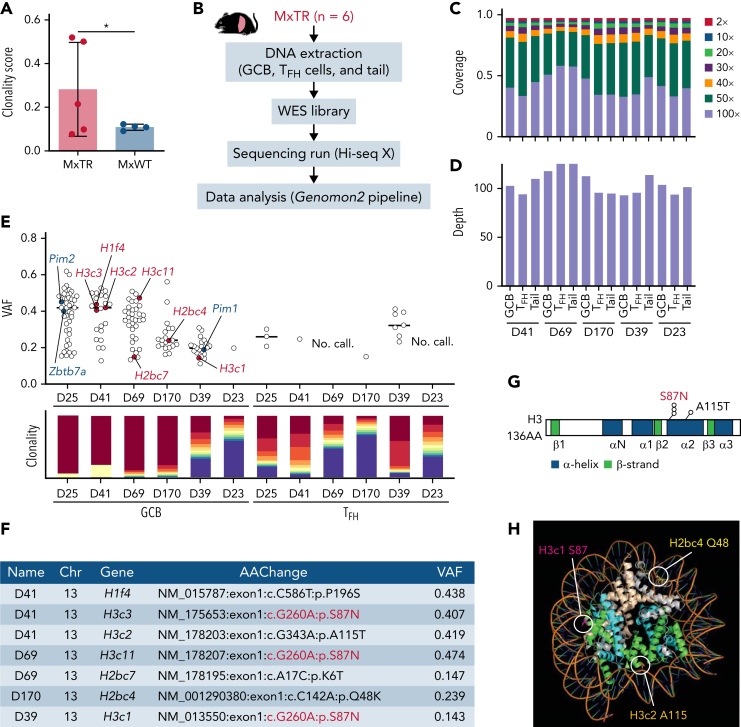
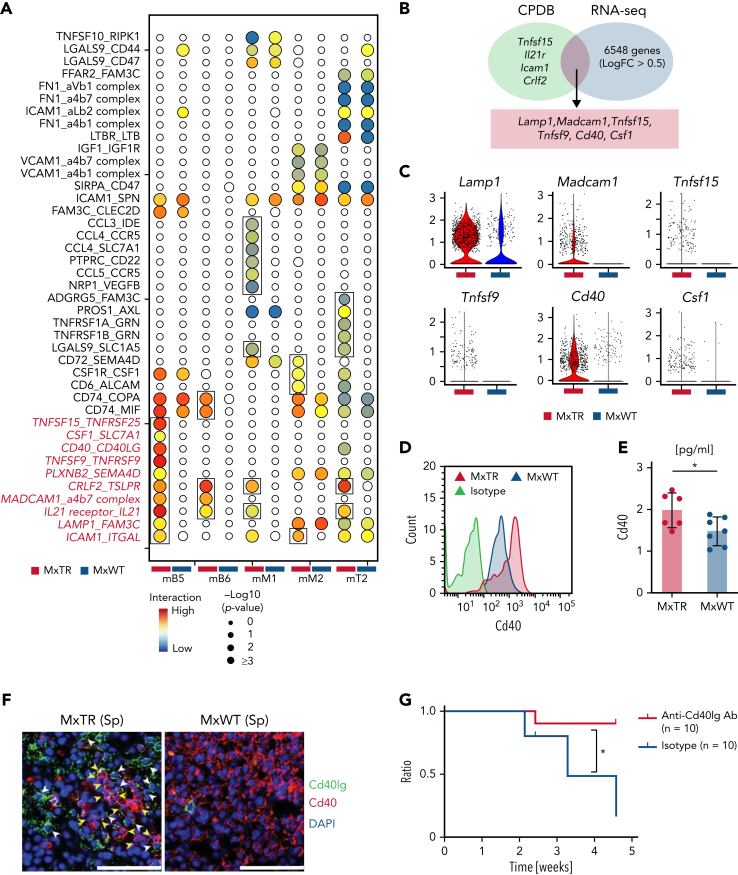
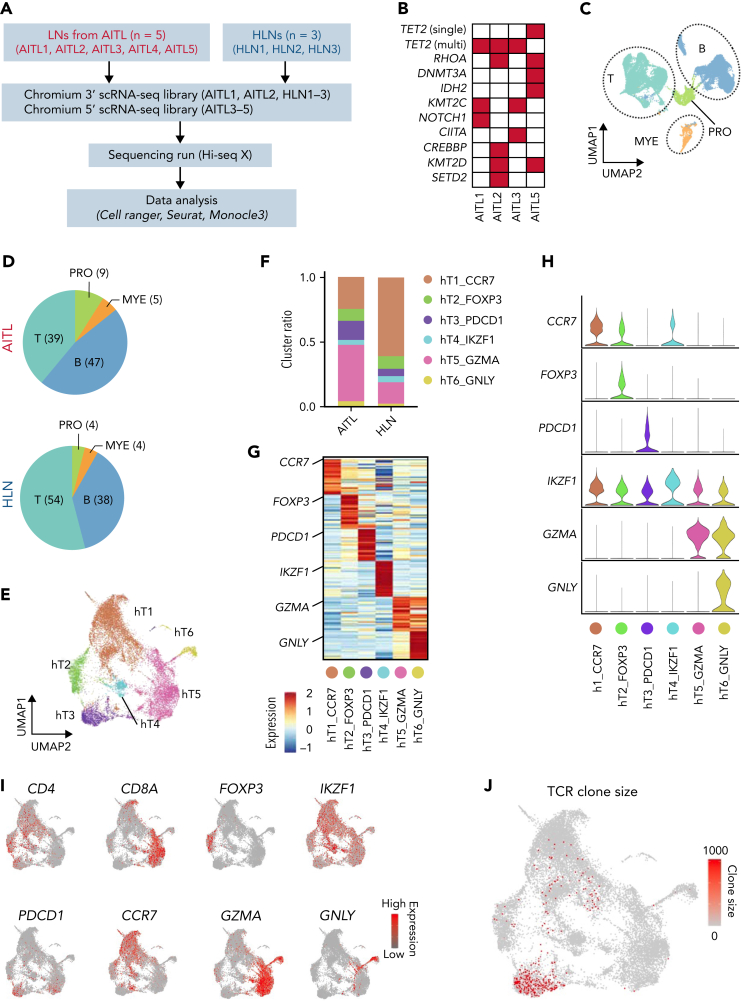
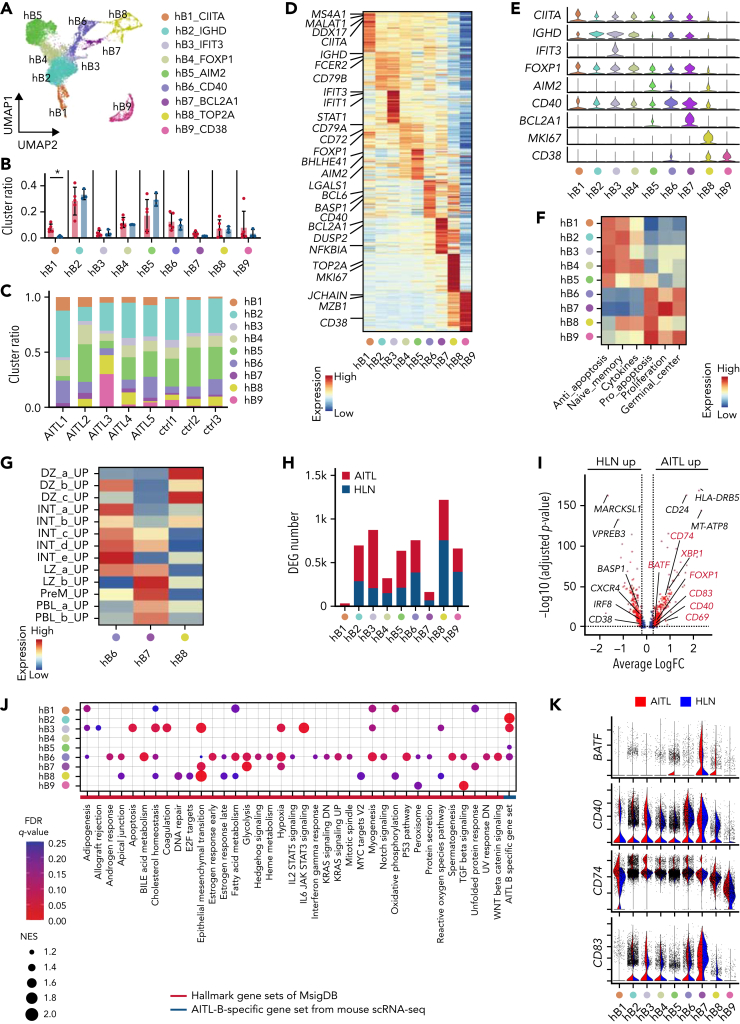
Angioimmunoblastic T-cell lymphoma (AITL) is proposed to be initiated by age-related clonal hematopoiesis (ACH) with TET2 mutations, whereas the G17V RHOA mutation in immature cells with TET2 mutations promotes the development of T follicular helper (TFH)-like tumor cells. Here, we investigated the mechanism by which TET2-mutant immune cells enable AITL development using mouse models and human samples. Among the 2 mouse models, mice lacking Tet2 in all the blood cells (Mx-Cre × Tet2flox/flox × G17V RHOA transgenic mice) spontaneously developed AITL for approximately up to a year, while mice lacking Tet2 only in the T cells (Cd4-Cre × Tet2flox/flox × G17V RHOA transgenic mice) did not. Therefore, Tet2-deficient immune cells function as a niche for AITL development. Single-cell RNA-sequencing (scRNA-seq) of >50 000 cells from mouse and human AITL samples revealed significant expansion of aberrant B cells, exhibiting properties of activating light zone (LZ)-like and proliferative dark zone (DZ)-like germinal center B (GCB) cells. The GCB cells in AITL clonally evolved with recurrent mutations in genes related to core histones. In silico network analysis using scRNA-seq data identified Cd40-Cd40lg as a possible mediator of GCB and tumor cell cluster interactions. Treatment of AITL model mice with anti-Cd40lg inhibitory antibody prolonged survival. The genes expressed in aberrantly expanded GCB cells in murine tumors were also broadly expressed in the B-lineage cells of TET2-mutant human AITL. Therefore, ACH-derived GCB cells could undergo independent clonal evolution and support the tumorigenesis in AITL via the CD40-CD40LG axis.


Conflict of interest statement

Conflict-of-interest disclosure: The authors declare no competing financial interests.

Figures

None
Graphical abstract
Figure 1.
Figure 1.
Tet2 loss accelerates the development of TFH-like lymphomas in all immune cells. (A) Characteristics of the 2 genotypes. (B) Overall survival of mice with the 2 genotypes. ∗∗∗P value < .005; n.s., not significant. (C) Cumulative incidence of engraftment in nude mice injected in 6 different suspensions. ∗P value < .05. (D) Overview of scRNA-seq in spleen cells; MxTR, n = 2; and MxWT, n = 2. (E) UMAP plot after integration of data from spleen cells of MxTR and MxWT. Three cell types are indicated by dashed lines. Bar graphs indicating the (F) numbers and (G) proportions of cells in each cluster. (H) UMAP plots showing reclustering of mB5 cluster. The bar graphs show (I, left) the number of cells and (J, right) the percentages in each cluster. (K) GSVA with GCB-related gene sets for each mB5 subcluster. (L) Stacked violin plot split and (M) feature plots showing GCB markers. ∗Genes highly expressed in GCB1 to 3 of MxTR compared to those of MxWT.
Figure 2.
Figure 2.
Flow cytometric analysis of B-lineage cells and transplantation of TFH-tumor and GCB cells from the spleen of tumor-bearing MxTR. (A) Proportions of B220+Cd19+/Cd138 cells, Cd138+/7AAD cells, and Cd138B220+Cd19+Fas+Gl-7+ (GCB)/B cells in the spleen from mice with the indicated genotypes at 20 and 40 weeks of age. MxTR, n = 6; MxWT, n = 4; CD4TR, n = 4; and CD4WT, n = 5. (B) Representative t-Distributed Stochastic Neighbor Embedding (tSNE) plots of flow cytometric data from B-cell fractions in the spleen of mice of the indicated genotypes at 40 weeks of age. B-lineage markers, including Gl-7, Fas, B220, Cd138, and Cd19. (C) tSNE plots of manually gated and integrated Cd138Cd19+B220+Fas+Gl-7+ (red), Cd138Cd19+B220+FasGl-7 (orange), Cd138+ (light blue) cells, and others (gray) using data from Figure 2B. (D) Representative flow cytometry plots of Cd138, Cd19, Fas, Gl-7, Cxcr4, and Cd86 in spleen cells from tumor-bearing MxTR and MxWT at ∼50 weeks of age. (E) Histogram of Cd86 or Cxcr4 expression of GCB fractions in spleen cells from tumor-bearing MxTR and MxWT. (F) Workflows of transplant experiments with GCB and TFH cells sorted from tumors of MxTR transplanted into nude mice. i.p., intraperitoneal injection; no. inj., no injection. (G) Proportions of H2kb+ donor-derived cells in spleen cells of the indicated groups on day 7 after injection. Five groups (i–v) represent (i) TFH + GCB cells, (ii) TFH + non-GCB cells, (iii) TFH cells, (iv) no. inj., and (v) whole cells. ∗∗∗P value < .001; n.s., not significant.
Figure 3.
Figure 3.
WGBS for GCB cells sorted from tumor-bearing MxTR and MxWT. (A) Overview of WGBS for GCB cells in the spleen from tumor-bearing MxTR (n = 2) and MxWT (n = 2) mice. FACS, fluorescence-activated cell sorting. (B) Distribution of hyper-DMRs (upper) and hypo-DMRs (bottom) in promoter, CDS, intron, 5′ UTR, and 3′ UTR. CDS, coding sequence. (C) Venn diagrams of hyper-DMRs from WGBS and downregulated DEG (DownDEGs)from corresponding RNA-seq analyses described in supplemental Figure 7. Cutoff: false discovery rate(FDR) q-value < 0.01, mean methylation difference > 0.3 (hyper-DMRs); FDR P-value < .05, logFC < −1.2 (DownDEGs). (D) Violin plots of 5 genes (Atp13a2, Egr3, Irf4, Pdzd2, and Rapgef4) downregulated in the GCB1 to 6 clusters of MxTR.
Figure 4.
Figure 4.
GCB cells clonally expand in the microenvironment of TFH-like lymphomas. (A) Clonality score of genes in RNA-seq data from GCB cells. ∗P value < .05. (B) Overview of whole-exome sequencing (WES) for GCB, TFH cells in the spleen, and tail from MxTR (n = 6). (C) The percentage of targeted bases covered by at least 2×, 10×, 20×, 30×, 40×, 50×, and 100× sequencing reads and (D) average read depth by WES are shown for 5 paired samples from GCB, TFH cells, and tail. (E) Variant allele frequencies (VAFs) of mutations detected using WES (upper). Red, mutations in histone genes; blue, mutations equivalent to those of human DLBCL. Rearrangements of immunoglobulin heavy locus genes or T-cell receptor genes identified in WES data from each sample of sorted GCB or TFH cells, respectively (lower). Each of the top 10 sequences is represented using a different color (red to blue), and the less frequent clones are represented in violet. (F) List of mutations in histone genes in GCB cells. Chr, chromosome; AAChange, amino acid change. (G) Positions of somatic mutations in histone 3 (H3). AA, amino acid. (H) Crystal structure of the nucleosome core particle containing 8 histone proteins and double-stranded DNA, modified from PDB ID: 1U35 by the PyMOL program (Schrödinger). Orthologous positions of 3 mutants discovered in GCB cells from MxTR are highlighted (Q48 in Hb2bc, S87 in H3c1, and A115 in H3c2). The DNA strands are colored orange; gray, H2a; light brown, H2b; green, H3; and light blue, H4.
Figure 5.
Figure 5.
Identification and functional analysis of significant ligand–receptor pairs potentially underlying GCB/TFH tumor cell cluster interactions. (A) Interactome landscape across immune and TFH tumor cell clusters. Circle size indicates a negative log10 of the adjusted P value. Circles are colored only in subclusters with a significant P value. Significant interactions observed only in the MxTR are indicated by squares. (B) Venn diagrams of significant markers in MxTR between mB5 and mT6 (green) and markers upregulated in GCB cells of MxTR (blue) data. CPDB, CellPhoneDB. (C) Violin plots of 6 markers shared by CPDB and RNA-seq. (D) Histograms showing cell surface Cd40 expression in GCB cells. (E) Bar plots of Cd40 concentrations in serum. ∗P value < .05. (F) Immunofluorescence staining of spleen tissue. Green, Cd40lg (white arrowheads); red, Cd40 (yellow arrowheads); and blue, DAPI. Scale bars, 50 μm. (G) Survival curves for anti-Cd40lg antibody or isotype-treated mice. Anti-Cd40lg antibody-treated mice, n = 10; isotype-treated mice, n = 10. Ab, antibody. ∗P value < .05.
Figure 6.
Figure 6.
Transcriptomic heterogeneity of human AITL samples analyzed at single-cell resolution. (A) Overview of scRNA-seq for AITL (n = 5) and homeostatic lymph nodes (HLNs, n = 3). (B) List of somatic mutations detected using WES in AITL tissues. (C) UMAP plot after integrating the scRNA-seq data of AITL and HLN. Three lineage clusters (T cells [T]; B cells [B]; and myeloid cells [MYE]) and a cluster characterized by proliferative markers (PRO) are indicated by dashed circles. (D) Pie graphs showing the proportions of each cluster in the AITL and HLN. Numbers in parentheses indicate the percentages of each cluster. (E) UMAP plot of T-cell subclusters sorted in silico after integrating scRNA-seq data of AITL and HLN samples. Six subclusters were labeled with different colors. (F) Bar graphs showing the percentages of each T-cell subcluster in the AITL or HLN samples. (G) Heatmap of the top 50 conserved markers in each T-cell subcluster from (E). (H) Stacked violin plots showing specific conserved markers expressed in each cluster. (I) Feature plots showing CD4, CD8A, and specific markers for each T-cell subcluster. (J) UMAP plot depicting TCR clone size for each clonotype.
Figure 7.
Figure 7.
Human AITL samples exhibit intratumoral B cells phenotypically similar to mouse GCB cells. (A) UMAP plot of B-cell subclusters sorted in silico after integrating scRNA-seq data of AIT L and HLN samples. Nine subclusters were labeled with different colors. (B) Bar plots indicating percentages of each cluster. (C) Bar graphs indicating the percentage of each cluster in indicated samples. (D) Heatmap of the top 50 conserved markers of each cluster in (A). (E) Stacked violin plots showing specific conserved markers expressed in each cluster. (F) Heatmap showing pathways differentially enriched at each B-cell cluster (hB1 to 9) based on GSVA with B-lineage-related genes from Chung and colleagues. Gene sets are listed in supplemental Table 8. (G) Heatmap showing pathways differentially enriched in hB6 to 8 based on GSVA with GCB-cell–associated genes, from Holmes and colleagues. Gene sets are listed in supplemental Table 8. (H) Bar graphs showing the number of DEGs in the AIT L or HLN samples. (I) Volcano plot of DEGs in hB6. Genes in red are included among AIT L-B–specific gene set. (J) Dot plots showing pathways upregulated in hB1 to 9 of AIT L by GSEA with hallmark and AIT L-B–specific gene sets. Dot size indicates the normalized enrichment score (NES). Cutoff, FDR q-value <0.25. (K) Violin plots of genes included in the AIT L-B–specific gene set.

Comment in

References

    1. Jaiswal S, Fontanillas P, Flannick J, et al. Age-related clonal hematopoiesis associated with adverse outcomes. N Engl J Med. 2014;371(26):2488–2498. - PMC - PubMed
    1. Coombs CC, Zehir A, Devlin SM, et al. Therapy-related clonal hematopoiesis in patients with non-hematologic cancers is common and associated with adverse clinical outcomes. Cell Stem Cell. 2017;21(3):374–382. e4. - PMC - PubMed
    1. Pan W, Zhu S, Qu K, et al. The DNA methylcytosine dioxygenase Tet2 sustains immunosuppressive function of tumor-infiltrating myeloid cells to promote melanoma progression. Immunity. 2017;47(2):284–297. e5. - PMC - PubMed
    1. Nguyen YTM, Fujisawa M, Nguyen TB, et al. Tet2 deficiency in immune cells exacerbates tumor progression by increasing angiogenesis in a lung cancer model. Cancer Sci. 2021;112(12):4931–4943. - PMC - PubMed
    1. Swerdlow SH, Campo E, Harris NL, et al. In: World Health Organization Classification of Tumours. 4th ed. Swerdlow SH, Campo E, Harris NL, et al., editors. Vol. 2. IARC; Lyon, France: 2017. WHO classification of tumours of haematopoietic and lymphoid tissues. (Revised).

Publication types