. 2022 Nov 3;140(18):1951-1963.
doi: 10.1182/blood.2022015646.

Genome-wide CRISPR screens identify CD48 defining susceptibility to NK cytotoxicity in peripheral T-cell lymphomas

Affiliations

Genome-wide CRISPR screens identify CD48 defining susceptibility to NK cytotoxicity in peripheral T-cell lymphomas

Masahiro Chiba et al. Blood. .

Abstract

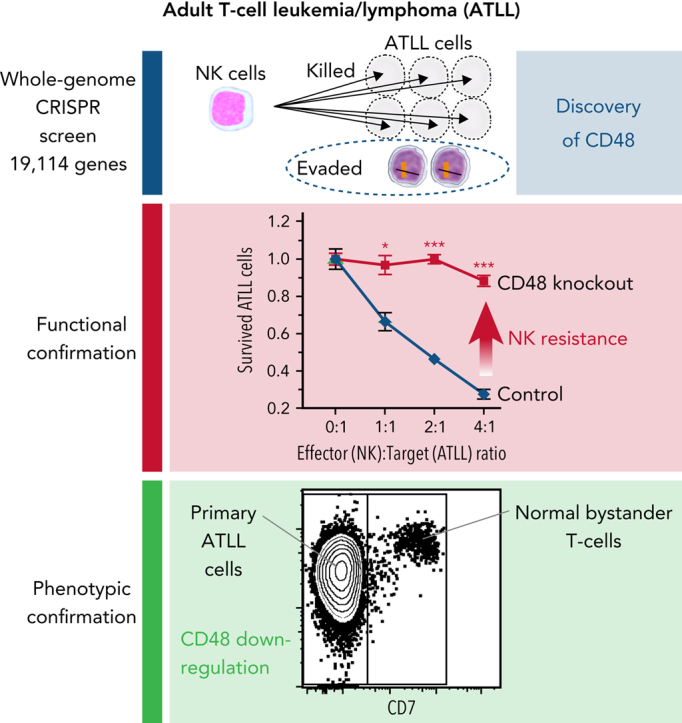
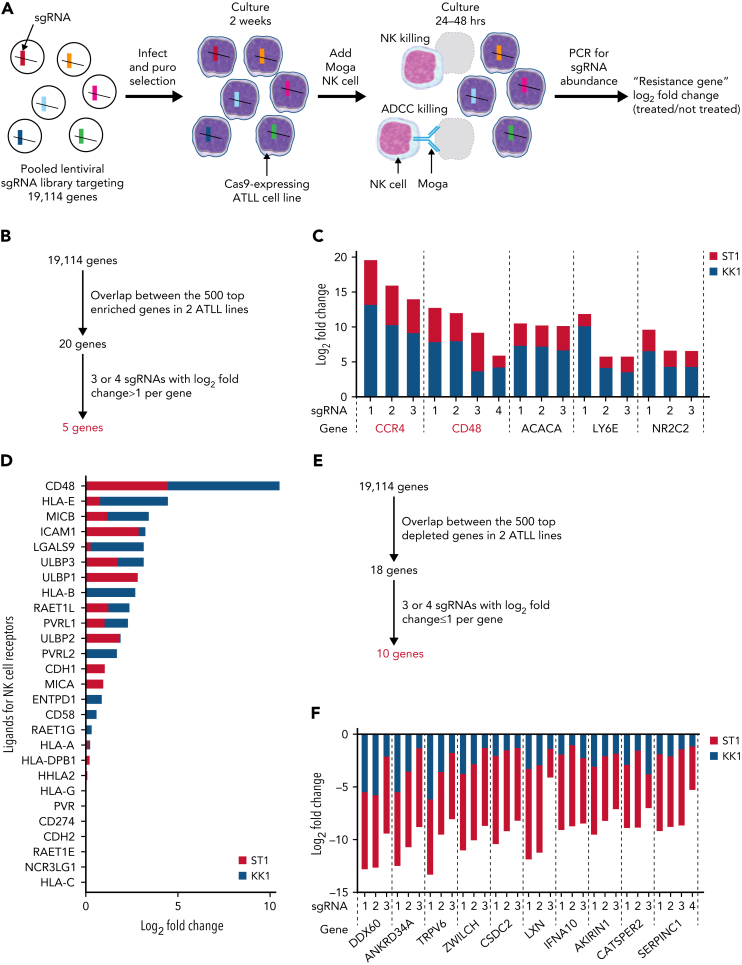
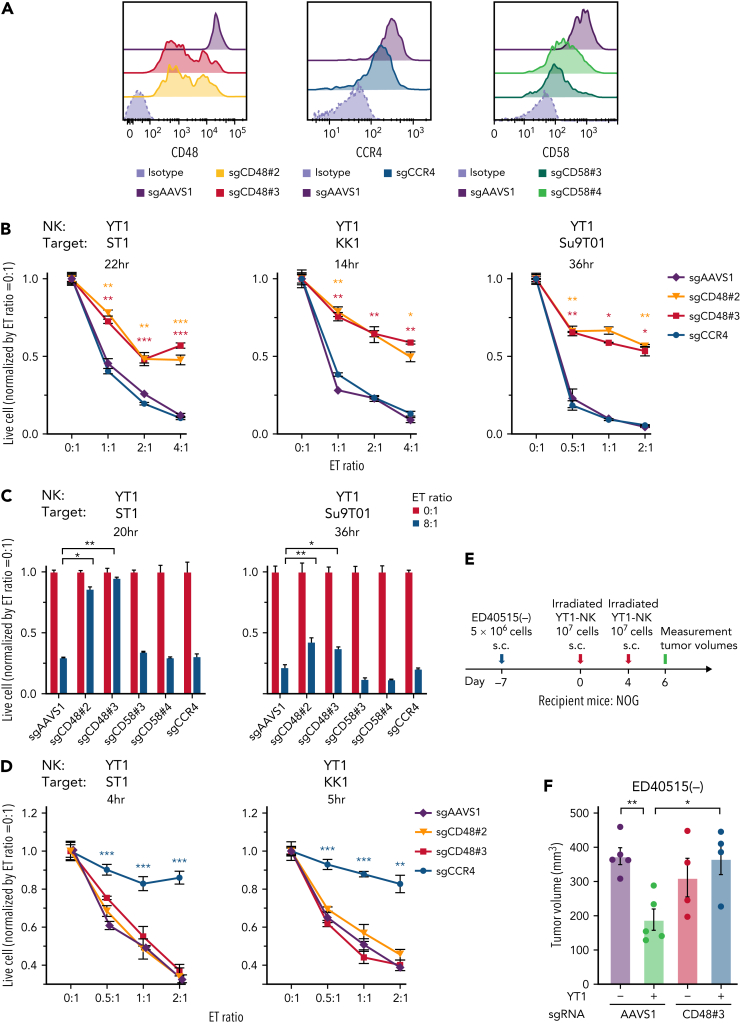
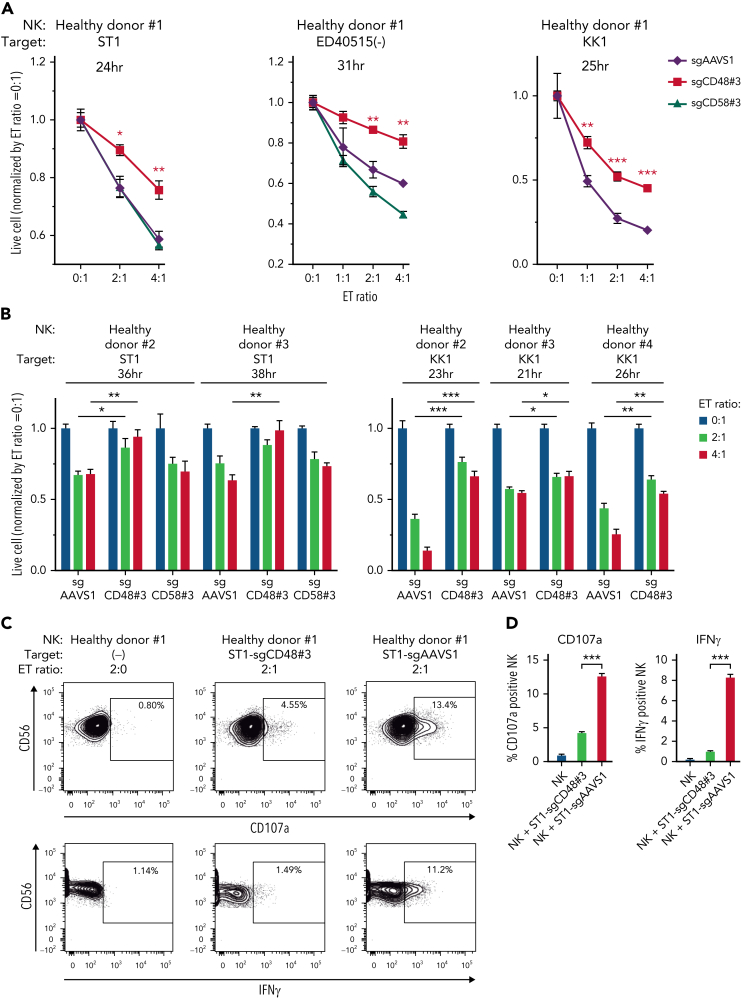
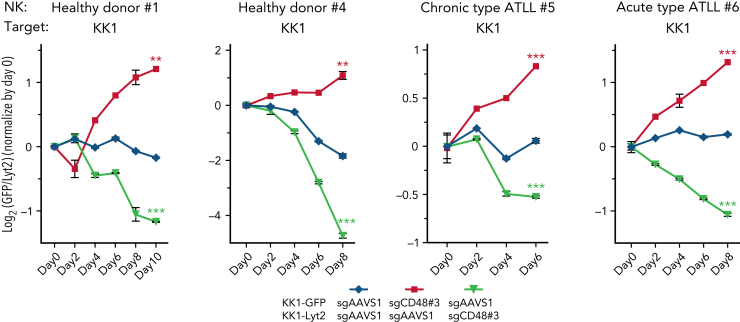
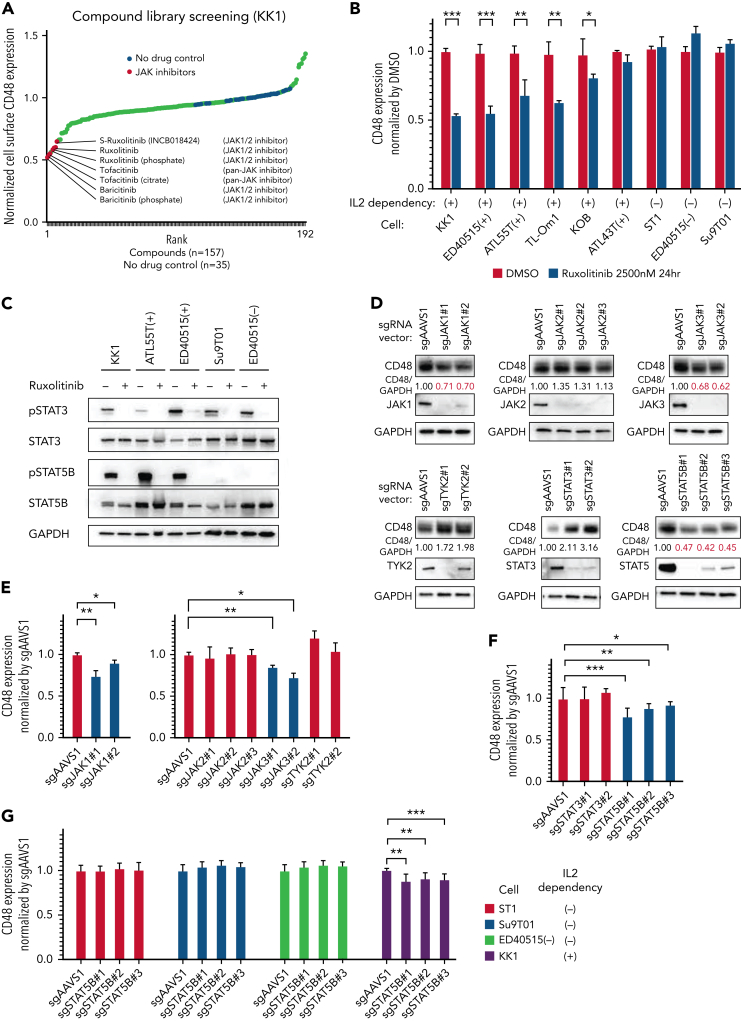
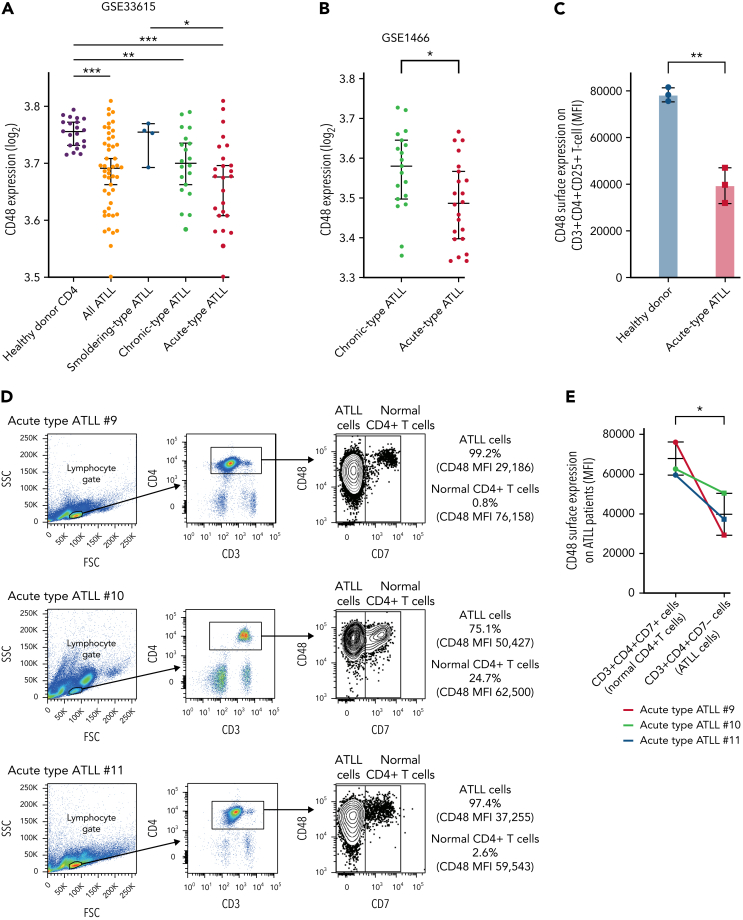
Adult T-cell leukemia/lymphoma (ATLL) is one of the aggressive peripheral T-cell neoplasms with a poor prognosis. Accumulating evidence demonstrates that escape from adaptive immunity is a hallmark of ATLL pathogenesis. However, the mechanisms by which ATLL cells evade natural killer (NK)-cell-mediated immunity have been poorly understood. Here we show that CD48 expression in ATLL cells determines the sensitivity for NK-cell-mediated cytotoxicity against ATLL cells. We performed unbiased genome-wide clustered regularly interspaced short palindromic repeat (CRISPR) screening using 2 ATLL-derived cell lines and discovered CD48 as one of the best-enriched genes whose knockout conferred resistance to YT1-NK cell line-mediated cytotoxicity. The ability of CD48-knockout ATLL cells to evade NK-cell effector function was confirmed using human primary NK cells with reduced interferon-γ (IFNγ) induction and degranulation. We found that primary ATLL cells had reduced CD48 expression along with disease progression. Furthermore, other subgroups among aggressive peripheral T-cell lymphomas (PTCLs) also expressed lower concentrations of CD48 than normal T cells, suggesting that CD48 is a key molecule in malignant T-cell evasion of NK-cell surveillance. Thus, this study demonstrates that CD48 expression is likely critical for malignant T-cell lymphoma cell regulation of NK-cell-mediated immunity and provides a rationale for future evaluation of CD48 as a molecular biomarker in NK-cell-associated immunotherapies.


Conflict of interest statement

Conflict-of-interest disclosure: The authors declare no competing financial interests.

Figures

None
Graphical abstract
Figure 1.
Figure 1.
A CRISPR library screen identifies ATLL cell-intrinsic molecules for immune escape from YT1–NK cell line-mediated cytotoxicity. (A) Schematic design of CRISPR library screening in this study. Two Cas9-expressing ATLL cell lines, ST1 and KK1, were analyzed. (B) Selection criteria for ATLL cell-intrinsic genes whose knockout lead to escape from NK cytotoxicity. (C) Log2 fold changes (treated/not treated) of single guide RNAs (sgRNAs) targeting selected resistance genes. (D) Log2 fold changes (treated/not treated) of known NK-cell receptor ligands in our screening. (E) Selection criteria for ATLL-cell–intrinsic genes whose knockout lead to sensitization of NK cytotoxicity. (F) Log2 fold changes (treated/not treated) of sgRNAs targeting selected sensitizing genes.
Figure 2.
Figure 2.
CD48 knockout renders ATLL cells resistant to YT1-mediated direct cytotoxicity. (A) Cell surface expression of CD48, CCR4, and CD58. Mean fluorescence intensity were evaluated in the sgRNA-transduced ST1 ATLL cells by flow cytometry. (B) Normalized live-cell numbers of sgRNA-transduced ATLL cells under the cocultivation with YT1. After the indicated incubation times, numbers of the live target ATLL cells were determined with flow cytometry by gating on propidium iodide cells representing live cells and by gating on GFP+ cells representing sgRNA-transduced ATLL cells, which excluded GFP-negative effector YT1 cells. The number of beads normalized the number of live cells. The numbers at different E:T ratios were normalized by the one at the E:T ratio of 0:1. (C) Normalized live-cell numbers of sgCD58-transduced ATLL cells under the cocultivation with YT1. sgAAVS1-, sgCD48-, and sgCCR4-transduced ATLL cells are also shown for comparison. Data were obtained as shown in (B). (D) Normalized live-cell numbers of sgRNA-transduced ATLL cells under the cocultivation with YT1 in the presence of mogamulizumab. Data were obtained as shown in (B). (E) Schematic design of the animal study. (F) Tumor volume of irradiated YT1–NK-cell–treated or control tumors of ED40515(−) ATLL cells with sgAAVS1 or sgCD48#3 in NOG mice. Error bars represent the SEM of replicates. ∗P < .05, ∗∗P < .01, and ∗∗∗P < .001, Welch 2-sample t test. All experiments were repeated ≥2 times except for (F).
Figure 3.
Figure 3.
CD48 knockout renders ATLL cells resistant to direct cytotoxicity of primary NK cells isolated from healthy donors. (A-B) Normalized live-cell numbers of sgRNA-transduced ATLL cells under the cocultivation with primary NK cells isolated from (A) healthy donor #1 and from (B) healthy donors #2, #3, and #4. Data were obtained as shown in Figure 2B. (C) Expression of CD107a or IFNγ in primary NK cells detected by flow cytometry. NK cells from healthy donor #1 were cocultivated without ST1 or with sgCD48- or sgAAVS1-transduced ST1 for 6 hours. (D) The mean percentages of CD107a or IFNγ-positive NK cells shown in (C) were demonstrated by the bar graphs. Error bars represent the SEM of replicates. ∗P < .05, ∗∗P < .01, and ∗∗∗P < .001, Welch 2-sample t test. All experiments were repeated ≥2 times except for (B).
Figure 4.
Figure 4.
Long-term competitive assay clarifies strong survival advantage in CD48 knockout ATLL cells. Long-term competitive assay by using primary NK cells isolated from healthy donor #1, healthy donor #4, chronic-type ATLL patient #5, and acute-type ATLL patient #6. Cells were mixed every 2 days at an E:T ratio of 1:2. The ratios of the GFP+ and Lyt2+ populations were normalized to the value at day 0. Growth curves represent the mean of 3 replicates. Error bars represent the SEM of replicates. ∗∗P < .01, and ∗∗∗P < .001, Welch 2-sample t test.
Figure 5.
Figure 5.
STAT5 regulates CD48 expression in IL2-dependent ATLL cells. (A-B) Normalized cell surface CD48 expression by flow cytometry on (A) KK1 cells treated with compound library (2.5 μM) for 24 hours and (B) ATLL cell lines treated with ruxolitinib (2.5 μM) or dimethyl sulfoxide for 24 hours. (C) Immunoblot analysis of pSTAT3, STAT3, pSTAT5B, and STAT5B in ATLL cells treated with ruxolitinib (2.5 μM) for 24 hours. (D) Immunoblot analysis of CD48, JAK1, JAK2, JAK3, TYK2, STAT3, and STAT5B in sgJAK1, sgJAK2, sgJAK3, sgTYK2, sgSTAT3, and sgSTAT5B-transduced KK1 cells. The quantification of CD48 immunoblot bands, normalized to GAPDH and compared with sgAAVS1 control cells, is shown below the CD48 immunoblot. (E-F) Normalized cell surface CD48 expression on (E) sgJAK1, sgJAK2, sgJAK3, and sgTYK2, and (F) sgSTAT3- and sgSTAT5B-transduced KK1 cells. (G) Normalized cell surface CD48 expression by flow cytometry on sgSTAT5B-transduced ATLL cells. Error bars represent the SEM of replicates. ∗P < .05, ∗∗P < .01, and ∗∗∗P < .001, Welch 2-sample t-test.
Figure 6.
Figure 6.
CD48 expression concentrations were decreased in parallel with ATLL disease aggressiveness. (A) CD48 mRNA expression in CD4 T cells purified from peripheral blood of healthy donors (n = 21), smoldering-type ATLL (n = 4), chronic-type ATLL (n = 20), and acute-type ATLL (n = 26). Data were obtained through a publicly available microarray dataset GSE33615. (B) CD48 mRNA expression in CD4 T cells purified from peripheral blood of chronic-type ATLL (n = 19) and acute-type ATLL (n = 22) from another publicly available microarray dataset GSE1466. (C) Cell surface CD48 expression by flow cytometry on CD3+CD4+CD25+ T cells in healthy donors (n = 3; healthy donor #1, #7, and #8) and acute-type ATLL patients (n = 3; acute-type ATLL #9, #10, and #11). (D) Cell surface CD48 expression using flow cytometry on ATLL cells or normal bystander CD4+ T cells in 3 patients with acute ATLL (#9, #10, and #11). Representative dot plots are indicated for the gating strategy for ATLL cells (CD3+CD4+CD7) or normal bystander CD4+ T cells (CD3+CD4+CD7+). Mean fluorescence intensity (MFI) of CD48 was shown on the right side. (E) MFI of CD48 in ATLL cells or normal bystander CD4 T cells from (D) were plotted. (F) CD48 mRNA expression in CD4 T cells purified from peripheral blood of healthy donors (n = 20) and in lymph node biopsy samples of PTCL NOS (n = 144), AITL (n = 127), ALK ALCL (n = 69), ALK+ ALCL (n = 53), and ATLL (n = 16) from a publicly available microarray dataset. (G) Kaplan-Meier curve for overall survival in ALK ALCL with higher (n = 22) or lower (n = 15) CD48 expression values. The threshold was set as the median value of CD48 expression. P value of the log-rank test statistic is shown. Error bars represent median and 95% CI in (A), (B), and (F), and mean and 95% CI in (C) and (E). ∗P < .05, ∗∗P < .01, ∗∗∗P < .001, Welch 2-sample t-test.
Figure 6.
Figure 6.
CD48 expression concentrations were decreased in parallel with ATLL disease aggressiveness. (A) CD48 mRNA expression in CD4 T cells purified from peripheral blood of healthy donors (n = 21), smoldering-type ATLL (n = 4), chronic-type ATLL (n = 20), and acute-type ATLL (n = 26). Data were obtained through a publicly available microarray dataset GSE33615. (B) CD48 mRNA expression in CD4 T cells purified from peripheral blood of chronic-type ATLL (n = 19) and acute-type ATLL (n = 22) from another publicly available microarray dataset GSE1466. (C) Cell surface CD48 expression by flow cytometry on CD3+CD4+CD25+ T cells in healthy donors (n = 3; healthy donor #1, #7, and #8) and acute-type ATLL patients (n = 3; acute-type ATLL #9, #10, and #11). (D) Cell surface CD48 expression using flow cytometry on ATLL cells or normal bystander CD4+ T cells in 3 patients with acute ATLL (#9, #10, and #11). Representative dot plots are indicated for the gating strategy for ATLL cells (CD3+CD4+CD7) or normal bystander CD4+ T cells (CD3+CD4+CD7+). Mean fluorescence intensity (MFI) of CD48 was shown on the right side. (E) MFI of CD48 in ATLL cells or normal bystander CD4 T cells from (D) were plotted. (F) CD48 mRNA expression in CD4 T cells purified from peripheral blood of healthy donors (n = 20) and in lymph node biopsy samples of PTCL NOS (n = 144), AITL (n = 127), ALK ALCL (n = 69), ALK+ ALCL (n = 53), and ATLL (n = 16) from a publicly available microarray dataset. (G) Kaplan-Meier curve for overall survival in ALK ALCL with higher (n = 22) or lower (n = 15) CD48 expression values. The threshold was set as the median value of CD48 expression. P value of the log-rank test statistic is shown. Error bars represent median and 95% CI in (A), (B), and (F), and mean and 95% CI in (C) and (E). ∗P < .05, ∗∗P < .01, ∗∗∗P < .001, Welch 2-sample t-test.

References

    1. Matsuoka M, Jeang KT. Human T-cell leukaemia virus type 1 (HTLV-1) infectivity and cellular transformation. Nat Rev Cancer. 2007;7(4):270–280. - PubMed
    1. Kataoka K, Nagata Y, Kitanaka A, et al. Integrated molecular analysis of adult T cell leukemia/lymphoma. Nat Genet. 2015;47(11):1304–1315. - PubMed
    1. Nakagawa M, Shaffer AL, III, Ceribelli M, et al. Targeting the HTLV-I-regulated BATF3/IRF4 transcriptional network in adult T cell leukemia/lymphoma. Cancer Cell. 2018;34(2):286–297.e10. - PMC - PubMed
    1. Nakagawa M, Schmitz R, Xiao W, et al. Gain-of-function CCR4 mutations in adult T cell leukemia/lymphoma. J Exp Med. 2014;211(13):2497–2505. - PMC - PubMed
    1. Kataoka K, Shiraishi Y, Takeda Y, et al. Aberrant PD-L1 expression through 3′-UTR disruption in multiple cancers. Nature. 2016;534(7607):402–406. - PubMed

Publication types

MeSH terms