. 2023 Mar;19(3):966-983.
doi: 10.1080/15548627.2022.2109286. Epub 2022 Aug 13.

Mitophagy initiates retrograde mitochondrial-nuclear signaling to guide retinal pigment cell heterogeneity

Affiliations

Mitophagy initiates retrograde mitochondrial-nuclear signaling to guide retinal pigment cell heterogeneity

Sayantan Datta et al. Autophagy. 2023 Mar.

Abstract

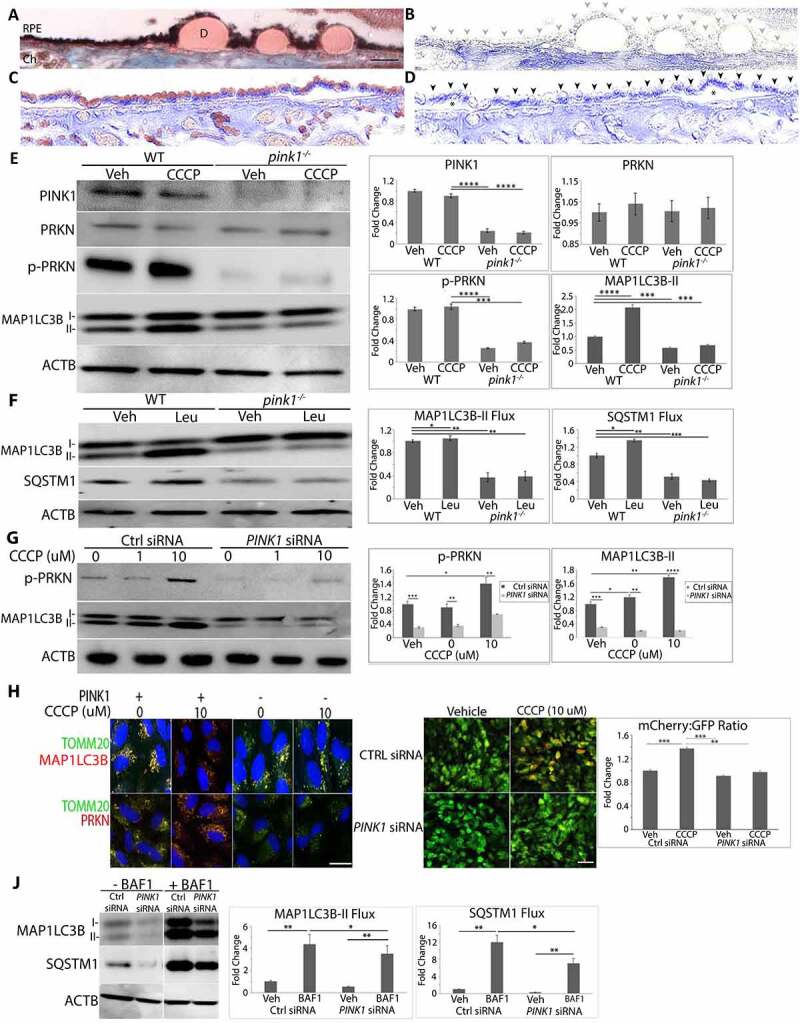
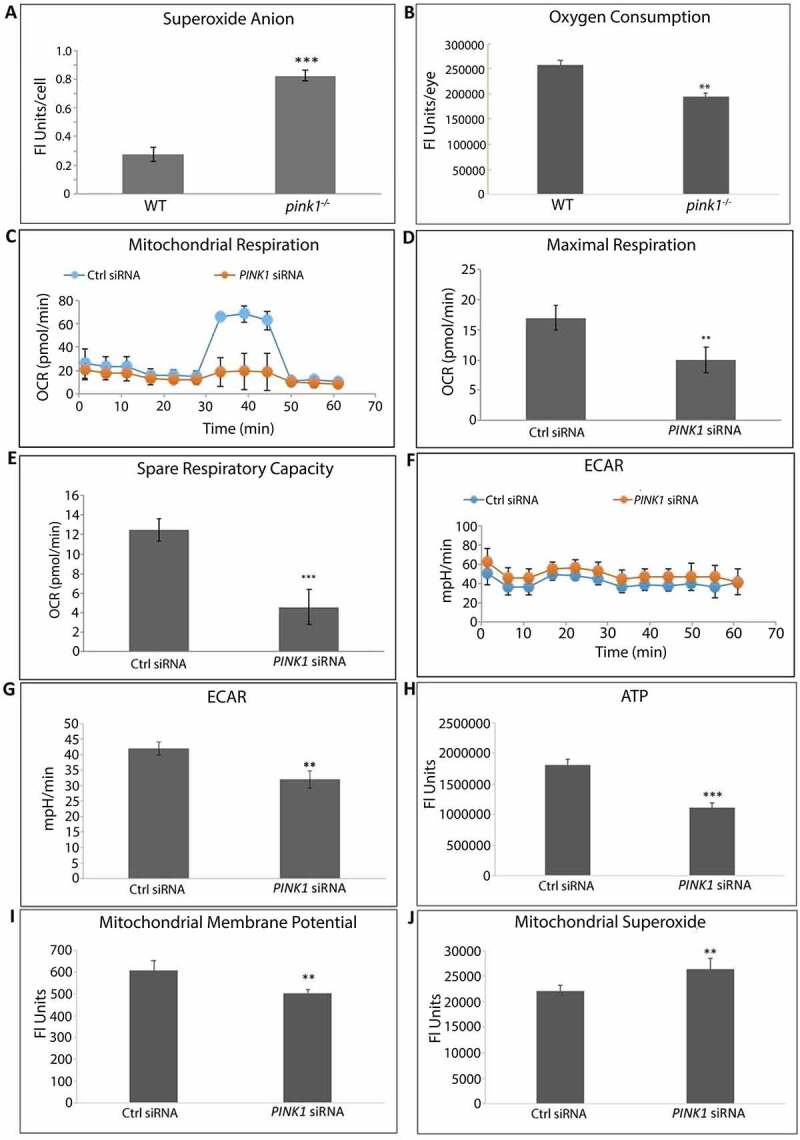
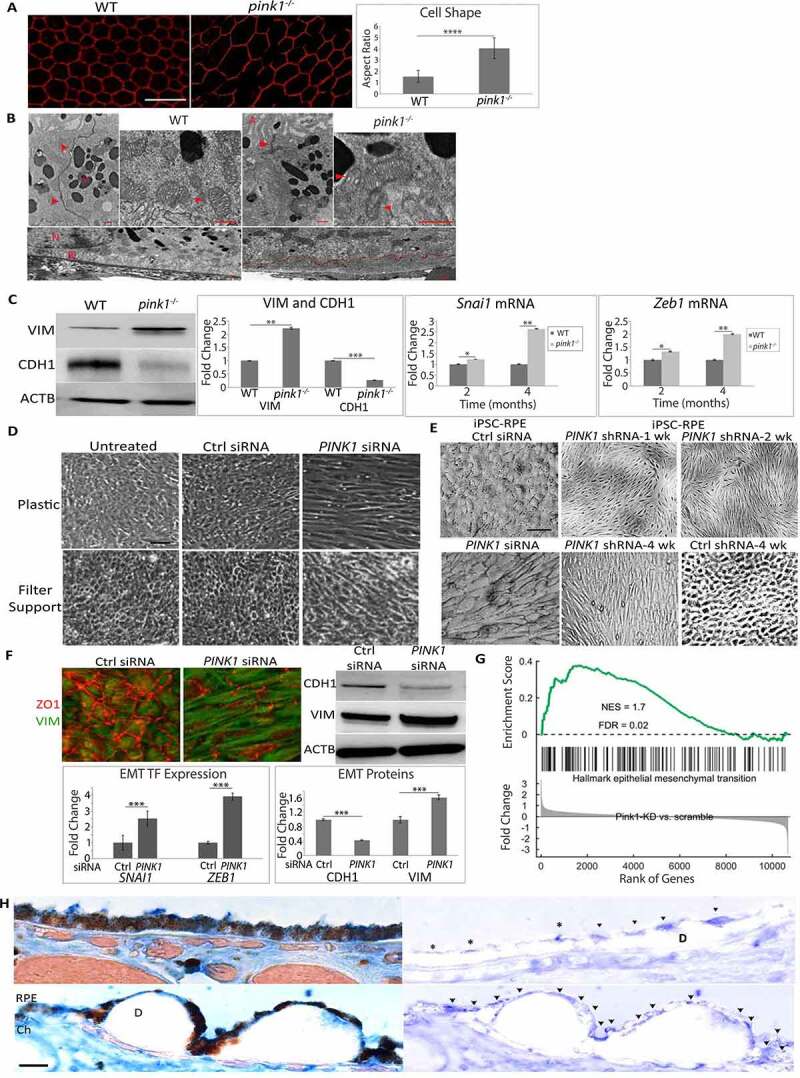
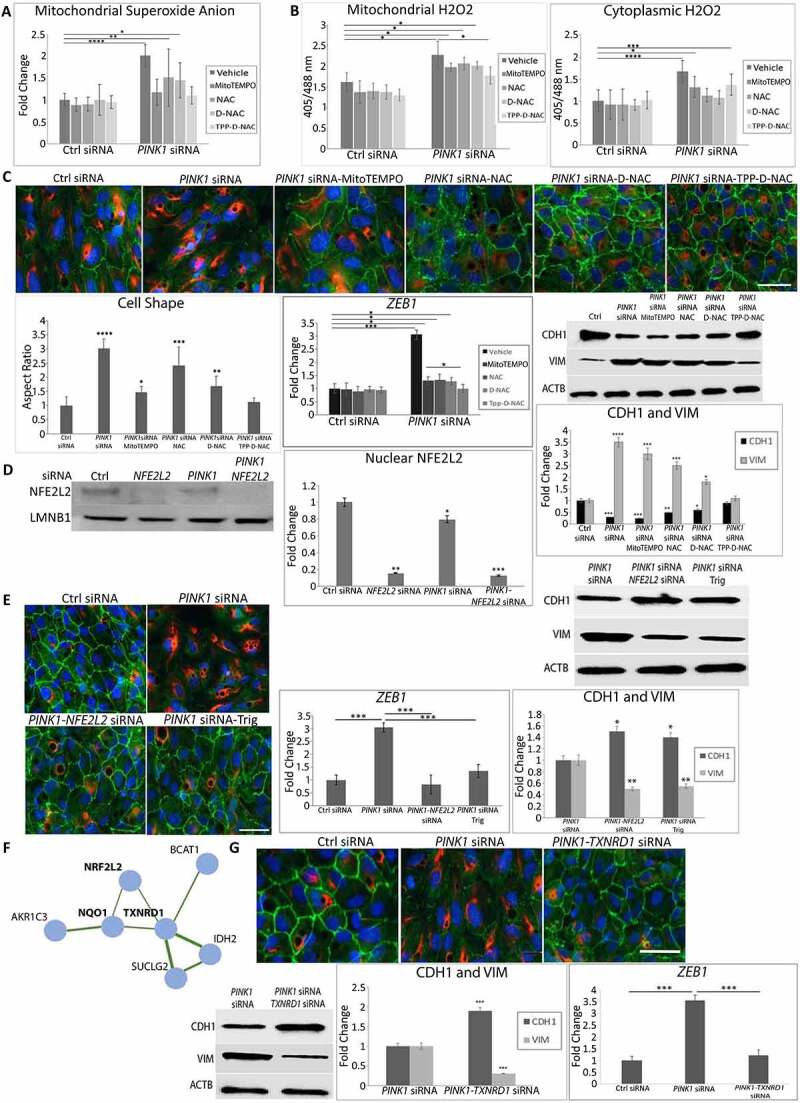
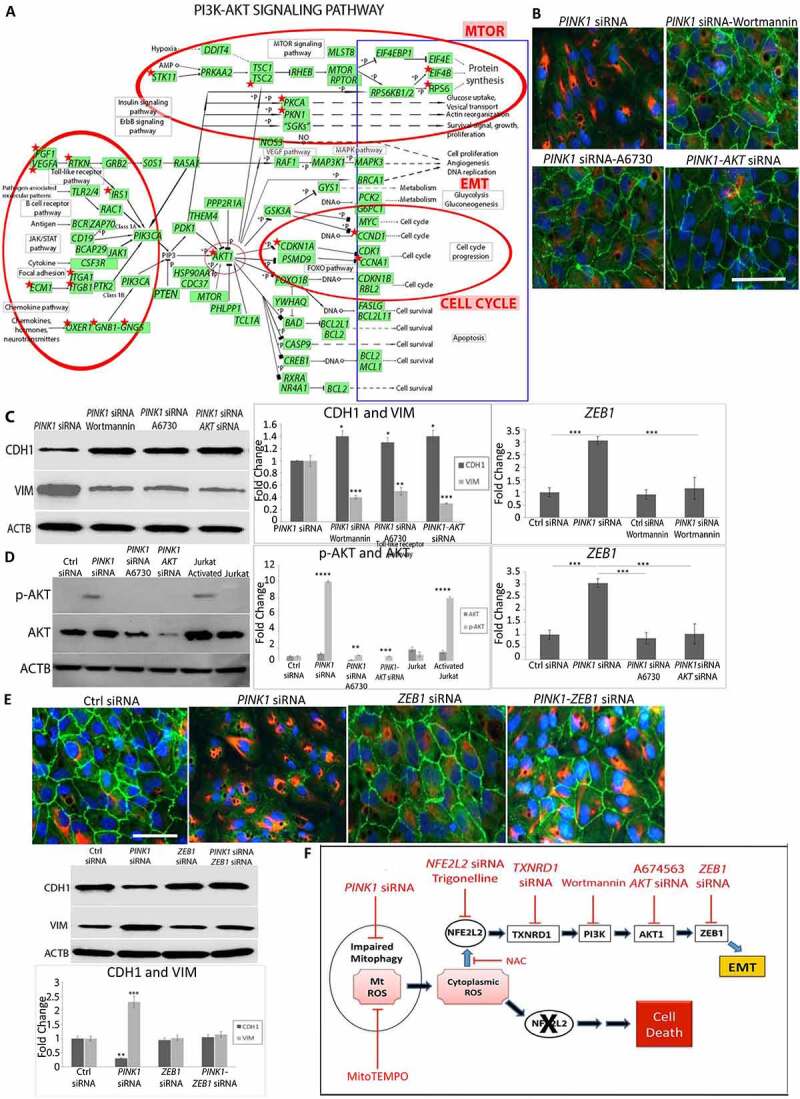
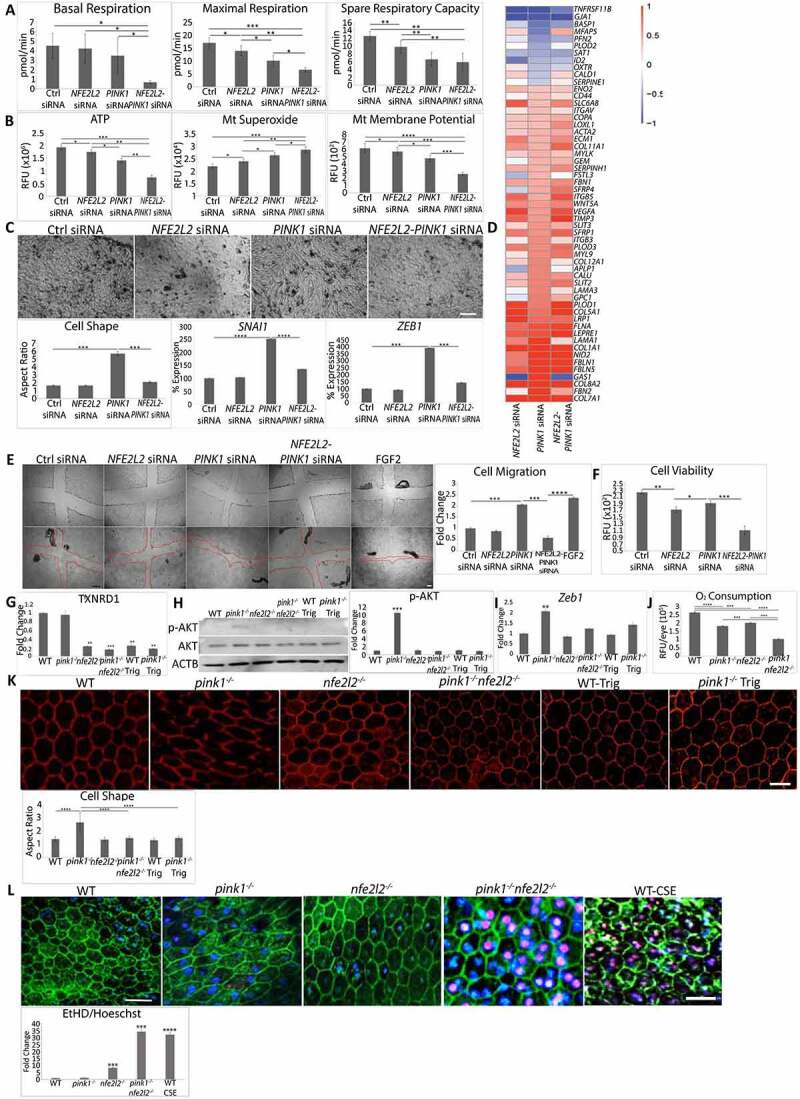
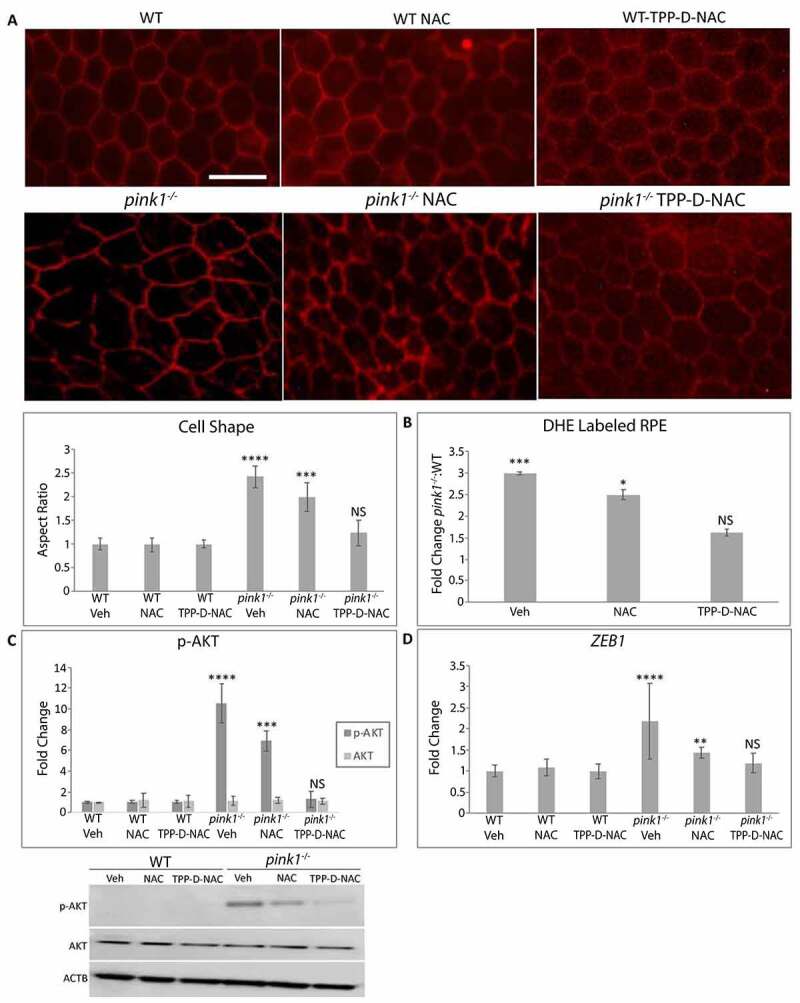
Age-related macular degeneration (AMD), the leading cause of blindness among the elderly, is without treatment for early disease. Degenerative retinal pigment epithelial (RPE) cell heterogeneity is a well-recognized but understudied pathogenic factor. Due to the daily phagocytosis of photoreceptor outer segments, unique photo-oxidative stress, and high metabolism for maintaining vision, the RPE has robust macroautophagy/autophagy, and mitochondrial and antioxidant networks. However, the autophagy subtype, mitophagy, in the RPE and AMD is understudied. Here, we found decreased PINK1 (PTEN induced kinase 1) in perifoveal RPE of early AMD eyes. PINK1-deficient RPE have impaired mitophagy and mitochondrial function that triggers death-resistant epithelial-mesenchymal transition (EMT). This reprogramming is mediated by novel retrograde mitochondrial-nuclear signaling (RMNS) through superoxide, NFE2L2 (NFE2 like bZIP transcription factor 2), TXNRD1 (thioredoxin reductase 1), and phosphoinositide 3-kinase (PI3K)-AKT (AKT serine/threonine kinase) that induced canonical transcription factors ZEB1 (zinc finger E-box binding homeobox 1) and SNAI1 (Snail family transcriptional repressor 1) and an EMT transcriptome. NFE2L2 deficiency disrupted RMNS that paradoxically normalized morphology but decreased function and viability. Thus, RPE heterogeneity is defined by the interaction of two cytoprotective pathways that is triggered by mitophagy function. By neutralizing the consequences of impaired mitophagy, an antioxidant dendrimer tropic for the RPE and mitochondria, EMT (a recognized AMD alteration) was abrogated to offer potential therapy for early AMD, a stage without treatment.Abbreviations: ACTB: actin beta; AKT: AKT serine/threonine kinase; AMD: age-related macular degeneration; CCCP: cyanide m-chlorophenyl hydrazone; CDH1: cadherin 1; DAVID: Database for Annotation, Visualization and Integrated Discovery; DHE: dihydroethidium; D-NAC: N-acetyl-l-cysteine conjugated to a poly(amido amine) dendrimer; ECAR: extracellular acidification rate; EMT: epithelial-mesenchymal transition; GAPDH: glyceraldehyde-3-phosphate dehydrogenase; GSEA: Gene Set Enrichment Analysis; HSPD1: heat shock protein family D (Hsp60) member 1; IVT: intravitreal; KD: knockdown; LMNA, lamin A/C; MAP1LC3B: microtubule associated protein 1 light chain 3 beta; MMP: mitochondrial membrane potential; NAC: N-acetyl-l-cysteine; NQO1: NAD(P)H quinone dehydrogenase 1; NFE2L2: NFE2 like bZIP transcription factor 2; O2-: superoxide anion; OCR: oxygen consumption rate; PI3K: phosphoinositide 3-kinase; PINK1: PTEN induced kinase 1; RMNS: retrograde mitochondrial-nuclear signaling; ROS: reactive oxygen species; RPE: retinal pigment epithelium; SNAI1: snail family transcriptional repressor 1; TJP1: tight junction protein 1; TPP-D-NAC: triphenyl phosphinium and N-acetyl-l-cysteine conjugated to a poly(amido amine) dendrimer; TIMM23: translocase of inner mitochondrial membrane 23; TOMM20: translocase of outer mitochondrial membrane 20; Trig: trigonelline; TXNRD1: thioredoxin reductase 1; VIM: vimentin; WT: wild-type; ZEB1: zinc finger E-box binding homeobox 1.

Keywords: NFE2L2; PINK1; age-related macular degeneration; dendrimer; epithelial mesenchymal transition; heterogeneity; mitophagy; retinal pigment epithelium; retrograde mitochondrial-nuclear signaling.


Conflict of interest statement

JTH: Bayer Pharmaceuticals (received grant funding and royalties on unrelated project); Clover Pharmaceuticals (receives grant funding and for being on the Scientific Advisory Board on unrelated project), Seeing Medicines, Inc. (receives payment for being on Scientific Advisory Board on unrelated project)

KR: R.K. and his wife S. Kannan are co-founders and own shares of Ashvattha Therapeutics Inc. They have licensed more than 80 patents into Ashvattha and serve in the Board of Directors. As part of the licensing of inventions, they may receive royalties from sales of products. The conflict of interest is managed by Johns Hopkins University.

DS: receives grant funding from Astellas Pharma Inc., F. Hoffmann-La Roche Ltd., Generian Pharmaceuticals Inc, and UPMC Enterprises.

Figures

Figure 1.
Figure 1.
PINK1 immunolabeling in early AMD and its effect on mitophagy. (a) Perifoveal section from an 87 yo F with AMD (MGS2) with decreased PINK1 immunolabeling in the RPE. Ch, choroid; D, drusen; Bar: 25 μm. (b) Same image after Nuance correction to remove pigment. Grey arrowheads show RPE with weak PINK1 staining. (c) Perifoveal section from an 87 yo male without AMD with strong PINK1 labeling in the RPE. (d) After Nuance correction. Black arrowheads show RPE with strong PINK1 labeling. *indicates artifactitious RPE detachment from tissue preparation. (e) Western blot of mitophagy proteins in the RPE after WT and pink1−/− mice were given IVT 10 μM CCCP or vehicle (DMSO) and sacrificed after 4 h. (f) Western blot of mitophagy flux of MAP1LC3B conversion and SQSTM1 accumulation in the RPE after WT and pink1−/− mice were given 40 mg/kg lysosome inhibitor leupeptin or vehicle (DMSO) intraperitoneally and sacrificed after 4 h. (g) Western blot of mitophagy genes in ARPE-19 cells treated with control (ctrl) or PINK1 siRNA for 5 days and then exposed to 10 μM CCCP for 4 h. (h) PRKN and MAP1LC3B (both red) co-stained with mitochondrial TOMM20 (green) after CCCP in control and PINK-KD ARPE-19 cells. Bar: 10 μm (i). Control or PINK1-KD cells were transduced with adenovirus containing mCherry-eGFP-COX8A and then treated with 10 μM CCCP or vehicle. Control cells have prominent eGFP mitochondrial labeling. When mitochondrial injury is induced with CCCP to stimulate mitophagy, a shift to acid resistant mCherry labeling was seen in control cells, but not PINK1-KD cells treated with CCCP. Bar: 25 μm. The graph quantifies the mCherry:eGFP ratio (N = 30 cells; N = 3 experiments). (j). Western blot of mitophagy flux in PINK1-KD cells 4 h after 100 nM bafilomycin A1 or vehicle of MAP1LC3B conversion and SQSTM1 accumulation. ACTB was used for normalization. Band intensities were plotted as fold change. Mean ± SD, N = 3, Student’s t-test; * P < 0.05, **P < 0.01, ***P < 0.001, ****P < 0.0001.
Figure 2.
Figure 2.
PINK1 deficient cells exhibit mitochondrial dysfunction. (a) In WT and pink1−/− mice, sections were labeled with 5 μM DHE (dihydroethidium) and the number of superoxide stained cells per 50 cells were counted and plotted (N = 3). (b) In vivo oxygen consumption measured using Mito-ID oxygen consumption kit and plotted as fluorescence units per eye (N = 3). (c-g) Seahorse assay was used to measure mitochondrial respiration in ARPE-19 cells as a function of OCR over time (min) following serial injections of oligomycin, 2-(2-[4 {trifluoromethoxy}phenyl]hydrazinylidene)-propanedinitrile, and rotenone-antimycin. Maximal respiration was measured after 2-[2-[4 (trifluoromethoxy)phenyl]hydrazinylidene]-propanedinitrile injection and spare respiratory capacity was calculated by subtracting basal from maximal respiration. Glycolysis was measured as a function of ECAR (N = 5). (h) ATP was measured using CellTiter-Glo® Luminescent Assay in ARPE-19 cells and plotted as fluorescence units per well. (i) Mitochondrial membrane potential was measured after 20 nM Tetramethylrhodamine, Methyl Ester, Perchlorate treatment. (j) Mitochondrial superoxide was quantified using the MitoSOX (5 µM, 20 min; N = 3). Graphs show fluorescence units/well; OCR, oxygen consumption rate; ECAR, extracellular acidification rate; mean ± SD, Student’s t-test; * P < 0.05, **P < 0.01, ***P < 0.001.
Figure 3.
Figure 3.
PINK1 loss induces EMT in RPE cells. (a) RPE flatmount from a WT and pink1−/− mouse stained with anti-TJP1 (tight junction protein1) and imaged at 20X. Cell shape change was quantified using the cell aspect ratio with ImageJ (>15 cells measured/group, N = 5). (b) By TEM, the junctional complex of WT RPE is well developed (red arrowhead) from apical to basal region between 2 RPE cells. Mitochondria are elongated and adjacent to junctional complexes (left panel). Elongated mitochondria have well developed cristae (red arrowhead), are diffusely distributed including basal location (right panel), and RPE have normal basal infoldings (red arrowhead). In contrast, pink1−/− RPE have truncated junctional complexes (red arrowhead; left panel) and rounded mitochondria with degenerated cristae (red arrowhead; right panel). pink1−/− RPE have basal laminar deposits (red line) and truncated basal infoldings (lower panel). A, apical microvilli, BI, basal infoldings, M, melanin granule, N, nucleus. Bar: 250 μm. (c) Western blot of mesenchymal marker VIM and epithelial specific CDH1 using ACTB for signal normalization and graphed as fold change. EMT transcription factors Snai1 and Zeb1 quantified as ddCt fold change using Taqman based qRT-PCR using Gapdh to normalize signal (N = 3). (d) Brightfield image of ARPE-19 cells treated with Ctrl or PINK1 siRNA and grown for 5 days on a plastic 6-well plate or a 6-well Transwell filter support system. (e) Brightfield image of iPSC-RPE cells grown on Matrigel coated plate after siRNA transfection, or PINK1 or control lentiviral particle transduction and grown for 4 weeks with puromycin selection. (f) Control or PINK1 siRNA treated ARPE-19 cells fixed and stained with anti-TJ1 (red) and anti-VIM (green) for immunocytochemistry, a western blot of CDH1 and VIM using ACTB for normalization and plotted as fold change. EMT transcription factors SNAI1 and ZEB1 were quantified using TaqMan qRT-PCR assay and plotted as fold change after ddCT calculations (N = 3). (g) RNA-seq analysis showing EMT specific genes from the Broad Institute’s GSEA data set plotted against Enrichment Score or log fold change in the most differentially expressed genes in PINK1 KD vs control ARPE-19 cells; NES, normalized enrichment score; FDR, false discovery rate. (h) The perifovea of an 87 yo female with early AMD has minimal SNAI1 labeling in morphologically normal RPE compared to mildly dysmorphic RPE over a small drusen (top, left) and severely dysmorphic RPE overlying large drusen (bottom left). Same images after removing pigment with Nuance (right panels). Arrowheads indicate regions of strong SNAI1 labeling in RPE. Note artifactual labeling due to debris in the subretinal space above the RPE (*). D, drusen; ch, choroid; bar: 25 μm. Mean ± SD, Student’s t-test; *P < 0.05; **P < 0.01; ***P < 0.001.
Figure 4.
Figure 4.
Mitochondrial ROS and NFE2L2 are required for EMT. ARPE-19 cells treated with Ctrl or PINK1 siRNA were incubated with MitoTEMPO, NAC, D-NAC or TPP-D-NAC for 24 h. (a) Mitochondrial superoxide was quantified with MitoSOX (5 μM, 20 min. treatment) and plotted as fluorescence units/well (N = 3). (b) Mitochondrial and cytoplasmic H2O2 were measured using mito-roGFP2-ORP1 or cyto-roGFP2 fusion protein as a redox sensitive fluorescent biosensor and plotted as fluorescence units/well (N = 4). (c) Immunocytochemistry image of CDH1 (green), VIM (red) and DAPI (blue) showing cell morphology and mesenchymal transition in PINK1-KD cells and cellular response after adding MitoTEMPO, NAC, D-NAC, or TPP-D-NAC. Graph shows the cell shape after calculating the cell aspect ratio (>20 cells measured/group). Note how CDH1 labeling in the periphery is lost and cytoplasmic VIM labeling is increased with PINK1-KD, and that these changes are decreased with antioxidant treatment. Bar: 25 μm. Western blot shows increased CDH1 and decreased VIM with PINK1-KD, changes that are mitigated with antioxidant treatment (MitoTEMPO, NAC, D-NAC, and TPP-D-NAC). Results are represented as fold change (N = 3). EMT transcription factor ZEB1 was quantified using TaqMan qRT-PCR and plotted as fold change after ddCT calculations (N = 3). (d) Western blot of nuclear NFE2L2 accumulation with PINK1-KD relative to Ctrl siRNA, represented as fold change (N = 3). LMNB1 (lamin B1) was used as loading control. (e) Immunocytochemistry image of CDH1 (green), VIM (red) and DAPI (blue) showing ARPE-19 cell morphology and mesenchymal transition after treatment with siRNAs for PINK1, PINK1 and NFE2L2, or PINK1 with NFE2L2 inhibitor Trigonelline (1 uM). Note how CDH1 labeling in the periphery is lost and cytoplasmic VIM labeling is increased with PINK1-KD, which are prevented with NFE2L2 inhibition. Bar: 25 μm. Relative to PINK1-KD cells, on western blot, CDH1 is increased and VIM is decreased VIM with NFE2L2 inhibition. Results are represented as fold change (N = 3). ZEB1 was quantified using TaqMan qRT-PCR and plotted as fold change after ddCT calculations (N = 3). (f) STRING analysis of DEGs (FDR<0.05) obtained from RNA-seq comparing PINK1-KD alone and PINK1-NFE2L2 siRNA treated ARPE-19 cells, which shows TXNRD1 as a major NFE2L2 downstream target. (g) Immunocytochemistry image of CDH1 (green), VIM (red), and DAPI (blue) showing ARPE-19 cell morphology and mesenchymal transition after treatment with siRNAs for PINK1 and prevention with TXNRD1 siRNA. Bar: 25 μm. Relative to PINK1-KD cells, on western blot, CDH1 is increased and VIM is decreased with TXNRD1 inhibition. Results are represented as fold change (N = 3). ZEB1 was quantified using TaqMan qRT-PCR and plotted as fold change after ddCT calculations (N = 3). Mean ± SD, Student’s t-test; *P < 0.05, **P < 0.01 ***P < 0.001, ****P < 0.0001.
Figure 5.
Figure 5.
Mitochondrial retrograde signaling. (a) DEGs (FDR<0.05) from RNA-seq (red stars) in Ctrl vs PINK1 siRNA treated ARPE-19 cells plotted on DAVID PI3K-AKT signaling pathway. Red circles indicate the regions of the pathway that have a high concentration of DEGs with their annotated functional features. “SGKs” indicates multiple SGK isoforms. (b) Immunocytochemistry images of CDH1 (green), VIM (red), and DAPI (blue) showing ARPE-19 cell morphology and mesenchymal transition after treatment with PINK1 siRNA alone and prevention after treatment with 100 nM wortmannin (PI3K inhibitor), 100 nM A6730 (AKT1 inhibitor), or AKT siRNA. Bar: 25 μm. (c) On western blot, CDH1 was increased and VIM was decreased after treatment with wortmannin, A6730, or AKT siRNA (N = 3). ZEB1 induction was prevented with wortmannin and was quantified using TaqMan qRT-PCR and plotted as fold change after ddCT calculations (N = 3). (d) Western blot of p-AKT and AKT in various siRNA treated cells and quantified as fold change (N = 3). Jurkat and activated Jurkat cell extracts were used as controls. ZEB1 increase was prevented with AKT inhibition and was quantified using TaqMan qRT-PCR and plotted as fold change after ddCT calculations (N = 3). (e) Immunocytochemistry images of CDH1 (green), VIM (red), and DAPI (blue) showing ARPE-19 cell morphology and mesenchymal transition after treatment with siRNAs for Ctrl, PINK1, ZEB1, or PINK1 and ZEB1. Bar: 25 μm. On western blot, CDH1 was increased and VIM was decreased after treatment with ZEB1 siRNA (N = 3). (f) Cartoon of the proposed mitochondrial retrograde signaling leading to EMT or cell death. Black oval, mitochondria, red texts indicate inhibition, blue arrows indicate activation. Mean ± SD, Student’s t-test, **P < 0. 01 ***P < 0.001.
Figure 6.
Figure 6.
Two impaired cytoprotective pathways induce cell death. ARPE-19 cells were treated with Ctrl, PINK1, NFE2L2, and PINK1-NFE2L2 siRNAs. (a) Basal, maximal, spare respiratory capacity oxygen consumption were measured by Seahorse assay and (b) ATP by CellTiter-Glo® Luminescent Assay, mitochondrial superoxide anion by MitoSOX assay, and mitochondrial membrane potential by TMRM assay were quantified. (c) 10X brightfield image showing ARPE-19 cell morphology after treatment with siRNAs for Ctrl, NFE2L2, PINK1, and NFE2L2-PINK1. Cell morphology was plotted after calculating the cell aspect ratio (>20 cells measured/group). ZEB1 and SNAI1 were quantified using TaqMan qRT-PCR and plotted as fold change after ddCT calculations (N = 3). (d) RNA-seq analysis showing EMT-specific genes from the Broad Institute’s GSEA data set with transcriptional reprogramming induced by PINK1-KD is modified by PINK1-NFE2L2-KD. (e) Cells were wounded with a plastic tip (top panels), migration was measured 24 h later, and graphed. (f) Cell viability quantified using the LIVE/DEAD assay. WT, pink1−/−, nfe2l2−/−, pink1−/−nfe2l2/-, and pink1−/− mice treated with Trig mice were assessed for retrograde mitochondrial to nuclear signaling. (g) Txnrd1 was assessed using TaqMan RT-qPCR and plotted as fold change after ddCT calculations (N = 3). (h) Western blot of p-AKT and AKT and quantified as fold change (N = 3). ACTB was used as loading control. (i) Zeb1 was assessed using TaqMan RT-qPCR and plotted as fold change after ddCT calculations (N = 3). (j) In vivo oxygen consumption measured using Mito-ID oxygen consumption kit and plotted as fluorescence units per eye (N = 3). (k) RPE flatmounts stained with anti-TJ1 and imaged at 20X. Cell shape change was quantified using the cell aspect ratio with ImageJ (>15 cells measured/group, N = 5). (l) RPE cell survival from freshly dissected eyecups was assessed using ethidium homodimer staining with TJ1 immunolabeling to identify cell margins. The number of ethidium-stained nuclei was quantified and presented in the graph. A toxic dose of CSE (1000 μg/ml) was used. Bar: 25 μm. Mean ± SD, Student’s t-test; *P < 0.05, **P < 0.01, ***P < 0.001, ****P < 0.0001.
Figure 7.
Figure 7.
TPP-D-NAC prevents RPE EMT to the RPE of pink1−/− mice. WT and pink1−/− mice were treated with intraperitoneal TPP-D-NAC (25 mg/kg) or NAC (25 mg/kg) for 1 month. (a) RPE flatmounts stained with anti-TJ1 were imaged at 20X. Cell morphology was plotted after calculating the cell aspect ratio (>20 cells measured/group). (b) Superoxide anion in the RPE was measured using DHE labeling and quantified as the fold change of DHE labeled RPE in pink1−/−:WT mice using DAPI nuclei to count cells. (c) Western blot of p-AKT and AKT and quantified in the graph as fold change (N = 3). ACTB was used as loading control. (d) Zeb1 was assessed using TaqMan RT-qPCR and plotted as fold change after ddCT calculations (N = 3). Mean ± SD, Student’s t-test; *P < 0.05, **P < 0.01, ***P < 0.001, ****P < 0.0001. Bar: 25 μm.

References

    1. Wong WL, Su X, Li X, et al. Global prevalence of age-related macular degeneration and disease burden projection for 2020 and 2040: a systematic review and meta-analysis. Lancet Glob Health. 2014;2(2):e106–16. - PubMed
    1. Pennington KL, DeAngelis MM.. Epidemiology of age-related macular degeneration (AMD): associations with cardiovascular disease phenotypes and lipid factors. Eye Vis (Lond). 2016;3(1):34. - PMC - PubMed
    1. Handa JT, Bowes Rickman C, Dick AD, et al. A systems biology approach towards understanding and treating non-neovascular age-related macular degeneration. Nat Commun. 2019;10(1):3347. - PMC - PubMed
    1. Handa JT. New molecular histopathologic insights into the pathogenesis of age-related macular degeneration. Int Ophthalmol Clin. 2007;47(1):15–50. - PubMed
    1. Kevany BM, Palczewski K. Phagocytosis of retinal rod and cone photoreceptors. Physiology (Bethesda). 2010;25(1):8–15. - PMC - PubMed

Publication types