. 2022 Nov 10;81(12):1730-1741.
doi: 10.1136/ard-2022-222451.

Distinct immune-effector and metabolic profile of CD8+ T cells in patients with autoimmune polyarthritis induced by therapy with immune checkpoint inhibitors

Affiliations

Distinct immune-effector and metabolic profile of CD8+ T cells in patients with autoimmune polyarthritis induced by therapy with immune checkpoint inhibitors

Karolina Benesova et al. Ann Rheum Dis. .

Abstract

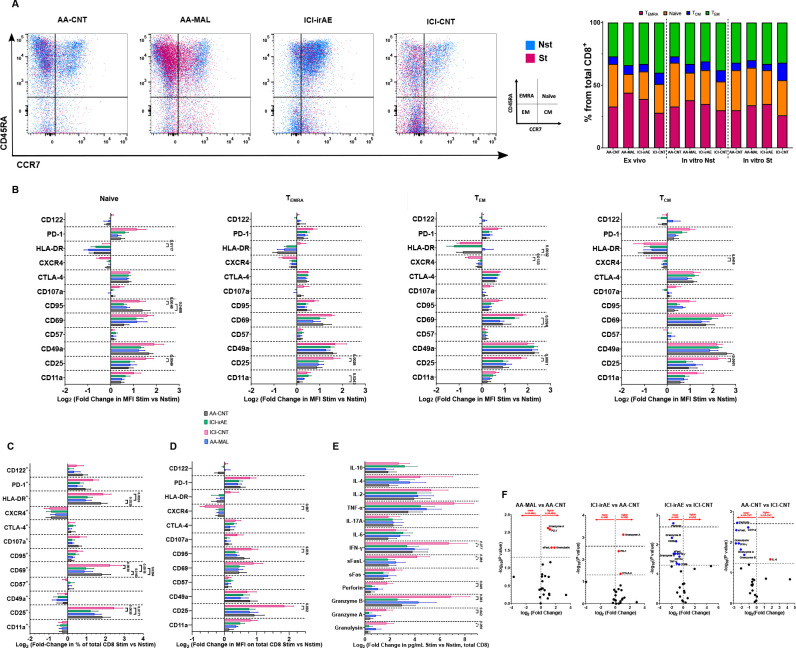
Objectives: Rheumatic immune-related adverse events (irAE) such as (poly)arthritis in patients undergoing immune checkpoint inhibitor (ICI) treatment pose a major clinical challenge. ICI therapy improves CD8+ T cell (CD8) function, but CD8 contributes to chronic inflammation in autoimmune arthritis (AA). Thus, we investigated whether immune functional and metabolic changes in CD8 explain the development of musculoskeletal irAE in ICI-treated patients.

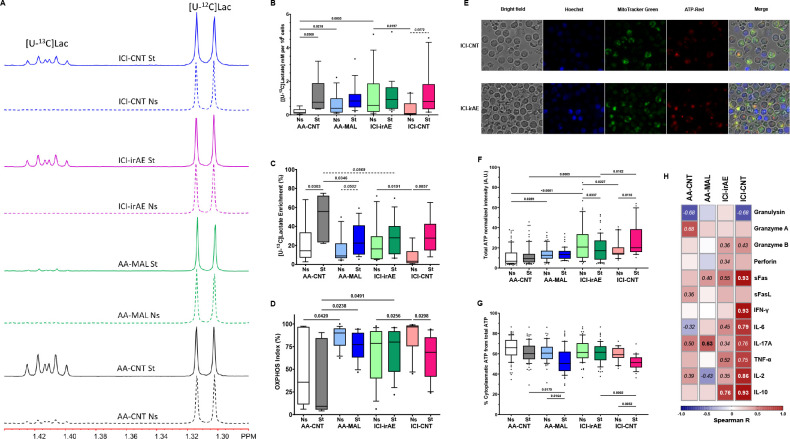
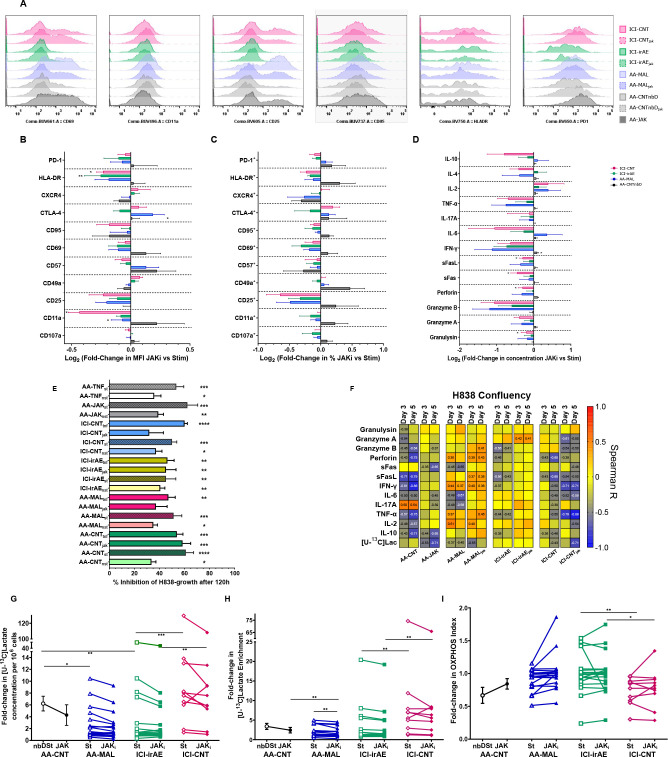
Methods: Peripheral CD8 obtained from ICI-treated patients with and without arthritis irAEs and from AA patients with and without a history of malignancy were stimulated in media containing 13C-labelled glucose with and without tofacitinib or infliximab. Changes in metabolism, immune-mediator release, expression of effector cell-surface molecules and inhibition of tumour cell growth were quantified.

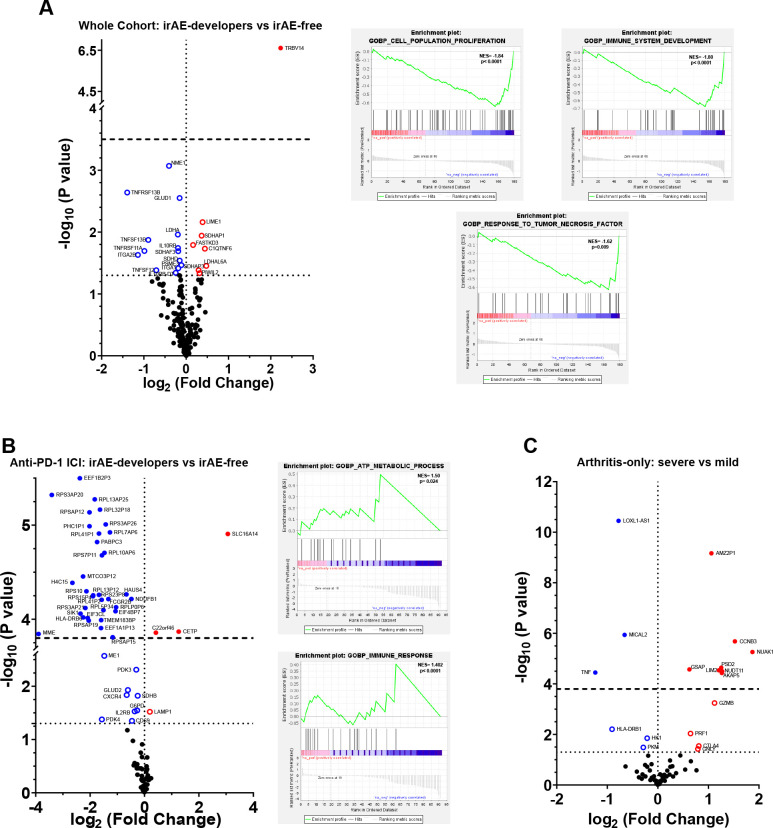
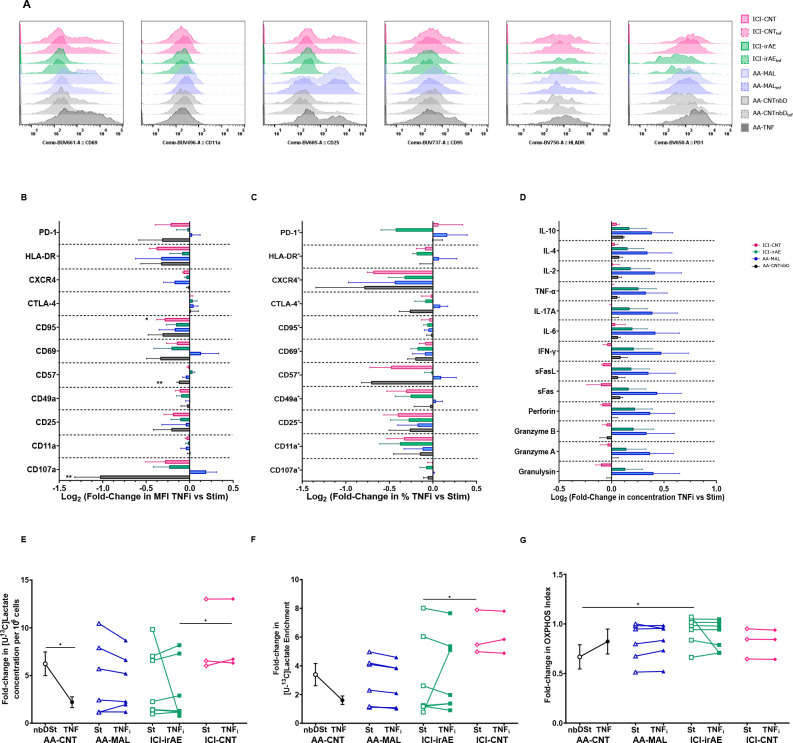
Results: CD8 from patients with irAE showed significantly lower frequency and expression of cell-surface molecule characteristic for activation, effector-functions, homing, exhaustion and apoptosis and reduced release of cytotoxic and proinflammatory immune mediators compared with CD8 from ICI patients who did not develop irAE. This was accompanied by a higher glycolytic rate and ATP production. Gene-expression analysis of pre-ICI-treated CD8 revealed several differentially expressed transcripts in patients who later developed arthritis irAEs. In vitro tofacitinib or infliximab treatment did not significantly change the immune-metabolic profile nor the capacity to release cytolytic mediators that inhibit the growth of the human lung cancer cell line H838.

Conclusions: Our study shows that CD8 from ICI-treated patients who develop a musculoskeletal irAE has a distinct immune-effector and metabolic profile from those that remain irAE free. This specific irAE profile overlaps with the one observed in CD8 from AA patients and may prove useful for novel therapeutic strategies to manage ICI-induced irAEs.

Keywords: Arthritis; Biological Therapy; Inflammation; T-Lymphocyte subsets.


Conflict of interest statement

Competing interests: KB: Consultancy and/or speaker fees and/or travel reimbursements: Abbvie, Bristol Myers Squibb (BMS), Gilead/Galapagos, Janssen, Merck Sharp & Dohme (MSD), Mundipharma, Novartis, Pfizer, Roche, Viatris, UCB. Scientific support: Medical Faculty of University of Heidelberg, Rheumaliga Baden-Württemberg e.V., AbbVie, Novartis. MMSC: Scientific support: Novartis, Pfizer. JCH: honoraria: BMS, MSD, Novartis, Roche, Pierre Fabre, Sanofi, Almirall; consultant or advisory role: MSD, Pierre Fabre, Sunpharma; Scientific support: BMS; Travel support: Pierre Fabre. PC: honoraria: Roche, Takeda, Gilead, AstraZeneca, Novartis; scientific support: Roche, Takeda, Amgen, Merck, AstraZeneca, Novartis; travel support: AstraZeneca, Merck, Janssen, Daiichi Sankyo, Takeda, Novartis, Elli Lilly; data safety monitoring and/or advisory board: Pfizer, Chugai, Boehringer Ingelheim, Roche. JG: honoraria: Galapagos; travel support: Elli Lilly. HML: Scientific funding: Abbvie, Novartis, Pfizer, Roche; consulting fees and honoraria: Abbvie, AstraZeneca, Actelion, Amgen, Bayer Vital, Boehringer Ingelheim, BMS, Celgene, GlaxoSmithKline (GSK), Galapagos, Janssen, Elli Lilly, Medac, MSD, Novartis, Pfizer, Roche, Sanofi, UCB; travel support: Abbvie, AstraZeneca, Boehriner Ingelheim, BMS, Celgene, GSK, Gilead, Janssen, Elli Lilly, MSD, Novartis, Pfizer, Roche, Sanofi, UCB; data safety monitoring and/or advisory board: Abbvie, AstraZeneca, Amgen, Boehriner Ingelheim, BMS, Celgene, GSK, Gilead, Janssen, Elli Lilly, Medac, MSD, Novartis, Pfizer, Roche, Sanofi, UCB

Figures

Figure 1
Figure 1
Immunophenotype and release of immune mediators is different between ICI-irAE and ICI-CNT CD8. (A) Representative overlay dot-plots of CD45RA versus CCR7 expression in unstimulated and TCR-stimulated CD8 and stacked-column graphs showing the distribution of the four main functional CD8 subsets based on CD45RA versus CCR7 expression (naïve: CD45RA+CCR7+; TEMRA: CD45RA+CCR7-; TEM: CD45RA-CCR7-; and TCM: CD45RA-CCR7+) within each patient group. (B) Bar graphs showing the fold-change expression (MFI) of the different markers in the main functional CD8 subsets after TCR-mediated stimulation. (C–E) Bar graphs showing the fold-change in surface-marker frequency (C), surface marker expression (D) and cytokines, and cytotoxic molecules release (E) after TCR-mediated stimulation. (F) Volcano plots showing the differentially expressed molecules between the different patient groups. The horizontal dotted line represents p value<0.05; the horizontal dashed line represents adjusted p value<0.05. For all panels: AA-CNT n=18; AA-MAL n=16; ICI-irAE n=19; ICI-CNT n=10. Representative patients for panel A: #17 AA-CNT list; #14 from AA-MAL list; #16 from ICI-irAE list; and #10 from ICI-CNT list. AA-CNT, autoimmune arthritis; AA-JAKi, autoimmune arthritis Janus-kinase inhibitor; AA-MAL, autoimmune arthritis malignancy; GC, glucocorticoids; ICI-irAE, immune checkpoint inhibitor-immune-related adverse event; NSCLC, non-small-cell lung cancer; PsA, psoriatic arthritis; RA, rheumatoid arthritis; SpA, spondylarthritis.
Figure 2
Figure 2
irAE CD8 present a Warburg effect-like phenotype when resting and on TCR-stimulation undergo a Crabtree effect-like metabolic shift. (A) Representative 1H NMR sub-spectra of cell-culture media for each group of CD8, either unstimulated or TCR-stimulated. The region covers the [U-12C]-lactate methyl signal and the 13C satellite at higher frequency arising from [U-13C]-lactate. Each spectrum has been normalised separately to its [U-12C]-lactate methyl signal. (B–D) The concentration of [U-13C]-lactate in the cell-culture medium (B), [U-13C]-lactate enrichment (C) and OXPHOS-rate (D) before and after TCR–mediated stimulation for each group. Results are shown as box plots. Each box represents the 25th to 75th percentiles. Lines inside the boxes represent the median. Lines outside the boxes represent the 10th and 90th percentiles. Dots represent outliers. For all panels, AA-CNT n=18; AA-MAL n=16; ICI-irAE n=19; and ICI-CNT n=10. (E) Representative microscopy images of unstimulated ICI-irAE and ICI-CN CD8. (F) Total ATP produced by in vitro cultured CD8 without stimulation or with TCR-mediated stimulation, quantified by measuring the relative ATP-Red fluorescence. Each box represents the 25th to 75th percentiles of nine technical replicates for each patient (AA-CNT n=6; AA-MAL n=6; ICI-irAE n=7; and ICI-CNT n=3). Lines inside the boxes represent the median, lines outside the boxes represent the 10th and 90th percentiles, and dots represent outliers. (H) The correlation between [U-13C]-lactate production and cytokines/cytotoxic molecules release on TCR-mediated stimulation. Numbers show correlations with Spearman R>|0.3|, bold numbers represent p<0.05. AA-CNT, autoimmune arthritis; AA-JAKi, autoimmune arthritis Janus-kinase inhibitor; AA-MAL, autoimmune arthritis malignancy; GC, glucocorticoids; ICI-irAE, immune checkpoint inhibitor-immune-related adverse event; TCR, T-cell receptor.
Figure 3
Figure 3
Before therapy begins, patients who later on develop ICI-induced irAE have a different gene expression than those who remain irAE-free. Volcano plots and pathway enrichment plots showing the gene-expression differences before ICI-therapy. (A) Total ICI-treated patients. Those who developed arthritis irAE (n=21) versus those who remained irAE-free (n=135). (B) Patients treated only with anti-PD-1 ICI. Those who developed arthritis irAE (n=7) versus those who remained irAE-free (n=73). (C) ICI-treated irAE patients who developed severe arthritis (grade 3–4; n=7) versus those who developed mild arthritis (grade 1–2; n=14). Horizontal dotted line represents p<0.05; horizontal dashed line represents adjusted p<0.05. ICI, immune checkpoint inhibitor; irAE, immune-related adverse event.
Figure 4
Figure 4
In vitro JAK-pathway inhibition with tofacitinib does not alter the immuno-metabolic profile of ICI-irAE CD8. (A) Representative histograms of changes in the expression of cell-surface molecules by TCR-stimulated CD8 after in vitro JAKi-treatment (AA-nbDCNT, AA-MAL, ICI-irAE and ICI-CNT) and AA-JAK patients. (B–D) Bar graphs showing the fold-changes in surface-marker expression (B), surface marker frequency (C) and cytokines and cytotoxic molecules release (D) of TCR-stimulated CD8 after in vitro JAKi treatment. *p<0.05, **p<0.01 changes between stimulated and JAKi conditions. (E) Inhibition of H838 growth by conditioned media from CD8 (unstimulated, and TCR-stimulated with and without JAKi or TNFi treatment) after 5 days. *p<0.05, **p<0.01; ***p<0.001, ****p<0.0001 between conditioned media versus H838 in medium only. (F) Correlations between H838 cell growth and the concentration of cytokines or cytotoxic molecules in the conditioned cell-culture media. Numbers show correlations with Spearman R>|0.35| and p<0.05. (G–I) Fold change relative to baseline in the concentration of [U-13C]-lactate in the cell-culture medium (G), [U-13C]-lactate enrichment (H) and OXPHOS rate (I) in TCR-stimulated CD8 with (solid symbols) or without (open symbols) in vitro JAKi treatment (AA-MAL, ICI-irAE, and ICI-CNT) or between AA-CNT and AA-JAK patients. *p<0.05, **p<0.01, ***p<0.001 between JAKi-treated and untreated cells. For (B–I): AA-nbDCNT n=10; AA-MAL n=16; ICI-irAE n=19; and ICI-CNT n=10. Representative patients for (A): AA-nbDCNT patient #17 from AA-CNT list; #16 from AA-JAK list; #14 from AA-MAL list; #16 from ICI-irAE list; and #10 from ICI-CNT list. AA-JAKi, autoimmune arthritis Janus-kinase inhibitor; AA-MAL, autoimmune arthritis malignancy; ICI-irAE, immune checkpoint inhibitor-immune-related adverse event; TCR, T-cell receptor.
Figure 5
Figure 5
In vitro TNF-α inhibition with infliximab does not alter the immuno-metabolic profile of ICI-irAE CD8. (A) Representative histograms of changes in the expression of cell-surface molecules by TCR-stimulated CD8 after in vitro TNFi-treatment (AA-nbDCNT, AA-MAL, ICI-irAE and ICI-CNT) and AA-TNF patients. (B–D) Bar graphs showing the fold-changes in surface-marker expression (B), surface marker frequency (C) and cytokines and cytotoxic molecules release (D) of TCR-stimulated CD8 after in vitro TNFi treatment. *p<0.05, **p<0.01 changes between stimulated and TNFi conditions. (E–G) Fold change relative to baseline in the concentration of [U-13C]-lactate in the cell-culture medium (G), [U-13C]-lactate enrichment (H) and OXPHOS rate (I) in TCR-stimulated CD8 with (solid symbols) or without (open symbols) in vitro TNFi treatment (AA-MAL, ICI-irAE and ICI-CNT) or between AA-CNT and AA-TNF patients. *p<0.05 between TNFi-treated and untreated cells. For (B–G): AA-nbDCNT n=4; AA-MAL n=6; ICI-irAE n=7; and ICI-CNT n=3. Representative patients in (A): AA-nbDCNT patient #17 from AA-CNT list; AA-TNF patient #13 from AA-CNT list; #14 from AA-MAL list; #16 from ICI-irAE list; and #10 from ICI-CNT list. AA-JAKi, autoimmune arthritis Janus-kinase inhibitor; AA-MAL, autoimmune arthritis malignancy; ICI-irAE, immune checkpoint inhibitor-immune-related adverse event.

References

    1. Kubli SP, Berger T, Araujo DV, et al. . Beyond immune checkpoint blockade: emerging immunological strategies. Nat Rev Drug Discov 2021;20:899–919. 10.1038/s41573-021-00155-y - DOI - PubMed
    1. Ribas A, Wolchok JD. Cancer immunotherapy using checkpoint blockade. Science 2018;359:1350–5. 10.1126/science.aar4060 - DOI - PMC - PubMed
    1. Wieder T, Eigentler T, Brenner E, et al. . Immune checkpoint blockade therapy. J Allergy Clin Immunol 2018;142:1403–14. 10.1016/j.jaci.2018.02.042 - DOI - PubMed
    1. Kostine M, Finckh A, Bingham CO, et al. . EULAR points to consider for the diagnosis and management of rheumatic immune-related adverse events due to cancer immunotherapy with checkpoint inhibitors. Ann Rheum Dis 2021;80:36–48. 10.1136/annrheumdis-2020-217139 - DOI - PMC - PubMed
    1. Benesova K, Lorenz H-M, Leipe J, et al. . How I treat cancer: treatment of rheumatological side effects of immunotherapy. ESMO Open 2019;4:e000529. 10.1136/esmoopen-2019-000529 - DOI - PMC - PubMed