. 2022 Aug 3;13(1):4500.
doi: 10.1038/s41467-022-32121-6.

Dynamics of a national Omicron SARS-CoV-2 epidemic during January 2022 in England

Affiliations

Dynamics of a national Omicron SARS-CoV-2 epidemic during January 2022 in England

Paul Elliott et al. Nat Commun. .

Abstract

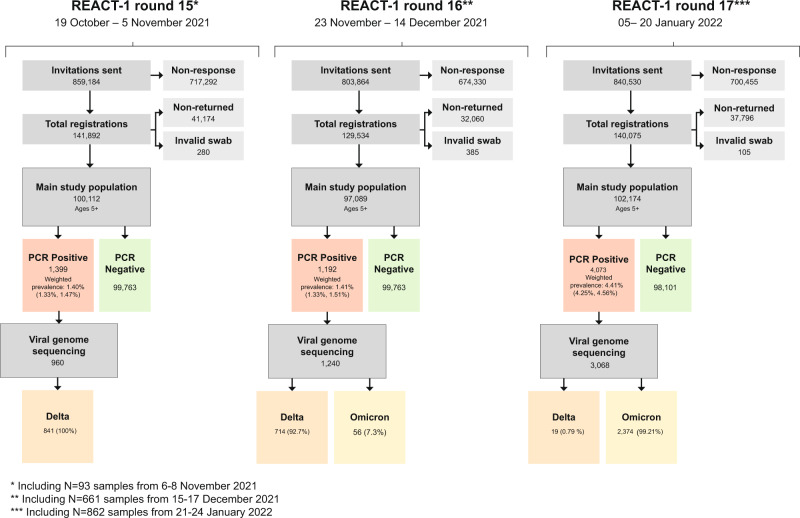
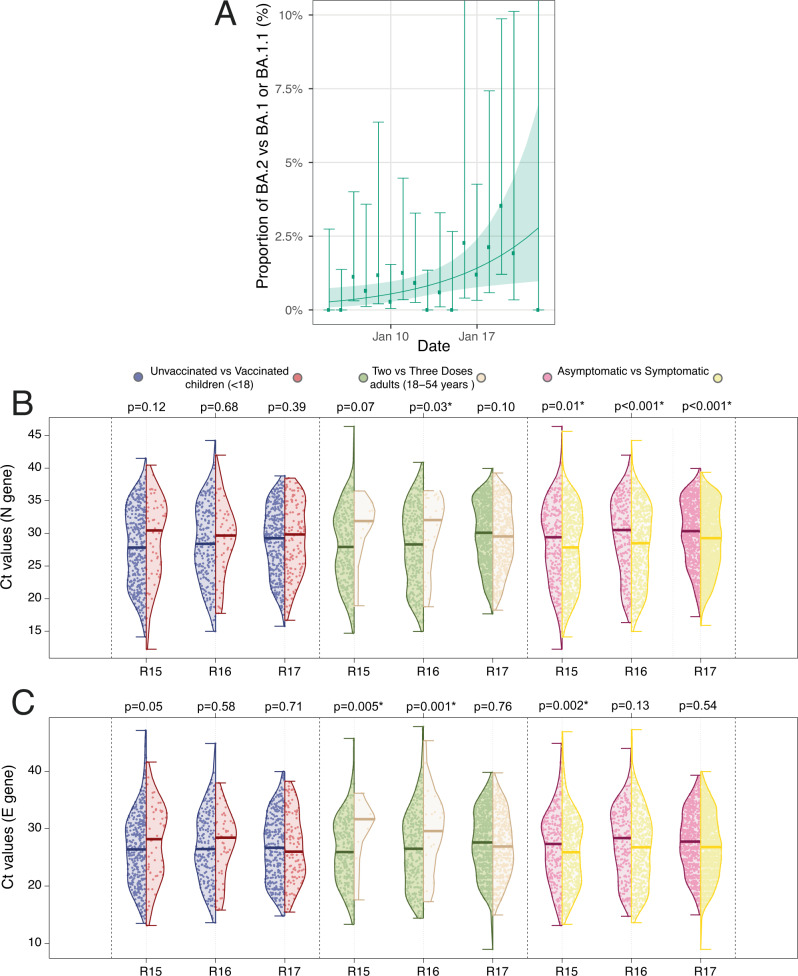
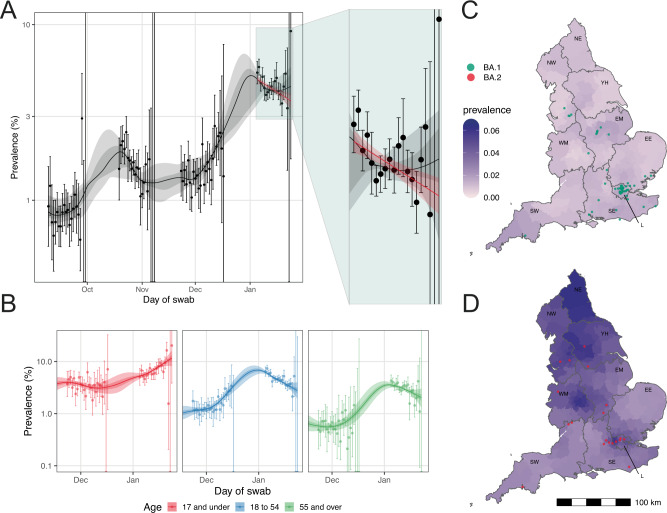
Rapid transmission of the SARS-CoV-2 Omicron variant has led to record-breaking case incidence rates around the world. Since May 2020, the REal-time Assessment of Community Transmission-1 (REACT-1) study tracked the spread of SARS-CoV-2 infection in England through RT-PCR of self-administered throat and nose swabs from randomly-selected participants aged 5 years and over. In January 2022, we found an overall weighted prevalence of 4.41% (n = 102,174), three-fold higher than in November to December 2021; we sequenced 2,374 (99.2%) Omicron infections (19 BA.2), and only 19 (0.79%) Delta, with a growth rate advantage for BA.2 compared to BA.1 or BA.1.1. Prevalence was decreasing overall (reproduction number R = 0.95, 95% credible interval [CrI], 0.93, 0.97), but increasing in children aged 5 to 17 years (R = 1.13, 95% CrI, 1.09, 1.18). In England during January 2022, we observed unprecedented levels of SARS-CoV-2 infection, especially among children, driven by almost complete replacement of Delta by Omicron.


Conflict of interest statement

AD is chairman of the Health Security and Pre-Emptive Medicine Initiative, Flagship Pioneering UK plc and has no conflict of interest to declare. MC-H holds shares in the O-SMOSE company. Consulting activities conducted by the company are independent of the present work and MC-H has no conflict of interest to declare. All other authors have no competing interests to declare.

Figures

Fig. 1
Fig. 1. Study overview.
Flow chart showing numbers of participants in round 15 (October 19–November 5, 2021), round 16 (November 23–December 14, 2021) and round 17 (January 5–20, 2022) of REACT-1.
Fig. 2
Fig. 2. Description of the Omicron positive swabs.
Daily proportion of BA.2 (vs BA.1 or BA.1.1) infections among (n = 2393) positive swabs with determined lineage and at least 50% genome coverage in round 17 (A). Point estimates (means) are represented (dots) along with 95% confidence intervals (vertical lines). Smoothed estimates of the proportion are also shown (solid line) together with their 95% credible intervals (shaded regions). No sequencing data were available for January 21, 2022. Distribution of the Ct value for the N gene (B) and E gene (C) in swab-positive samples from round 15 (Delta), round 16 (predominantly Delta) and round 17 (predominantly Omicron). Within each round, distributions are compared (i) for vaccinated vs. unvaccinated participants aged 17 years and under, (ii) those having received three vs two vaccine doses in adults aged 18 to 54 years, and (iii) for those reporting any symptoms vs those not reporting any symptom in the month prior to swabbing. For each comparison, we report the P-value from a non-parametric (Kruskal-Wallis) test.
Fig. 3
Fig. 3. Temporal and geographical distribution of SARS-CoV-2 swab positivity.
Comparison of an exponential model fit to SARS-CoV-2 swab-positivity data in round 17 (n = 102,174 participants with valid RT-PCR test results, in red), and a P-spline model fit to all rounds of REACT-1 (black, shown here only for rounds 14, 15, 16 and 17) (A). The solid red line represents the posterior mean estimate from the exponential growth model, and the shaded red region the 95% posterior credible interval for the exponential models. The solid black line represents the posterior mean smoothed estimate of the weighted prevalence and the shaded grey region shows 50% (dark grey) and 95% (light grey) posterior credible interval for the P-spline model. Results are presented for each day (X axis) of sampling for round 14, round 15, round 16 and round 17 and the weighted prevalence of swab-positivity is shown (Y axis) on a log scale. Weighted observations (black dots) and their 95% credible intervals (vertical lines) are also shown. Results from similar P-spline models for those aged 17 years and under (n = 10,638 participants with valid RT-PCR test results, in red), those aged 18 to 54 years inclusive (n = 39,676 participants with valid RT-PCR test results, in blue) and those aged 55 years and over (n = 51,860 participants with valid RT-PCR test results, in green) (B). Results are presented for round 16 and 17. Solid lines represent the posterior mean estimate of the smoothed weighted prevalence, and shaded regions represent the 50% (dark color) and 95% (light color) posterior credible interval of the smoothed prevalence. Weighted observations (dots) and 95% credible intervals (vertical lines) are also represented. Neighbourhood smoothed average SARS-CoV-2 swab-positivity prevalence by lower-tier local authority area for round 16 (C) and round 17 (D) in England. Neighbourhood prevalence calculated from nearest neighbours (the median number of neighbours within 30 km in the study). We represent the (jittered) location where we first detected BA.1 and sub-lineages (N = 56) in round 16 (C) and BA.2 and sub-lineages (N = 19) in round 17 (D). Regions: NE North East, NW North West, YH Yorkshire and The Humber, EM East Midlands, WM West Midlands, EE East of England, L London, SE South East, SW South West.
Fig. 4
Fig. 4. Comparison of COVID-19 daily hospitalisations and deaths with SARS-CoV-2 swab-positivity as measured in REACT-1.
Daily swab-positivity for all 17 rounds of the REACT-1 study (black points with 95% confidence intervals, left-hand y-axis) with P-spline estimates for swab-positivity (solid black line, shaded area is 95% confidence interval). A Daily hospitalisations in England (blue points, right-hand y-axis) and P-spline model estimates for expected daily hospitalisations in England (solid blue line, shaded area is 95% confidence interval, right-hand y-axis). Daily hospitalisations have been shifted by 19 days (95% CI, 18, 20) backwards in time along the x-axis up to June 14, 2021 and by 16 days (95% 14, 18) thereafter. B Daily deaths in England (red points, right-hand y-axis) and P-spline model estimates for expected daily deaths in England (solid red line, shaded area is 95% confidence interval, right-hand y-axis). Daily deaths have been shifted by 26 days (95% CI, 25, 26) backwards in time along the x-axis up to June 14, 2021 and by 16 days (95% CI, 15, 17) thereafter. The scaling parameter estimates were 0.060 (0.058, 0.062) and 0.24 (0.23, 0.25) for deaths and hospitalisations, respectively.

References

    1. Network for Genomic Surveillance in South Africa (NGS-SA). SARS-CoV-2 Sequencing Update 3 December 2021. https://www.nicd.ac.za/wp-content/uploads/2021/12/Update-of-SA-sequencin....
    1. Classification of Omicron (B.1.1.529): SARS-CoV-2 variant of Concern. https://www.who.int/news/item/26-11-2021-classification-of-omicron-(b.1.....
    1. SARS-CoV-2 variants of concern and variants under investigation in England. Technical briefing: Update on hospitalisation and vaccine effectiveness for Omicron VOC-21NOV-01 (B.1.1.529). https://assets.publishing.service.gov.uk/government/uploads/system/uploa... (2021).
    1. First confirmed case of Omicron variant detected in the United States. Centers for Disease Control and Preventionhttps://www.cdc.gov/media/releases/2021/s1201-omicron-variant.html (2021).
    1. Elliott, P. et al. Rapid increase in Omicron infections in England during December 2021: REACT-1 study. Science10.1126/science.abn8347 (2022). - PMC - PubMed

Publication types

Supplementary concepts