. 2022 Aug 3;13(1):4505.
doi: 10.1038/s41467-022-32219-x.

Genome-wide associations of aortic distensibility suggest causality for aortic aneurysms and brain white matter hyperintensities

Affiliations

Genome-wide associations of aortic distensibility suggest causality for aortic aneurysms and brain white matter hyperintensities

Catherine M Francis et al. Nat Commun. .

Abstract

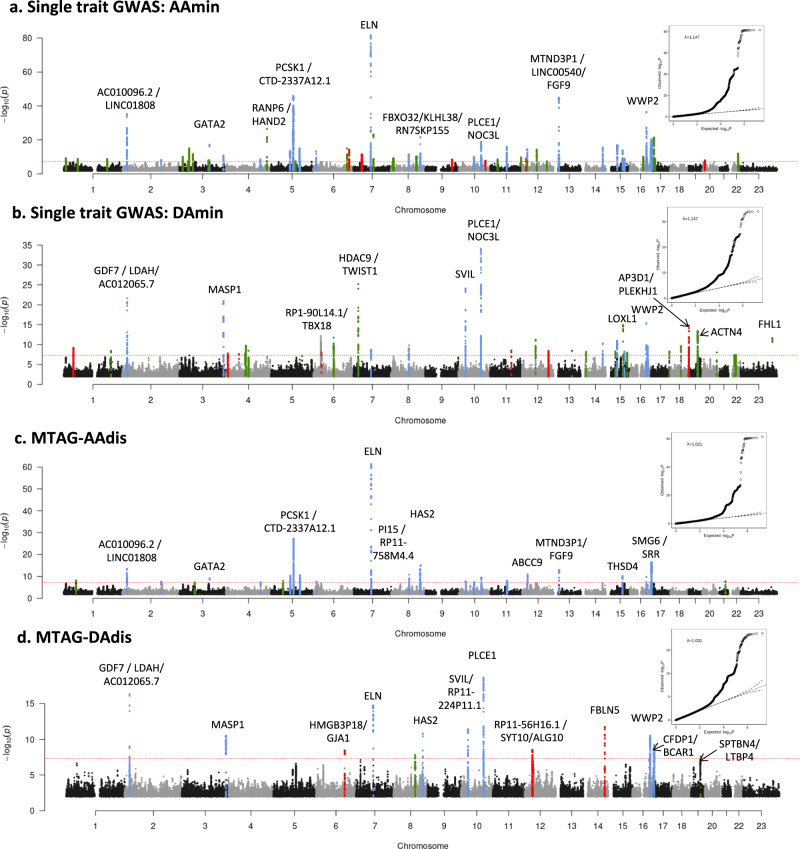
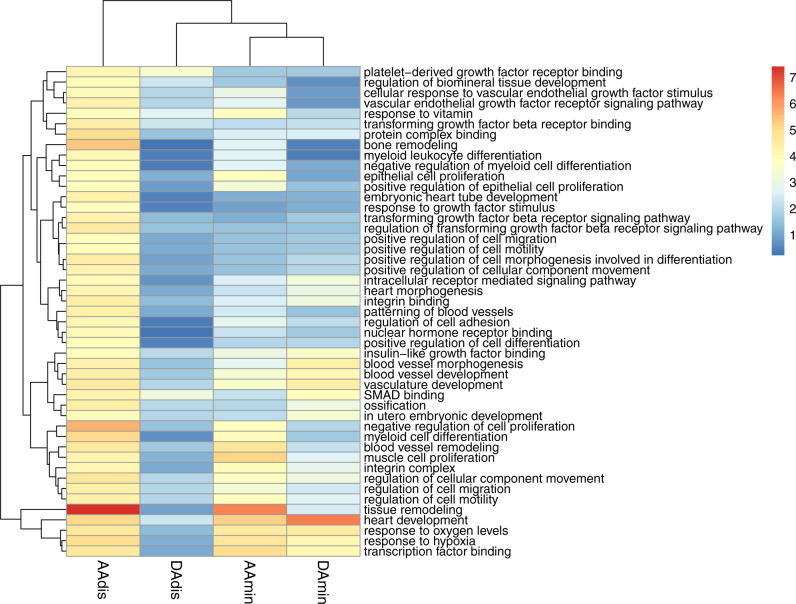
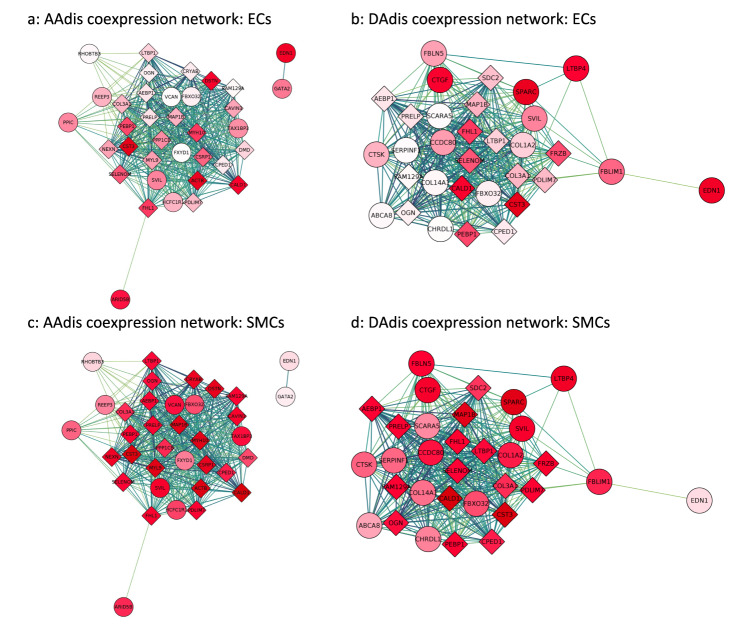
Aortic dimensions and distensibility are key risk factors for aortic aneurysms and dissections, as well as for other cardiovascular and cerebrovascular diseases. We present genome-wide associations of ascending and descending aortic distensibility and area derived from cardiac magnetic resonance imaging (MRI) data of up to 32,590 Caucasian individuals in UK Biobank. We identify 102 loci (including 27 novel associations) tagging genes related to cardiovascular development, extracellular matrix production, smooth muscle cell contraction and heritable aortic diseases. Functional analyses highlight four signalling pathways associated with aortic distensibility (TGF-β, IGF, VEGF and PDGF). We identify distinct sex-specific associations with aortic traits. We develop co-expression networks associated with aortic traits and apply phenome-wide Mendelian randomization (MR-PheWAS), generating evidence for a causal role for aortic distensibility in development of aortic aneurysms. Multivariable MR suggests a causal relationship between aortic distensibility and cerebral white matter hyperintensities, mechanistically linking aortic traits and brain small vessel disease.


Conflict of interest statement

P.M.M. acknowledges consultancy fees from Novartis, Bristol–Myers Squibb, Celgene and Biogen. He has received honoraria or speakers’ honoraria from Novartis, Biogen and Roche and has received research or educational funds from Biogen, Novartis, GlaxoSmithKline and Nodthera. J.S.W. has acted as a consultant for MyoKardia and Foresite Labs, and received research support from MyoKardia & Bristol–Myers Squibb. The remaining authors declare no competing interests.

Figures

Fig. 1
Fig. 1. Manhattan plots of summary statistics from GWAS of aortic traits.
a Single-trait analysis of ascending aortic minimum area (AAmin) and b single-trait analysis of descending aortic minimum area (DAmin). Genomic inflation (λ) = 1.147 (Aamin and Damin). The y axis shows the negative log of the unadjusted p value of association (mixed model association implemented in BOLT-LMM). c Multi-trait analysis (MTAG) of ascending aortic distensibility (AAdis) and d Multi-trait analysis of descending aortic distensibility (DAdis). The y axis shows the unadjusted p value of association (using MTAG as discussed in Methods); negative log scale. Twenty-six association signals were identified in multi-trait analysis of ascending aortic distensibility (AAdis) and thirteen in multi-trait analysis of descending aortic distensibility (DAdis). All six traits (maximum and minimum areas and distensibility in ascending and descending aorta) were used for the MTAG analysis. Genomic inflation (λ) = 1.021 (AAdis) and 1.031 (DAdis). All panels: Red dashed lines show the genome-wide significance threshold of P = 5 × 10−8. Annotations of selected loci show the nearest gene and additional manual annotation of likely candidate gene(s) at the locus where appropriate. Blue: locus is genome-wide significant in multiple aortic traits, green: locus is genome-wide significant only in the corresponding trait and with nominal significance (p < 0.01) in other traits, red: genome-wide significant only in the corresponding trait without even nominal significance in other traits. QQ plots are shown as inserts in corresponding panels.
Fig. 2
Fig. 2. Heatmap of significantly enriched gene ontologies (GO terms) for minimum area and distensibility phenotypes generated by DEPICT.
Colour scale denotes the significance of enrichment, (unadjusted p value −log10 scale). Only GO terms significantly enriched in association with AAdis (FDR < 0.01) are presented. Full results can be found in Supplementary Data 11c. AAdis ascending aortic distensibility, AAmin ascending aortic minimum area, DAdis descending aortic distensibility, DAmin descending aortic minimum area.
Fig. 3
Fig. 3. Co-expression networks for aortic distensibility GWAS genes generated with primate single cell expression data for the aorta.
The co-expression networks were derived from extended models (r > 0.2) in aortic endothelial (ECs) and aortic smooth muscle cells (SMCs). Round circles represent genes which were significantly associated (unadjusted p value <5 × 10−8) with an aortic trait in the current GWAS. Diamonds represent other genes significantly co-expressed in the published single-cell data for the cell-type indicated. The deeper the shade of red, the higher the level of expression of that gene in the specified cell-type. The strength of co-expression is denoted by the colour of the lines joining genes with higher correlations indicated by darker lines. “Hub genes” are found in the centres of these modules. a Co-expression networks derived from genes associated with ascending aortic distensibility (AAdis) and expression data from aortic endothelial cells (ECs). b Co-expression networks derived from genes associated with descending aortic distensibility (DAdis) and expression data from aortic endothelial cells (ECs). c Co-expression networks derived from genes associated with AAdis and expression data from aortic smooth muscle cells (SMCs). d Co-expression networks derived from genes associated with DAdis and expression data from aortic smooth muscle cells (SMCs). See Supplementary Figs. 14–17 for further co-expression results.

References

    1. Ohyama Y, Redheuil A, Kachenoura N, Ambale Venkatesh B, Lima JAC. Imaging insights on the aorta in aging. Circ. Cardiovasc. Imaging. 2018;11:e005617. doi: 10.1161/CIRCIMAGING.117.005617. - DOI - PMC - PubMed
    1. Teixido-Tura G, et al. Aortic biomechanics by magnetic resonance: early markers of aortic disease in Marfan syndrome regardless of aortic dilatation? Int J. Cardiol. 2014;171:56–61. doi: 10.1016/j.ijcard.2013.11.044. - DOI - PubMed
    1. de Wit A, Vis K, Jeremy RW. Aortic stiffness in heritable aortopathies: relationship to aneurysm growth rate. Heart Lung Circ. 2013;22:3–11. doi: 10.1016/j.hlc.2012.08.049. - DOI - PubMed
    1. Nollen GJ, Groenink M, Tijssen JG, Van Der Wall EE, Mulder BJ. Aortic stiffness and diameter predict progressive aortic dilatation in patients with Marfan syndrome. Eur. Heart J. 2004;25:1146–1152. doi: 10.1016/j.ehj.2004.04.033. - DOI - PubMed
    1. Redheuil A, et al. Proximal aortic distensibility is an independent predictor of all-cause mortality and incident CV events: the MESA study. J. Am. Coll. Cardiol. 2014;64:2619–2629. doi: 10.1016/j.jacc.2014.09.060. - DOI - PMC - PubMed

Publication types

LinkOut - more resources