. 2022 Aug 3;12(1):13339.
doi: 10.1038/s41598-022-16598-1.

Methods to capture proteomic and metabolomic signatures from cerebrospinal fluid and serum of healthy individuals

Affiliations

Methods to capture proteomic and metabolomic signatures from cerebrospinal fluid and serum of healthy individuals

Laura M Lilley et al. Sci Rep. .

Abstract

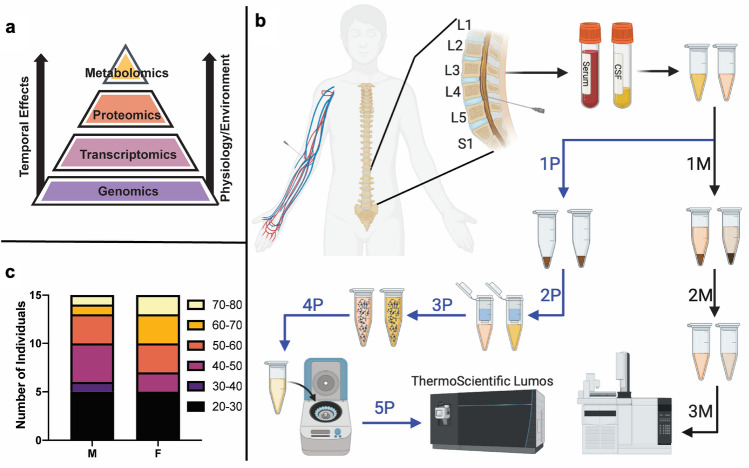
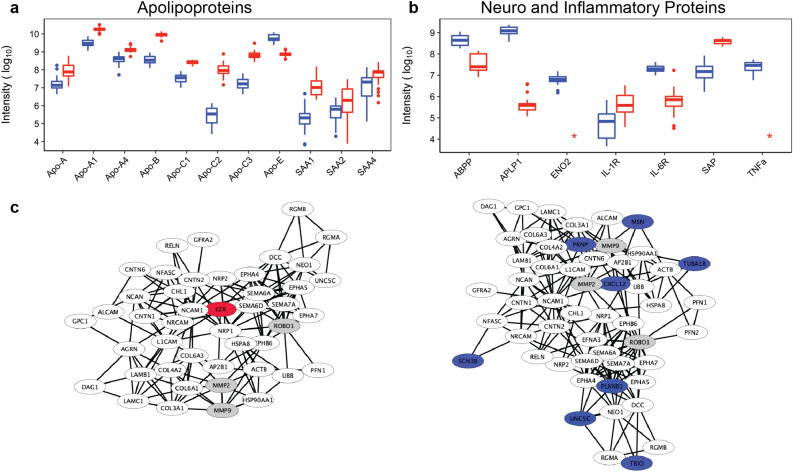
Discovery of reliable signatures for the empirical diagnosis of neurological diseases-both infectious and non-infectious-remains unrealized. One of the primary challenges encountered in such studies is the lack of a comprehensive database representative of a signature background that exists in healthy individuals, and against which an aberrant event can be assessed. For neurological insults and injuries, it is important to understand the normal profile in the neuronal (cerebrospinal fluid) and systemic fluids (e.g., blood). Here, we present the first comparative multi-omic human database of signatures derived from a population of 30 individuals (15 males, 15 females, 23-74 years) of serum and cerebrospinal fluid. In addition to empirical signatures, we also assigned common pathways between serum and CSF. Together, our findings provide a cohort against which aberrant signature profiles in individuals with neurological injuries/disease can be assessed-providing a pathway for comprehensive diagnostics and therapeutics discovery.


Conflict of interest statement

The authors declare no competing interests.

Figures

Figure 1
Figure 1
(a) Hierarchy of ‘omics where the metabolome and proteome are temporally more sensitive to environmental influence such as disease and injury. (b) Sample acquisition and processing scheme for Proteomics (left) and metabolomics (right) CSF samples (blue icons) were drawn by lumbar puncture (S1–L5) and serum samples (red icons) were drawn by venipuncture. Proteomics processing follows the left workflow with lyophilization (1P), resuspension and solubilization (2P), proteins were adhered to the S-Trap column (3P), the fixed proteins were washed (4P), proteins were digested overnight with trypsin (5P), the peptides were eluted (6P), dried and suspended for LC–MS/MS analysis (7P). Metabolomics processing follows the right workflow by organic solvent extraction and separation (1 M), followed by concentration and resuspension (2 M) for GC–MS analysis (3 M). C) Age/sex breakdown of the 30 CSF and 30 serum samples.
Figure 2
Figure 2
(a) Principal component analysis of proteomics data serum proteins (red) and CSF proteins (blue) where each point is a sample. (b) Volcano plot of proteomics data where the log10 of each protein’s intensity versus − log10 corrected p-value the vertical dashed grey lines represent a +/− tenfold change and the horizontal dashed line is p = 0.05. (c) Table describing how the proteins included in the analysis vary by FDR rate. (d) Principal component analysis of metabolomics data. (e) Volcano plot of metabolomics data. (f) Heatmap of metabolites covered in the analysis, metabolites right of the black line represents the metabolites positively identified. rThe 0–100 scale on the heatmap represents normalized percentage of being detected in either CSF or serum.
Figure 3
Figure 3
(a) Clustering diagram of CSF proteomics , each point represents an individual clustered on the principal components with Ward hierarchical clustering. The red line indicates where the tree was cut to form clusters. Longer branches represent larger separations between groups of individuals. (b) Violin plot of age in terms of CSF proteomics clusters. (c) Clustering diagram of CSF metabolome, each point represents an individual clustered on the principal components with Ward hierarchical clustering. The red line indicates where the tree was cut to form clusters. (d) Violin plot of age in terms of CSF metabolomics clusters (e) Cross-tabulation of CSF proteomics and metabolomics membership.
Figure 4
Figure 4
(a) Boxplots of apolipoprotein intensity and comparison between CSF (blue) and serum (red). Serum amyloid A proteins (SAA#) and apolipoproteins (Apo-letter). Apolipoproteins are generally more abundant in serum over CSF with the exception of Apo-E. (b) Boxplots of important detected neuro and inflammatory proteins serum amyloid-P and P1 (SAP), amyloid precursor protein (ABPP), Interleukins 1 and 6 (IL-1 and IL-6), γ-enolase (ENO2). (c) STRING over-representation analysis of axon guidance. Proteins marked in grey control multiple biochemical pathways and were common in our over-representation analysis. Proteins marked in white are common to CSF and serum, proteins marked in blue and unique to CSF, and the protein marked in red is unique to serum.
Figure 5
Figure 5
Plots of major classes of identified metabolites, compounds in greater abundance in serum (red circles), exclusively in serum (red triangles), compounds in greater abundance in CSF (blue circles), exclusively in CSF (blue triangles), and compounds in equal (within 5%) abundance (black circles). The black dashed diagonal line represents equal intensities. (a) Carbohydrate (sugar) monomers associated with synthesis and metabolism as well as artificial sweeteners. (b) The 21 natural amino acids were all detected, amino acid derivatives, and metabolites associated with protein degradation. (c) The neuroregulators detected were primarily in serum or CSF. d) Purines, pyrimidines, and their derivatives that make up the nucleosides in DNA and RNA. (e) Low molecular weight lipids were detected primarily in serum over CSF. (f) Other metabolites that includes urea cycle products, food and drug metabolites.

References

    1. Hernandez A, et al. Exposure to mild blast forces induces neuropathological effects, neurophysiological deficits and biochemical changes 11 Medical and Health Sciences 1109 Neurosciences. Mol. Brain. 2018;11:64. doi: 10.1186/s13041-018-0408-1. - DOI - PMC - PubMed
    1. Greve MW, Zink BJ. Pathophysiology of traumatic brain injury. Mt. Sinai J. Med. 2009;76:97–104. doi: 10.1002/msj.20104. - DOI - PubMed
    1. McAlary L, Plotkin SS, Cashman NR. Emerging developments in targeting proteotoxicity in neurodegenerative diseases. CNS Drugs. 2019;33:883–904. doi: 10.1007/s40263-019-00657-9. - DOI - PMC - PubMed
    1. Montaner J, et al. Multilevel omics for the discovery of biomarkers and therapeutic targets for stroke. Nat. Rev. Neurol. 2020;16:247–264. doi: 10.1038/s41582-020-0350-6. - DOI - PubMed
    1. Rachakonda V, Hong PT, Dong WL. Biomarkers of neurodegenerative disorders: How good are they? Cell Res. 2004;14:349. doi: 10.1038/sj.cr.7290235. - DOI - PubMed

Publication types