

Responses of alpine summit vegetation under climate change in the transition zone between subtropical and tropical humid environment
- PMID: 35922458
- PMCID: PMC9349258
- DOI: 10.1038/s41598-022-17682-2
Responses of alpine summit vegetation under climate change in the transition zone between subtropical and tropical humid environment
Abstract
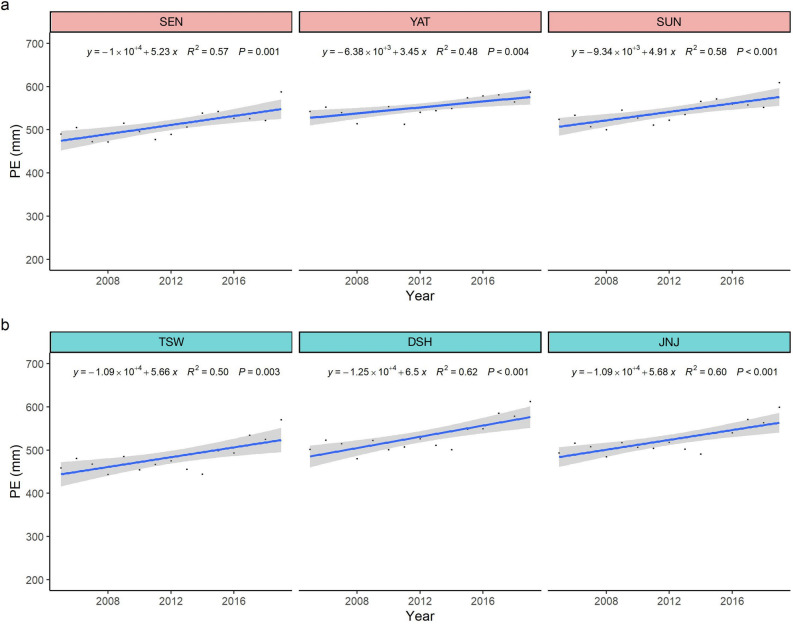
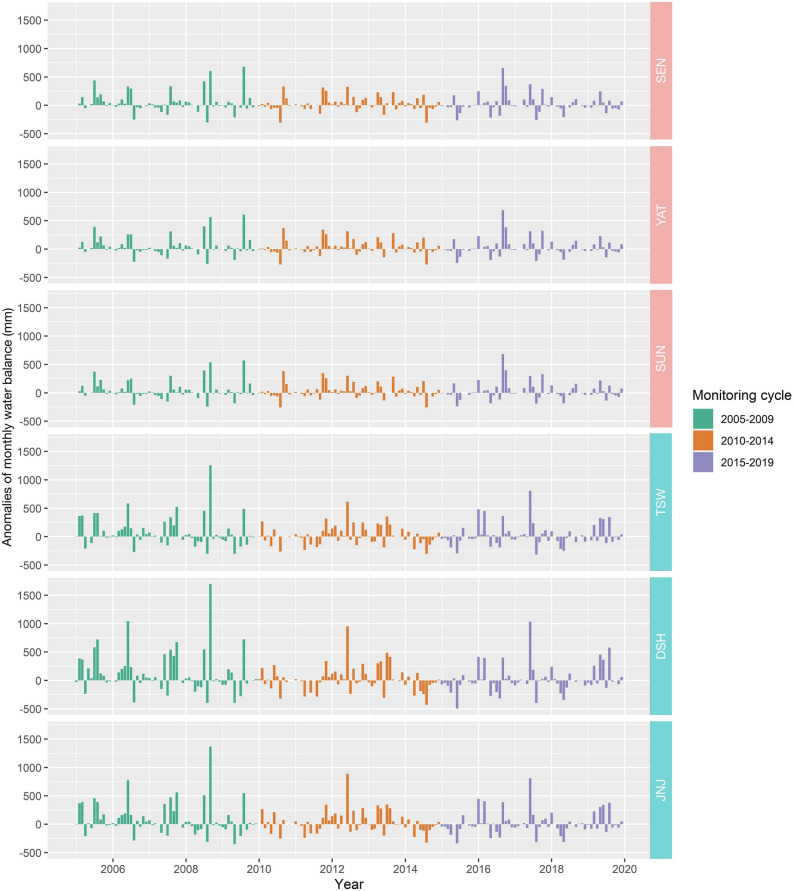
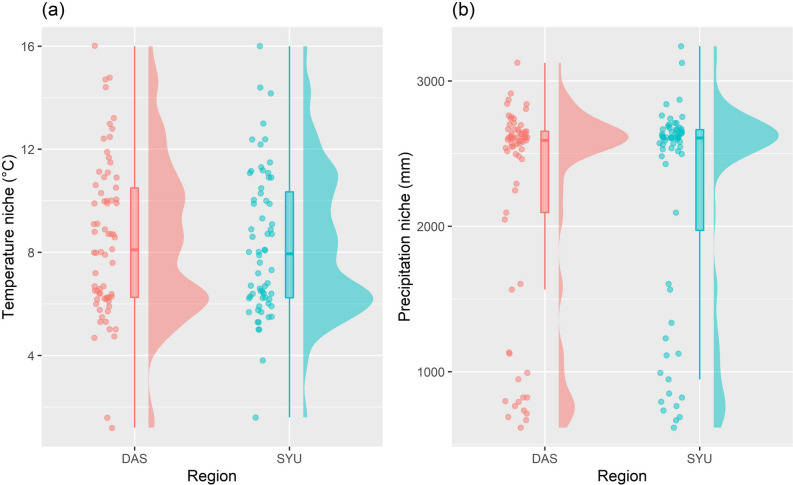
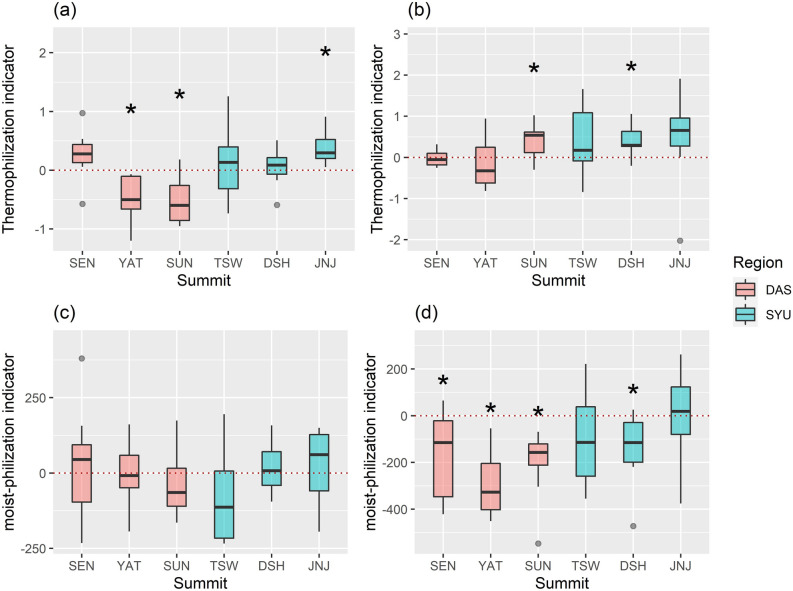
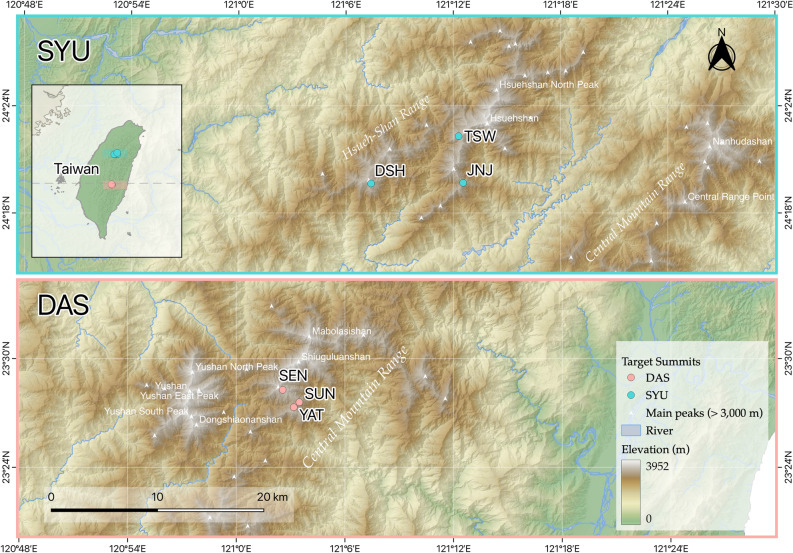
Climate change has caused severe impacts on ecosystems and biodiversity globally, especially to vulnerable mountain ecosystems; the summits bear the brunt of such effects. Therefore, six summits in Taiwan were monitored based on a standardized multi-summit approach. We used both statistical downscaling of climate data and vegetation cover data to calculate climate niches to assess the impacts of climate change. Two indicators, thermophilic and moist-philic, were applied to evaluate the overall response of vegetation dynamics. The results revealed that potential evapotranspiration increased significantly and led to a declining tendency in monthly water balance from 2014 to 2019. The general pattern of species richness was a decline. The difference in plant cover among the three surveys showed an inconsistent pattern, although some dominant species expanded, such as the dwarf bamboo Yushania niitakayamensis. The thermophilic indicator showed that species composition had changed so that there were more thermophilic species at the three lowest summits. The moist-philization indicator showed a decline of humid-preferred species in the latest monitoring period. Although total precipitation did not decrease, our results suggest that the variability in precipitation with increased temperature and potential evapotranspiration altered alpine vegetation composition and could endanger vulnerable species in the future.
© 2022. The Author(s).
Conflict of interest statement
The authors declare no competing interests.
Figures


Similar articles
-
Rapid changes in eastern Himalayan alpine flora with climate change.Am J Bot. 2019 Apr;106(4):520-530. doi: 10.1002/ajb2.1263. Epub 2019 Apr 1. Am J Bot. 2019. PMID: 30934119
-
Recent changes in high-mountain plant community functional composition in contrasting climate regimes.Sci Total Environ. 2022 Jul 10;829:154541. doi: 10.1016/j.scitotenv.2022.154541. Epub 2022 Mar 15. Sci Total Environ. 2022. PMID: 35302025
-
Early Evidence of Shifts in Alpine Summit Vegetation: A Case Study From Kashmir Himalaya.Front Plant Sci. 2020 Apr 24;11:421. doi: 10.3389/fpls.2020.00421. eCollection 2020. Front Plant Sci. 2020. PMID: 32391033 Free PMC article.
-
Alpine vegetation in the context of climate change: A global review of past research and future directions.Sci Total Environ. 2020 Dec 15;748:141344. doi: 10.1016/j.scitotenv.2020.141344. Epub 2020 Aug 2. Sci Total Environ. 2020. PMID: 32814293 Review.
-
Himalayan alpine ecohydrology: An urgent scientific concern in a changing climate.Ambio. 2023 Feb;52(2):390-410. doi: 10.1007/s13280-022-01792-2. Epub 2022 Nov 2. Ambio. 2023. PMID: 36324019 Free PMC article. Review.
Cited by
-
Assessing the impact of global warming on the distributions of Allium stipitatum and Kelussia odoratissima in the Central Zagros using a MaxEnt model.PLoS One. 2025 Apr 16;20(4):e0321167. doi: 10.1371/journal.pone.0321167. eCollection 2025. PLoS One. 2025. PMID: 40238752 Free PMC article.
References
-
- Gottfried M, et al. Continent-wide response of mountain vegetation to climate change. Nat. Clim. Change. 2012;2:111–115. doi: 10.1038/nclimate1329. - DOI
-
- Gigauri K, Akhalkatsi M, Abdaladze O, Nakhutsrishvili G. Alpine plant distribution and thermic vegetation indicator on GLORIA summits in the Central Greater Caucasus. Pak. J. Bot. 2016;48:1893–1902.
-
- Gritsch A, Dirnböck T, Dullinger S. Recent changes in alpine vegetation differ among plant communities. J. Veg. Sci. 2016;27:1177–1186. doi: 10.1111/jvs.12447. - DOI
Publication types
MeSH terms
LinkOut - more resources
Full Text Sources
Medical
Research Materials
