

High-throughput proteomics: a methodological mini-review
- PMID: 35922478
- PMCID: PMC9362039
- DOI: 10.1038/s41374-022-00830-7
High-throughput proteomics: a methodological mini-review
Abstract
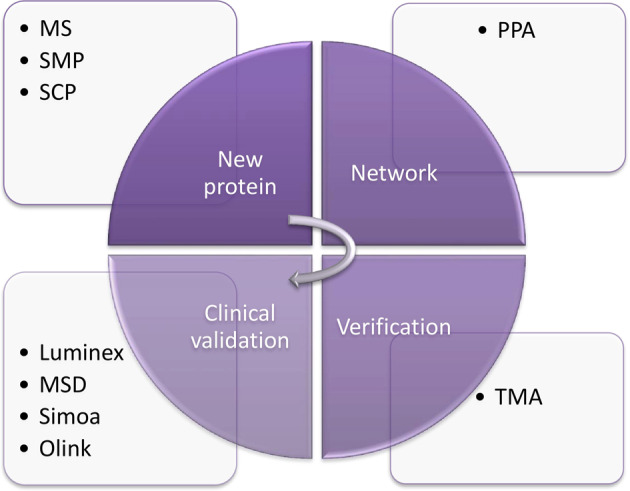
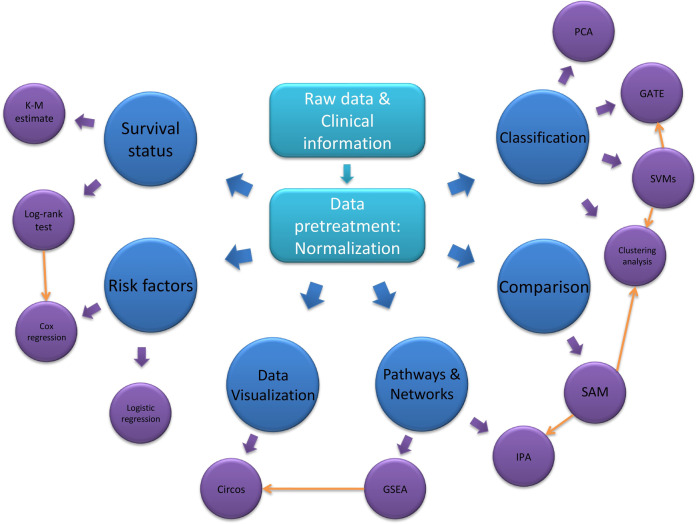
Proteomics plays a vital role in biomedical research in the post-genomic era. With the technological revolution and emerging computational and statistic models, proteomic methodology has evolved rapidly in the past decade and shed light on solving complicated biomedical problems. Here, we summarize scientific research and clinical practice of existing and emerging high-throughput proteomics approaches, including mass spectrometry, protein pathway array, next-generation tissue microarrays, single-cell proteomics, single-molecule proteomics, Luminex, Simoa and Olink Proteomics. We also discuss important computational methods and statistical algorithms that can maximize the mining of proteomic data with clinical and/or other 'omics data. Various principles and precautions are provided for better utilization of these tools. In summary, the advances in high-throughput proteomics will not only help better understand the molecular mechanisms of pathogenesis, but also to identify the signature signaling networks of specific diseases. Thus, modern proteomics have a range of potential applications in basic research, prognostic oncology, precision medicine, and drug discovery.
© 2022. The Author(s), under exclusive licence to United States and Canadian Academy of Pathology.
Conflict of interest statement
The authors declare no competing interests.
Figures
Similar articles
-
Emerging mass spectrometry-based proteomics methodologies for novel biomedical applications.Biochem Soc Trans. 2020 Oct 30;48(5):1953-1966. doi: 10.1042/BST20191091. Biochem Soc Trans. 2020. PMID: 33079175 Free PMC article. Review.
-
From imaging a single cell to implementing precision medicine: an exciting new era.Emerg Top Life Sci. 2021 Dec 21;5(6):837-847. doi: 10.1042/ETLS20210219. Emerg Top Life Sci. 2021. PMID: 34889448 Free PMC article.
-
Omics-Based Strategies in Precision Medicine: Toward a Paradigm Shift in Inborn Errors of Metabolism Investigations.Int J Mol Sci. 2016 Sep 14;17(9):1555. doi: 10.3390/ijms17091555. Int J Mol Sci. 2016. PMID: 27649151 Free PMC article. Review.
-
Proteomics technologies and challenges.Genomics Proteomics Bioinformatics. 2007 May;5(2):77-85. doi: 10.1016/S1672-0229(07)60018-7. Genomics Proteomics Bioinformatics. 2007. PMID: 17893073 Free PMC article. Review.
-
The Emerging Role of Proteomics in Precision Medicine: Applications in Neurodegenerative Diseases and Neurotrauma.Adv Exp Med Biol. 2017;1007:59-70. doi: 10.1007/978-3-319-60733-7_4. Adv Exp Med Biol. 2017. PMID: 28840552 Review.
Cited by
-
[Research progress on bioinformatics in pulmonary arterial hypertension].Zhongguo Dang Dai Er Ke Za Zhi. 2024 Apr 15;26(4):425-431. doi: 10.7499/j.issn.1008-8830.2310076. Zhongguo Dang Dai Er Ke Za Zhi. 2024. PMID: 38660909 Free PMC article. Review. Chinese.
-
Proteomic profiling reveals biological processes and biomarkers involved in the pathogenesis of occult breast cancer.BMC Cancer. 2025 Feb 10;25(1):231. doi: 10.1186/s12885-025-13657-4. BMC Cancer. 2025. PMID: 39930421 Free PMC article.
-
Normalization and Selecting Non-Differentially Expressed Genes Improve Machine Learning Modelling of Cross-Platform Transcriptomic Data.Trans Artif Intell. 2025;1(1):5. doi: 10.53941/tai.2025.100005. Epub 2025 May 25. Trans Artif Intell. 2025. PMID: 40630982 Free PMC article.
-
Blood Plasma Proteome: A Meta-Analysis of the Results of Protein Quantification in Human Blood by Targeted Mass Spectrometry.Int J Mol Sci. 2023 Jan 1;24(1):769. doi: 10.3390/ijms24010769. Int J Mol Sci. 2023. PMID: 36614211 Free PMC article.
-
Back to the Basics: Usefulness of Naturally Aged Mouse Models and Immunohistochemical and Quantitative Morphologic Methods in Studying Mechanisms of Lung Aging and Associated Diseases.Biomedicines. 2023 Jul 24;11(7):2075. doi: 10.3390/biomedicines11072075. Biomedicines. 2023. PMID: 37509714 Free PMC article. Review.
References
-
- Mathivanan S. Integrated Bioinformatics Analysis of the Publicly Available Protein Data Shows Evidence for 96% of the Human Proteome. J Proteomics Bioinform. 2014;7:41–49. doi: 10.4172/jpb.1000301. - DOI
Publication types
MeSH terms
LinkOut - more resources
Full Text Sources
Other Literature Sources
Miscellaneous
