. 2022 Aug;608(7924):741-749.
doi: 10.1038/s41586-022-05057-6. Epub 2022 Aug 3.

Transformations of neural representations in a social behaviour network

Affiliations

Transformations of neural representations in a social behaviour network

Bin Yang et al. Nature. 2022 Aug.

Abstract

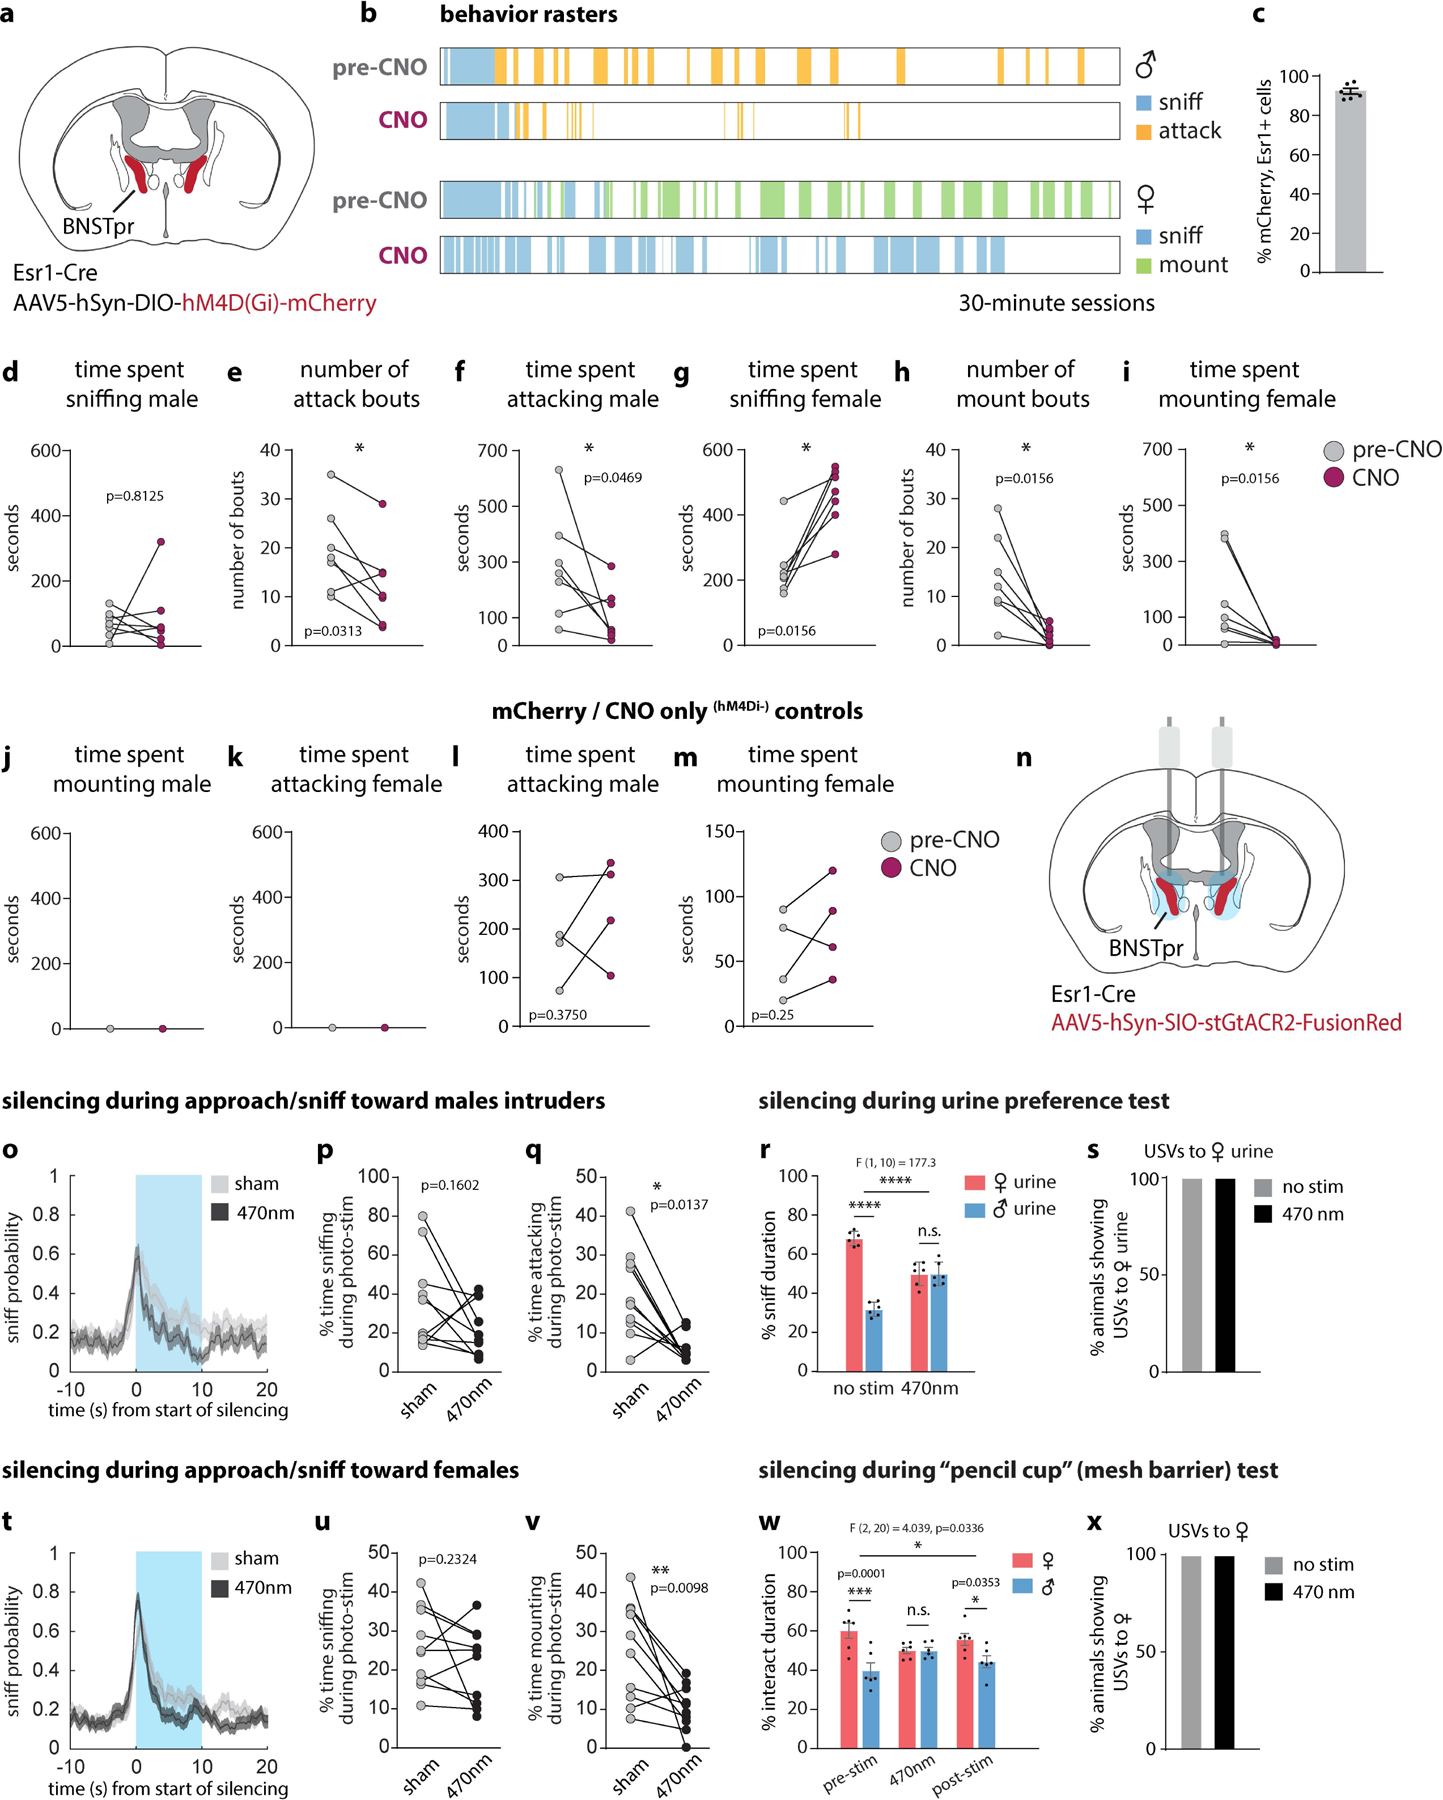
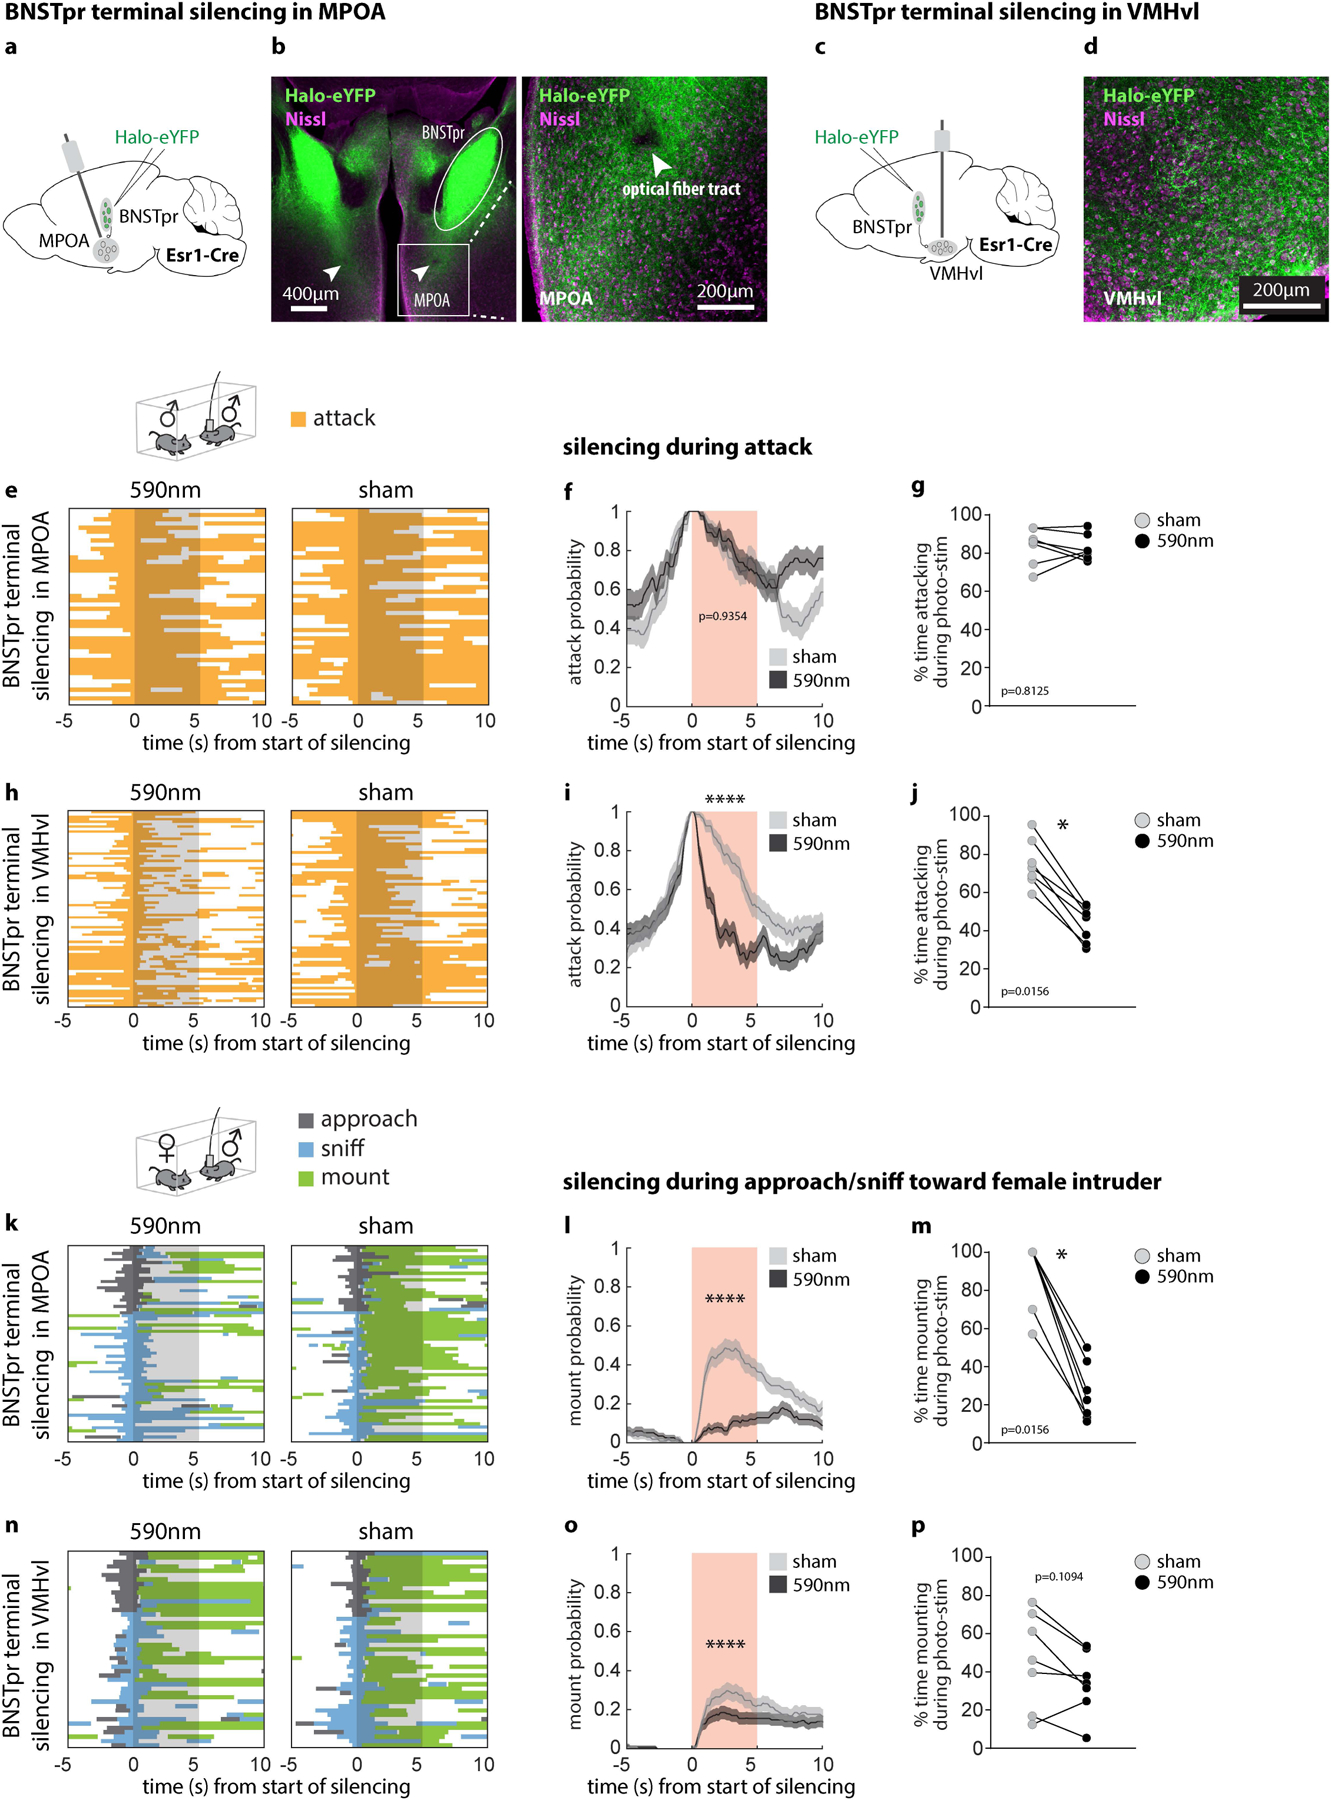
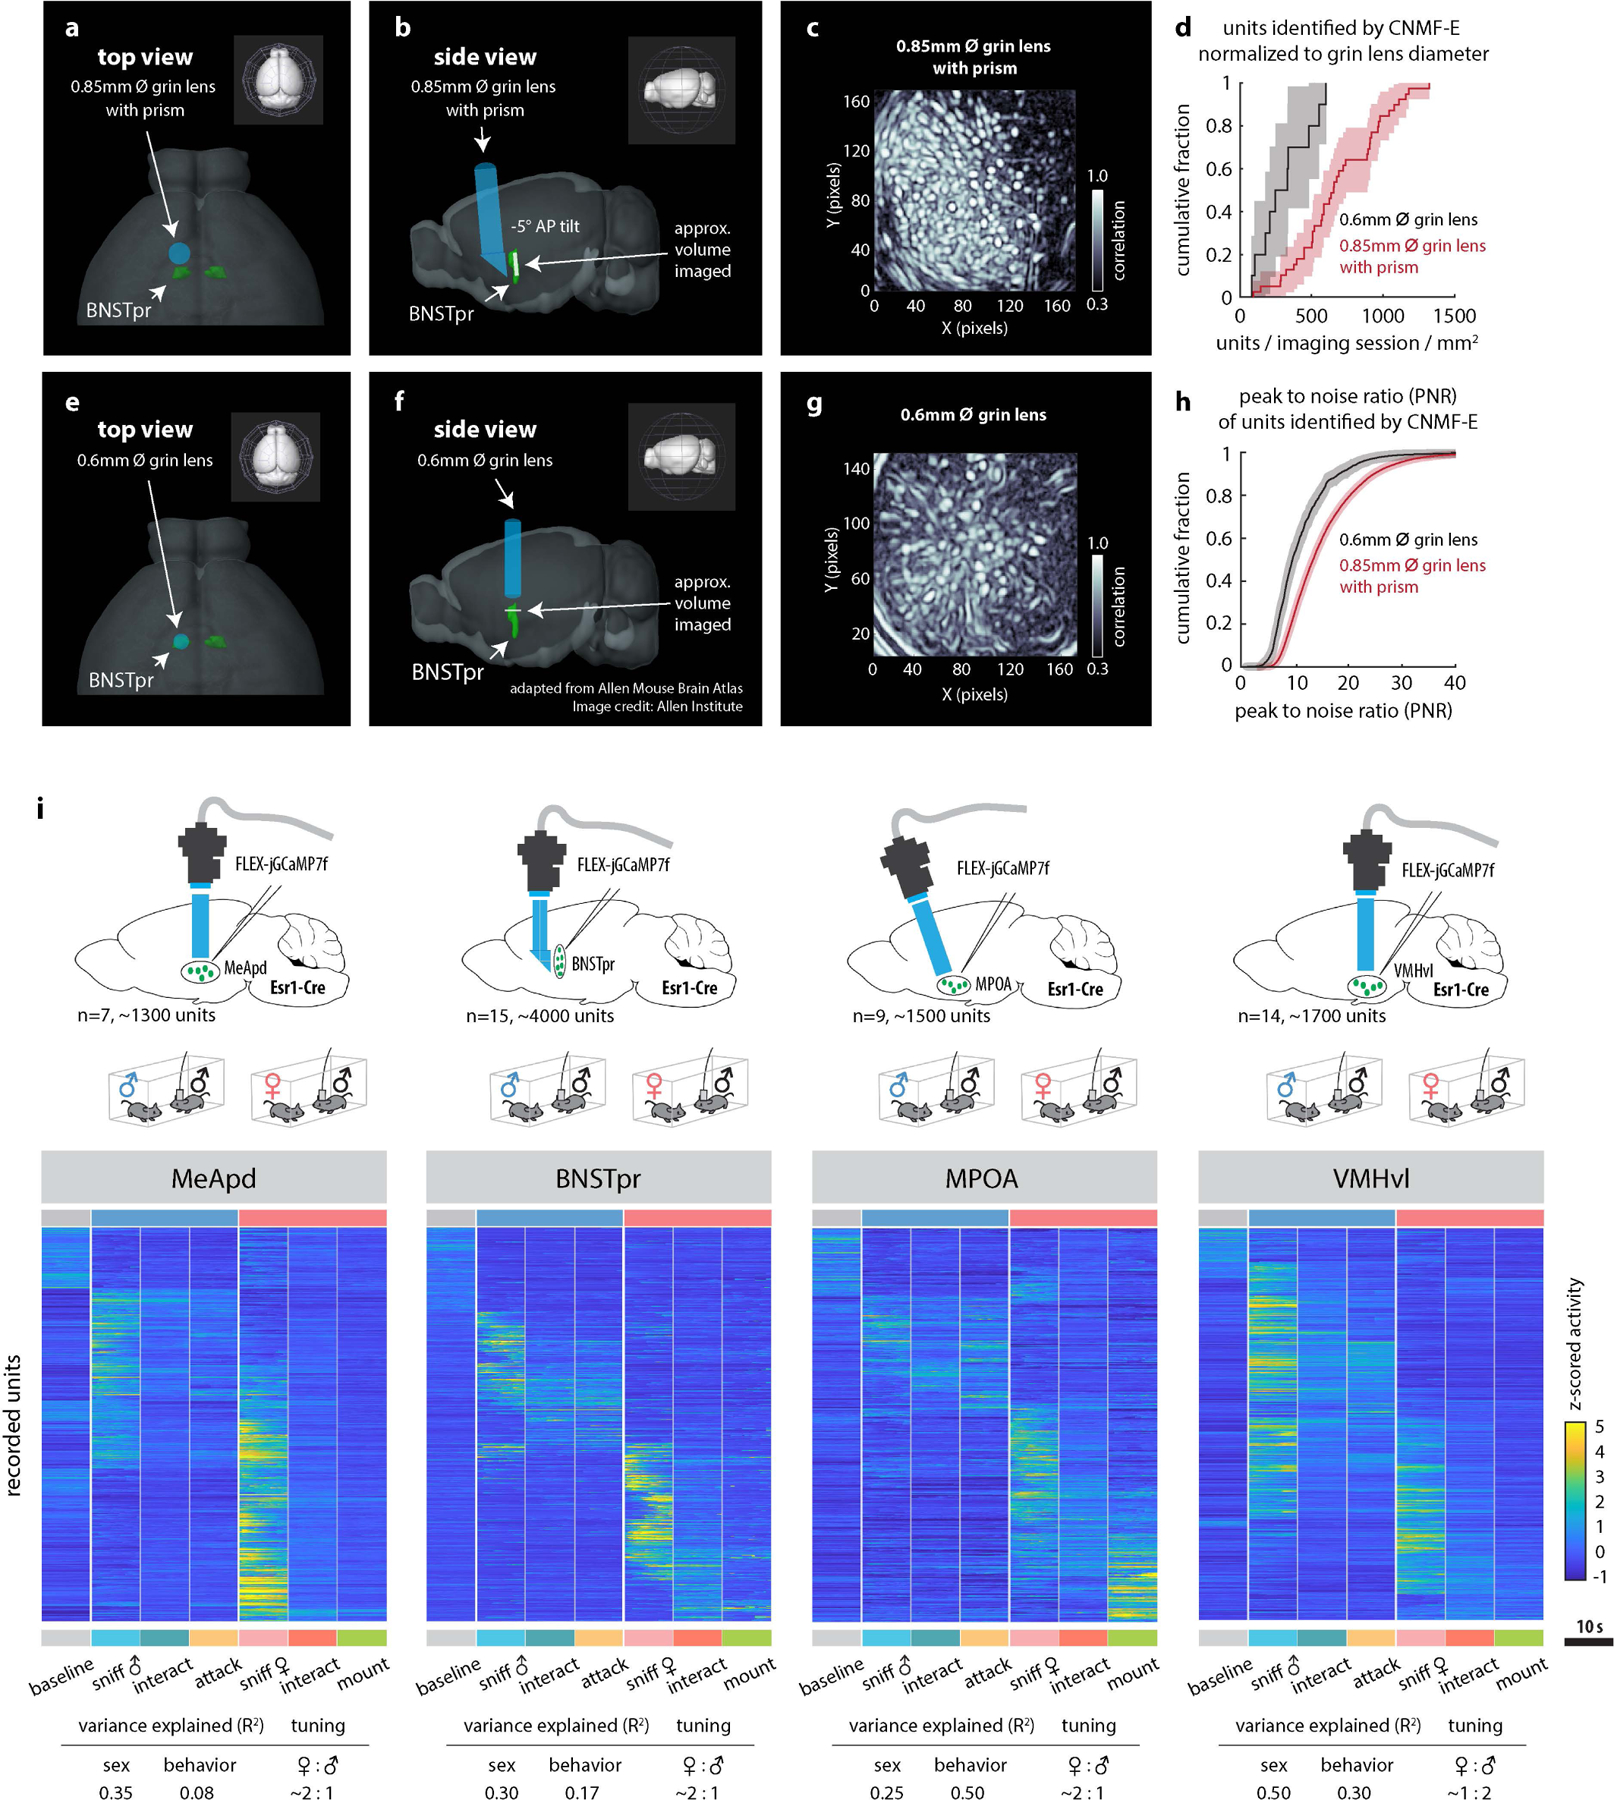
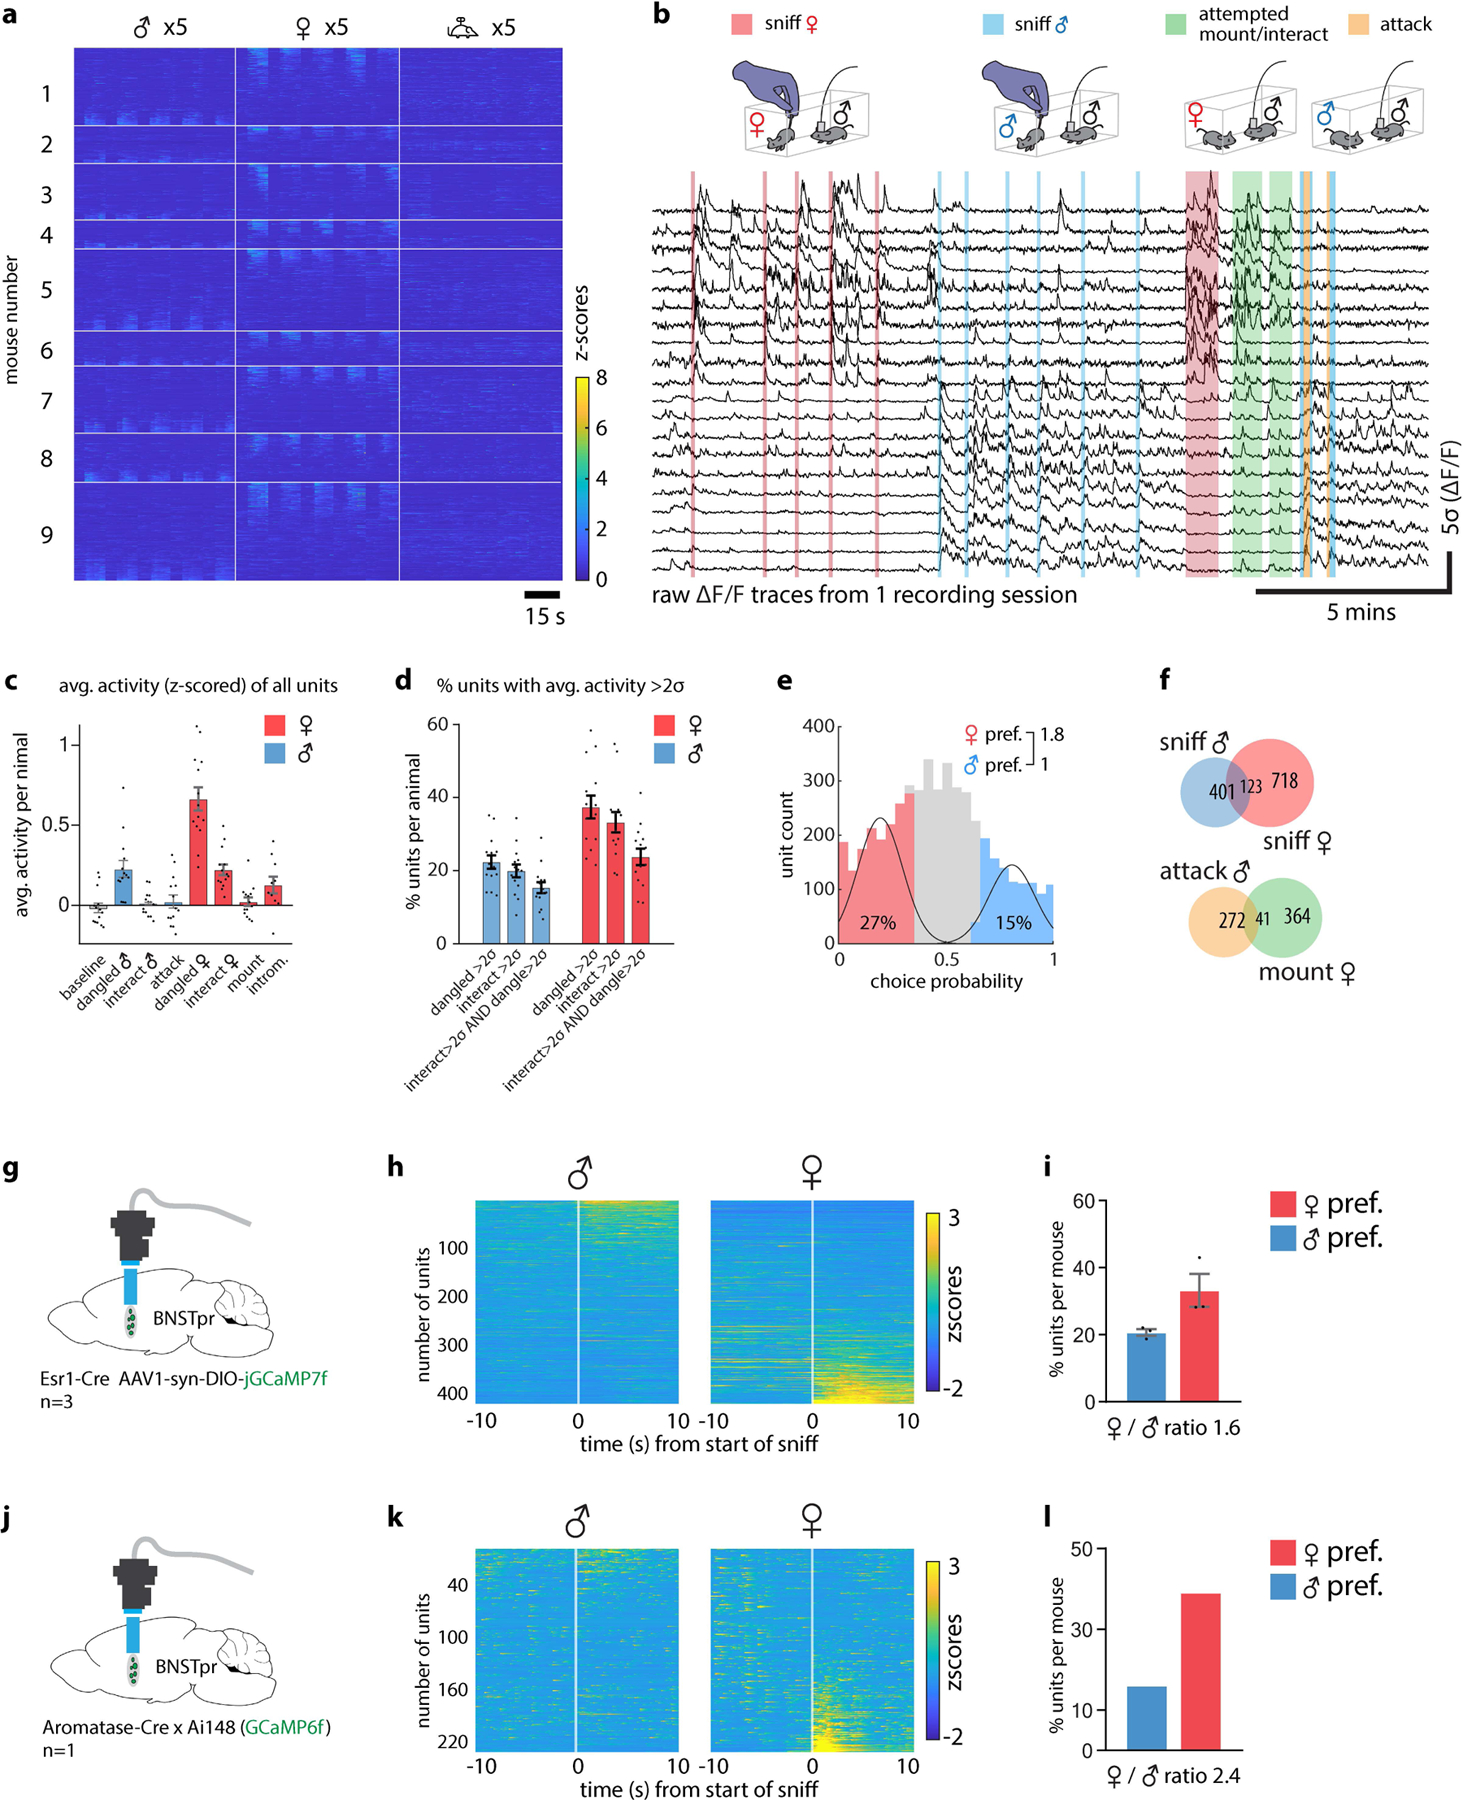
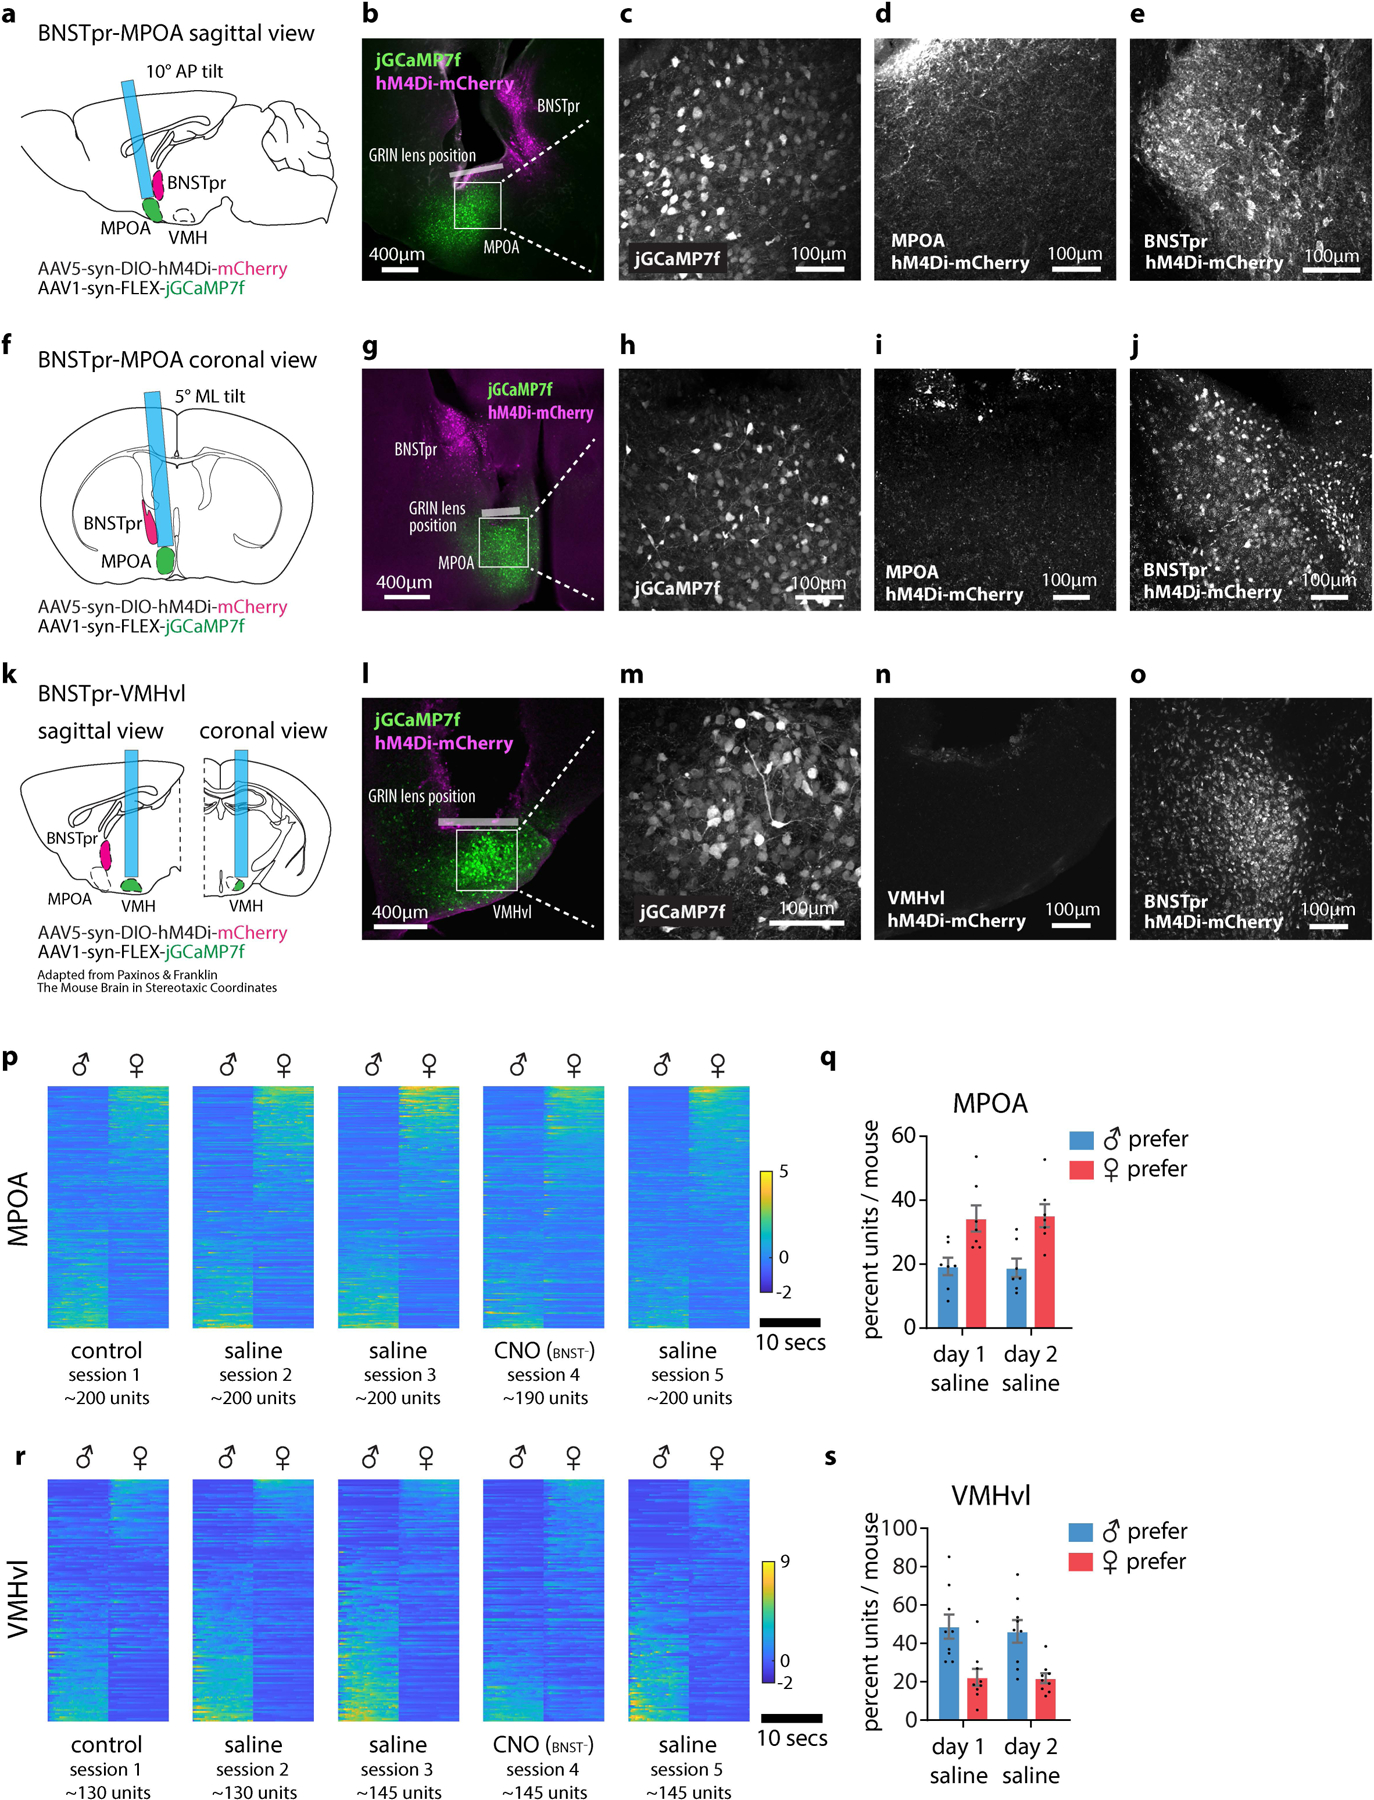
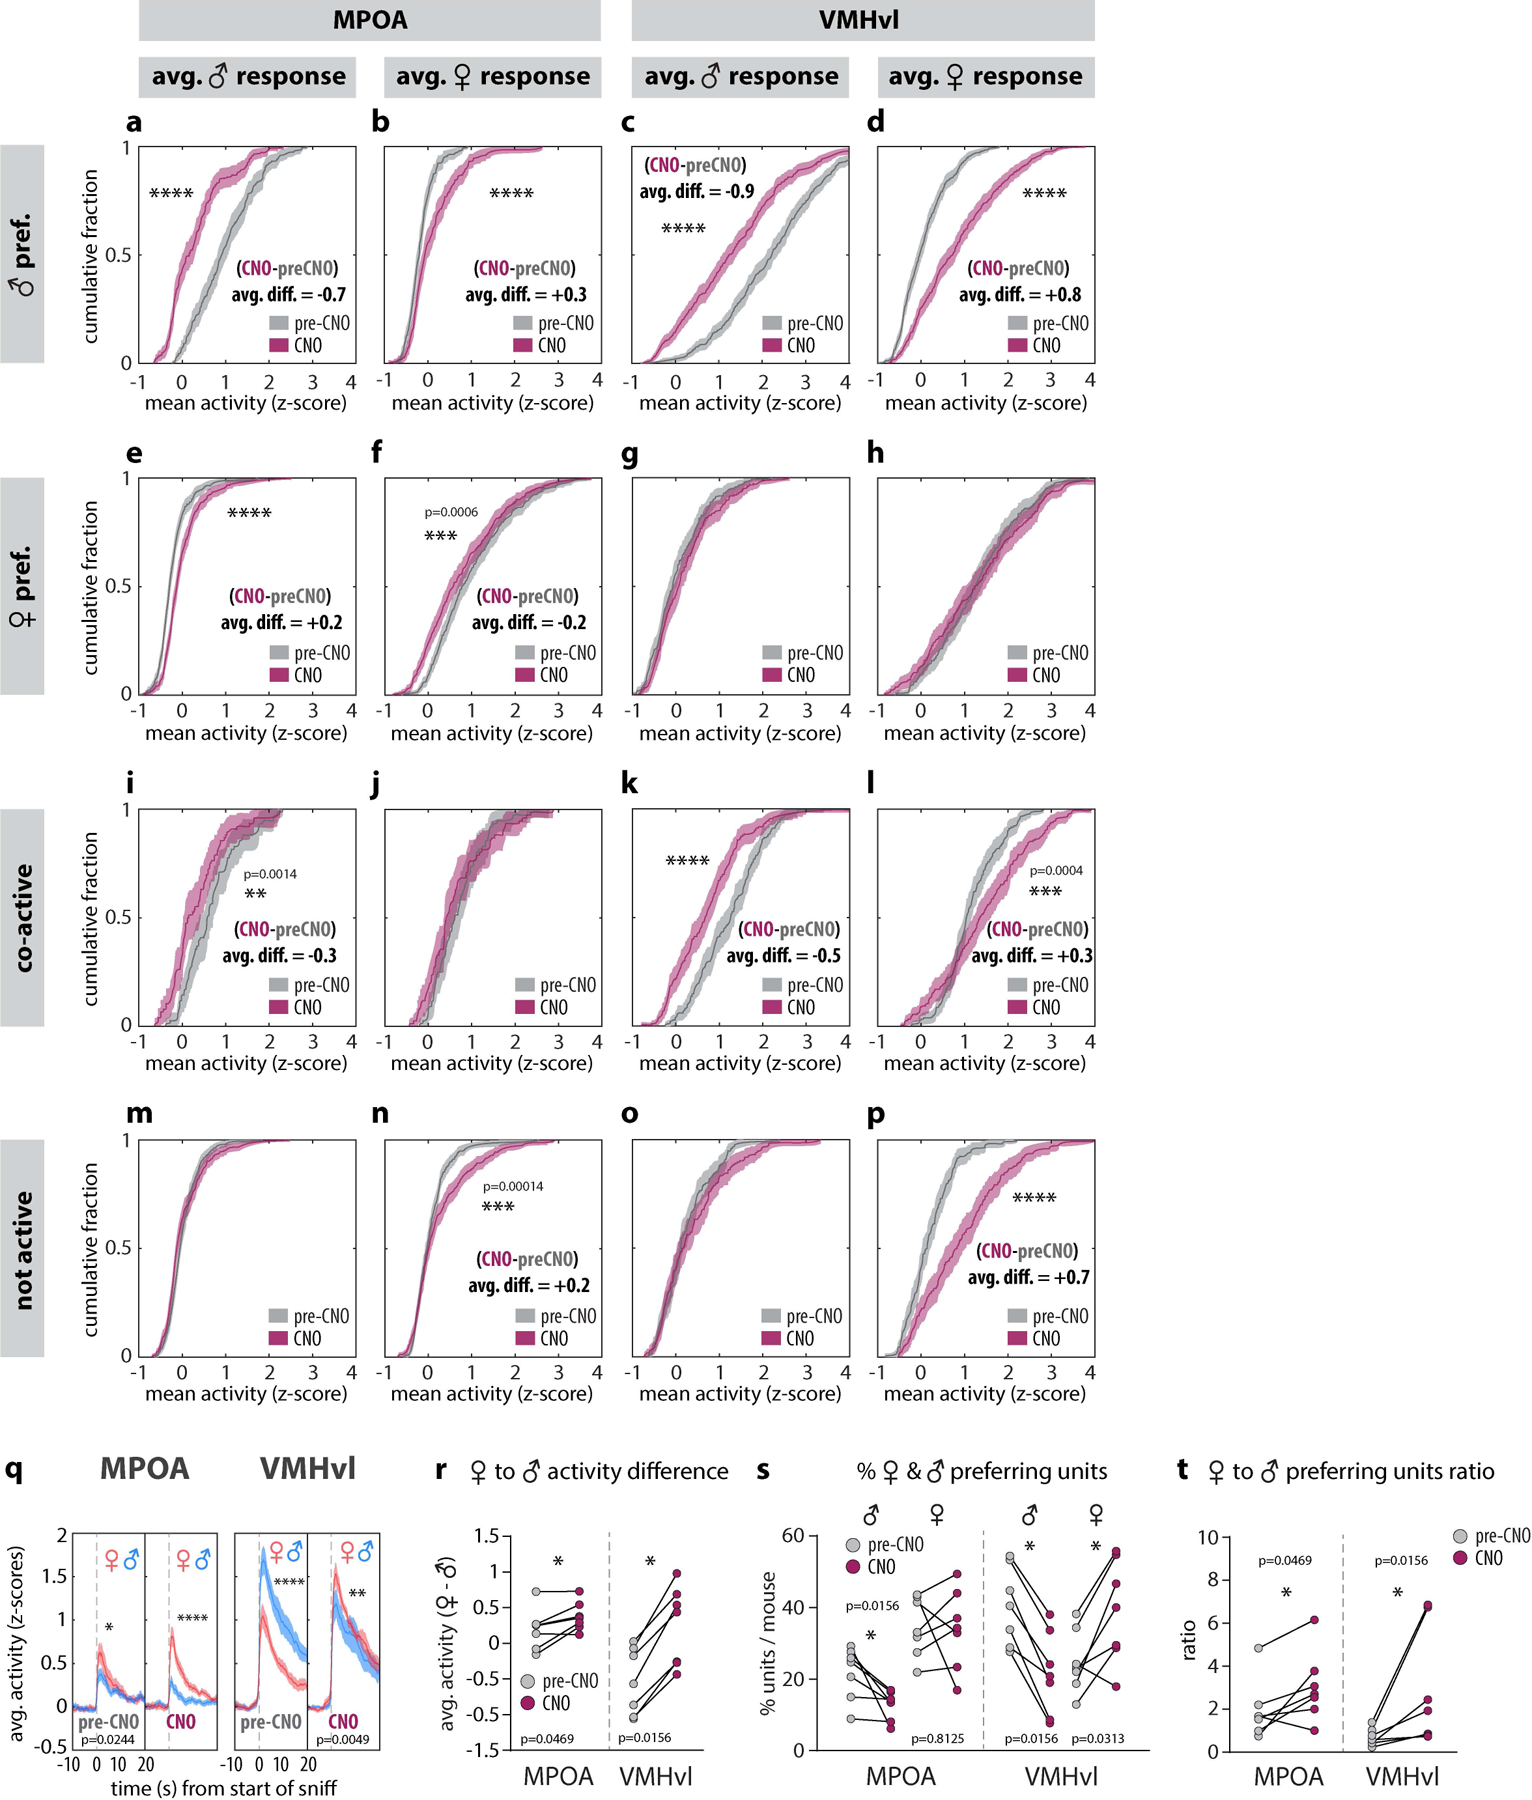
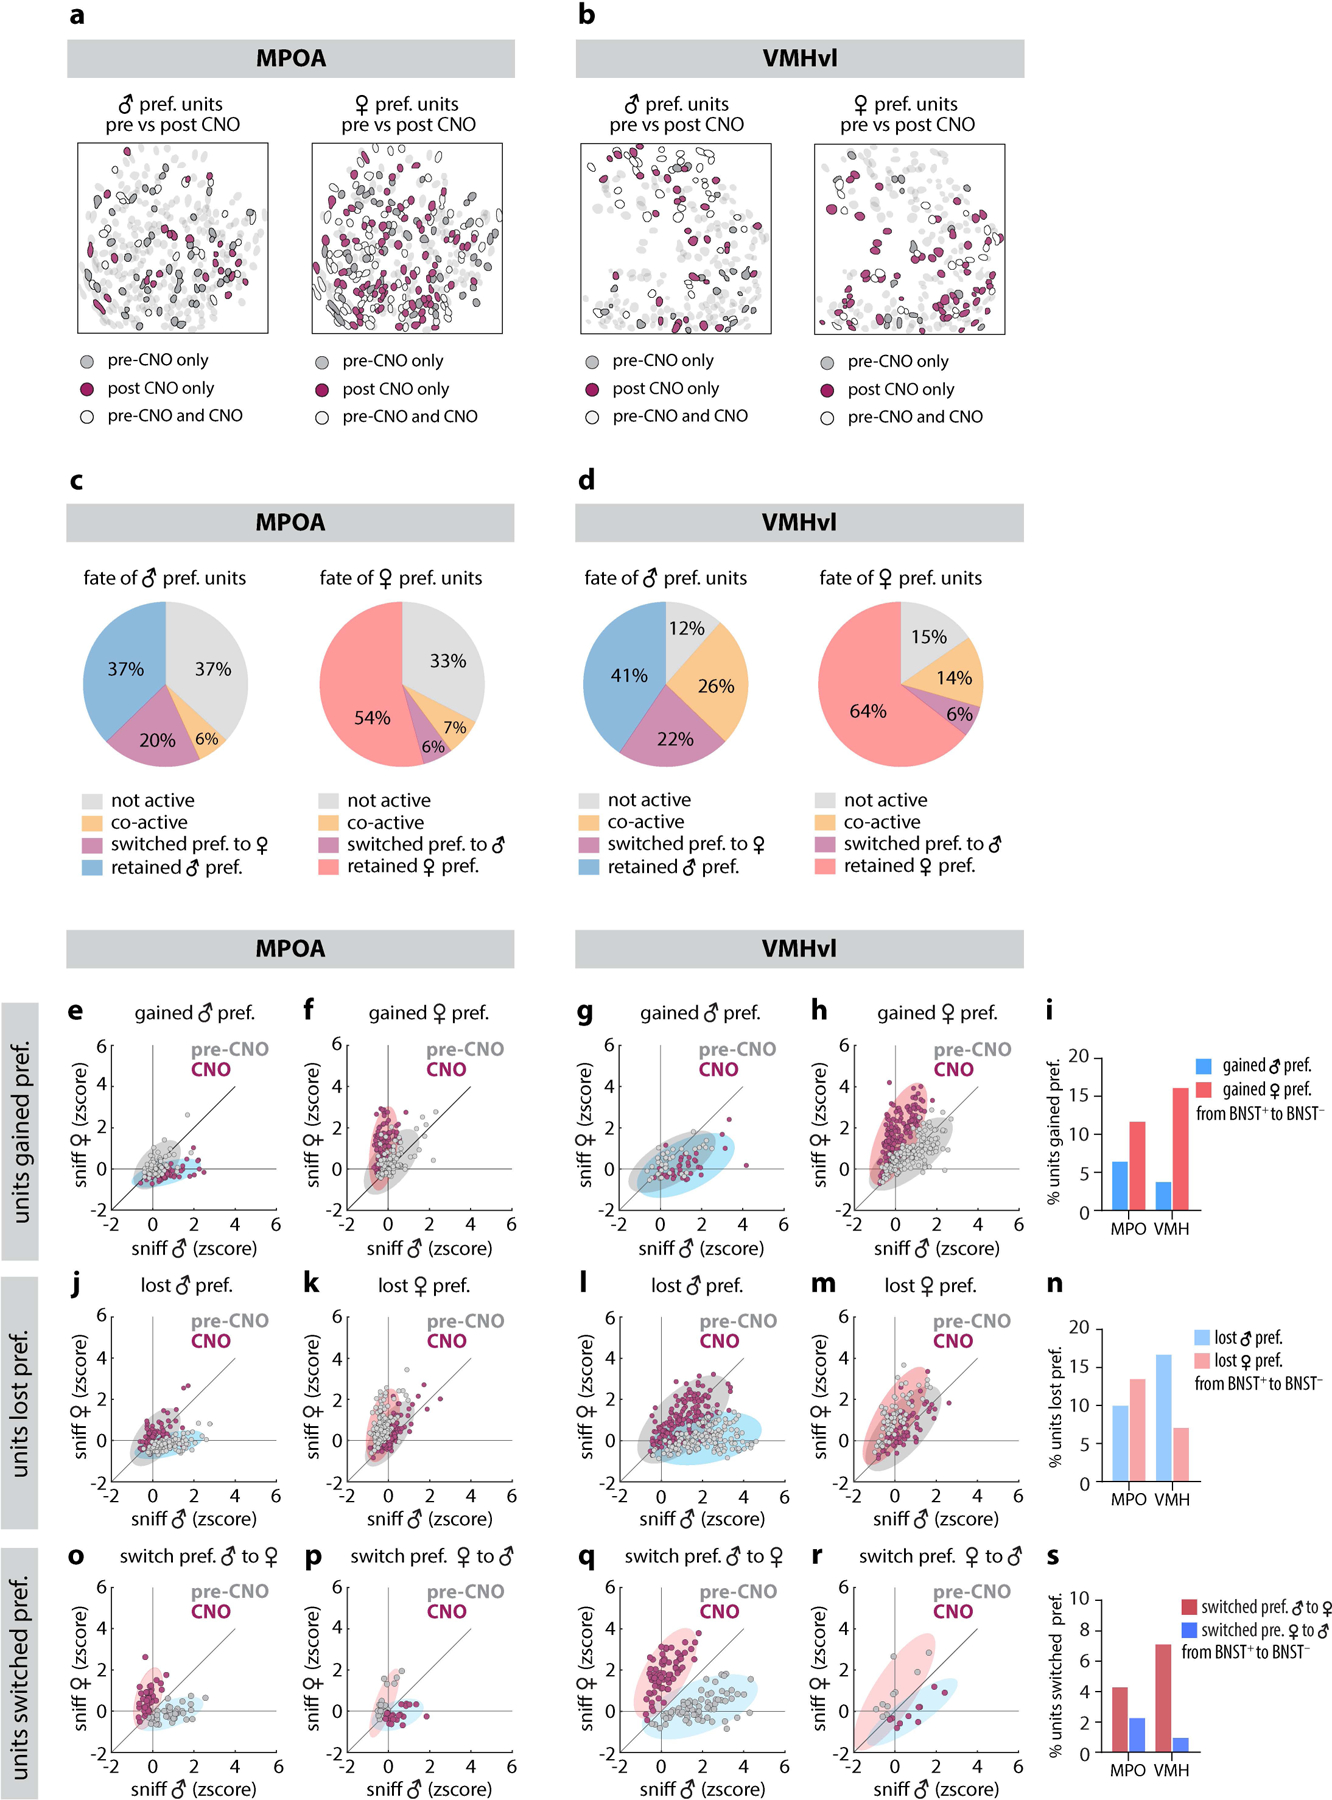
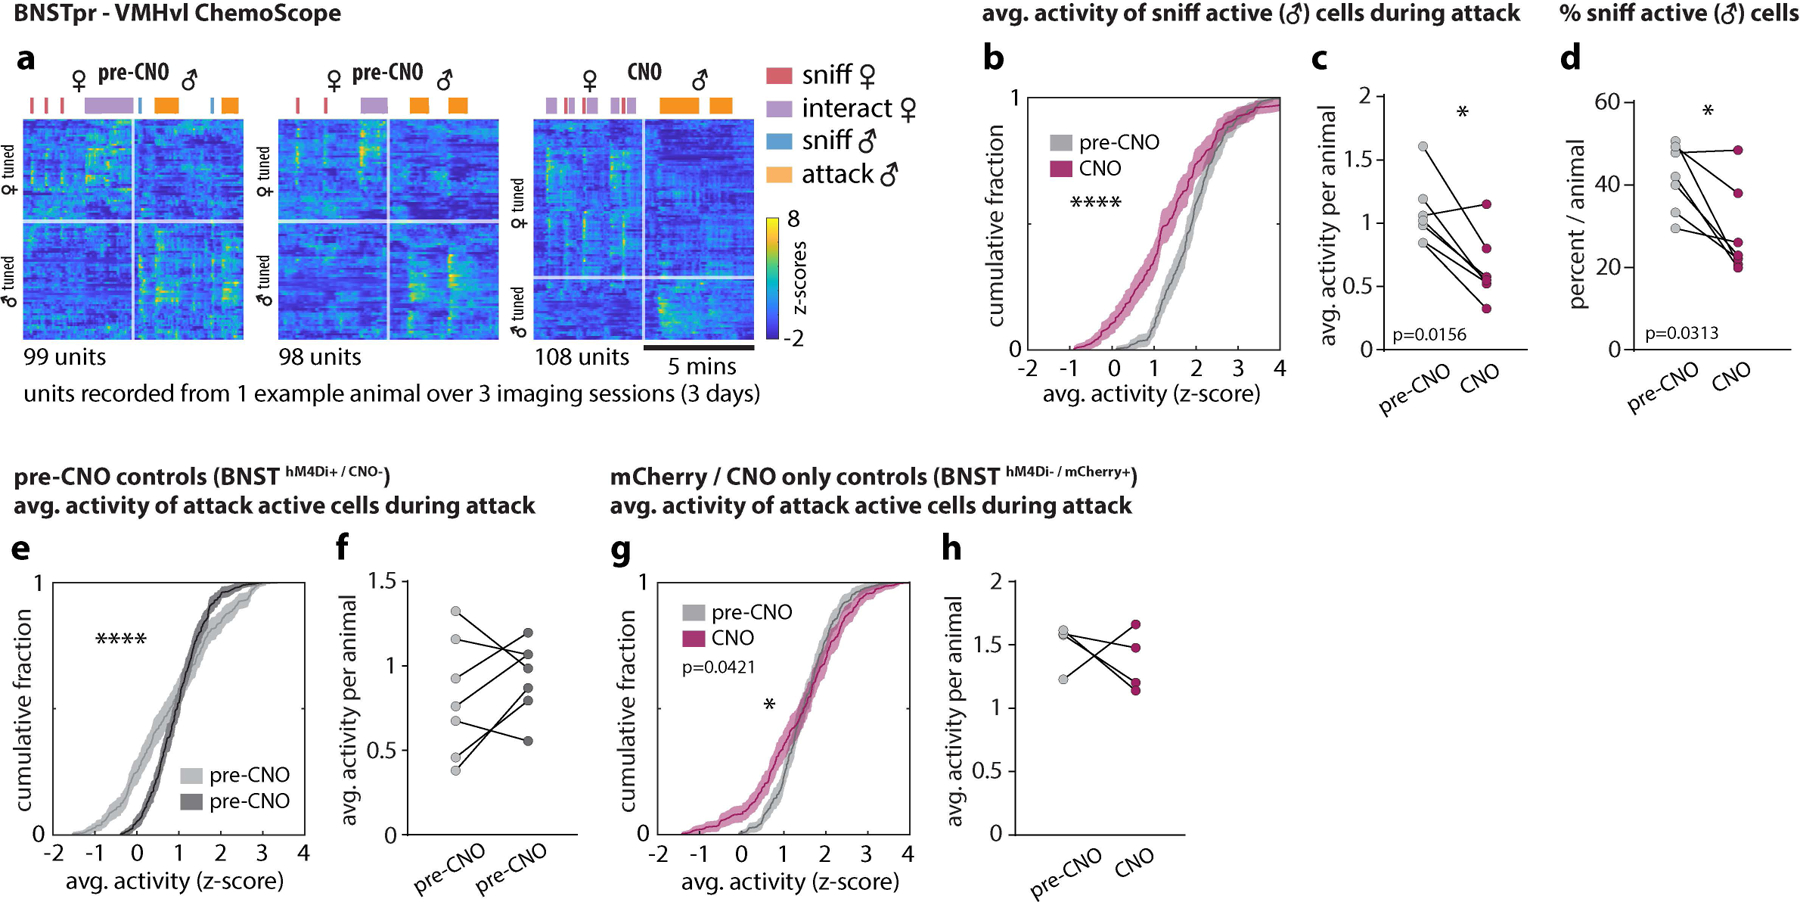
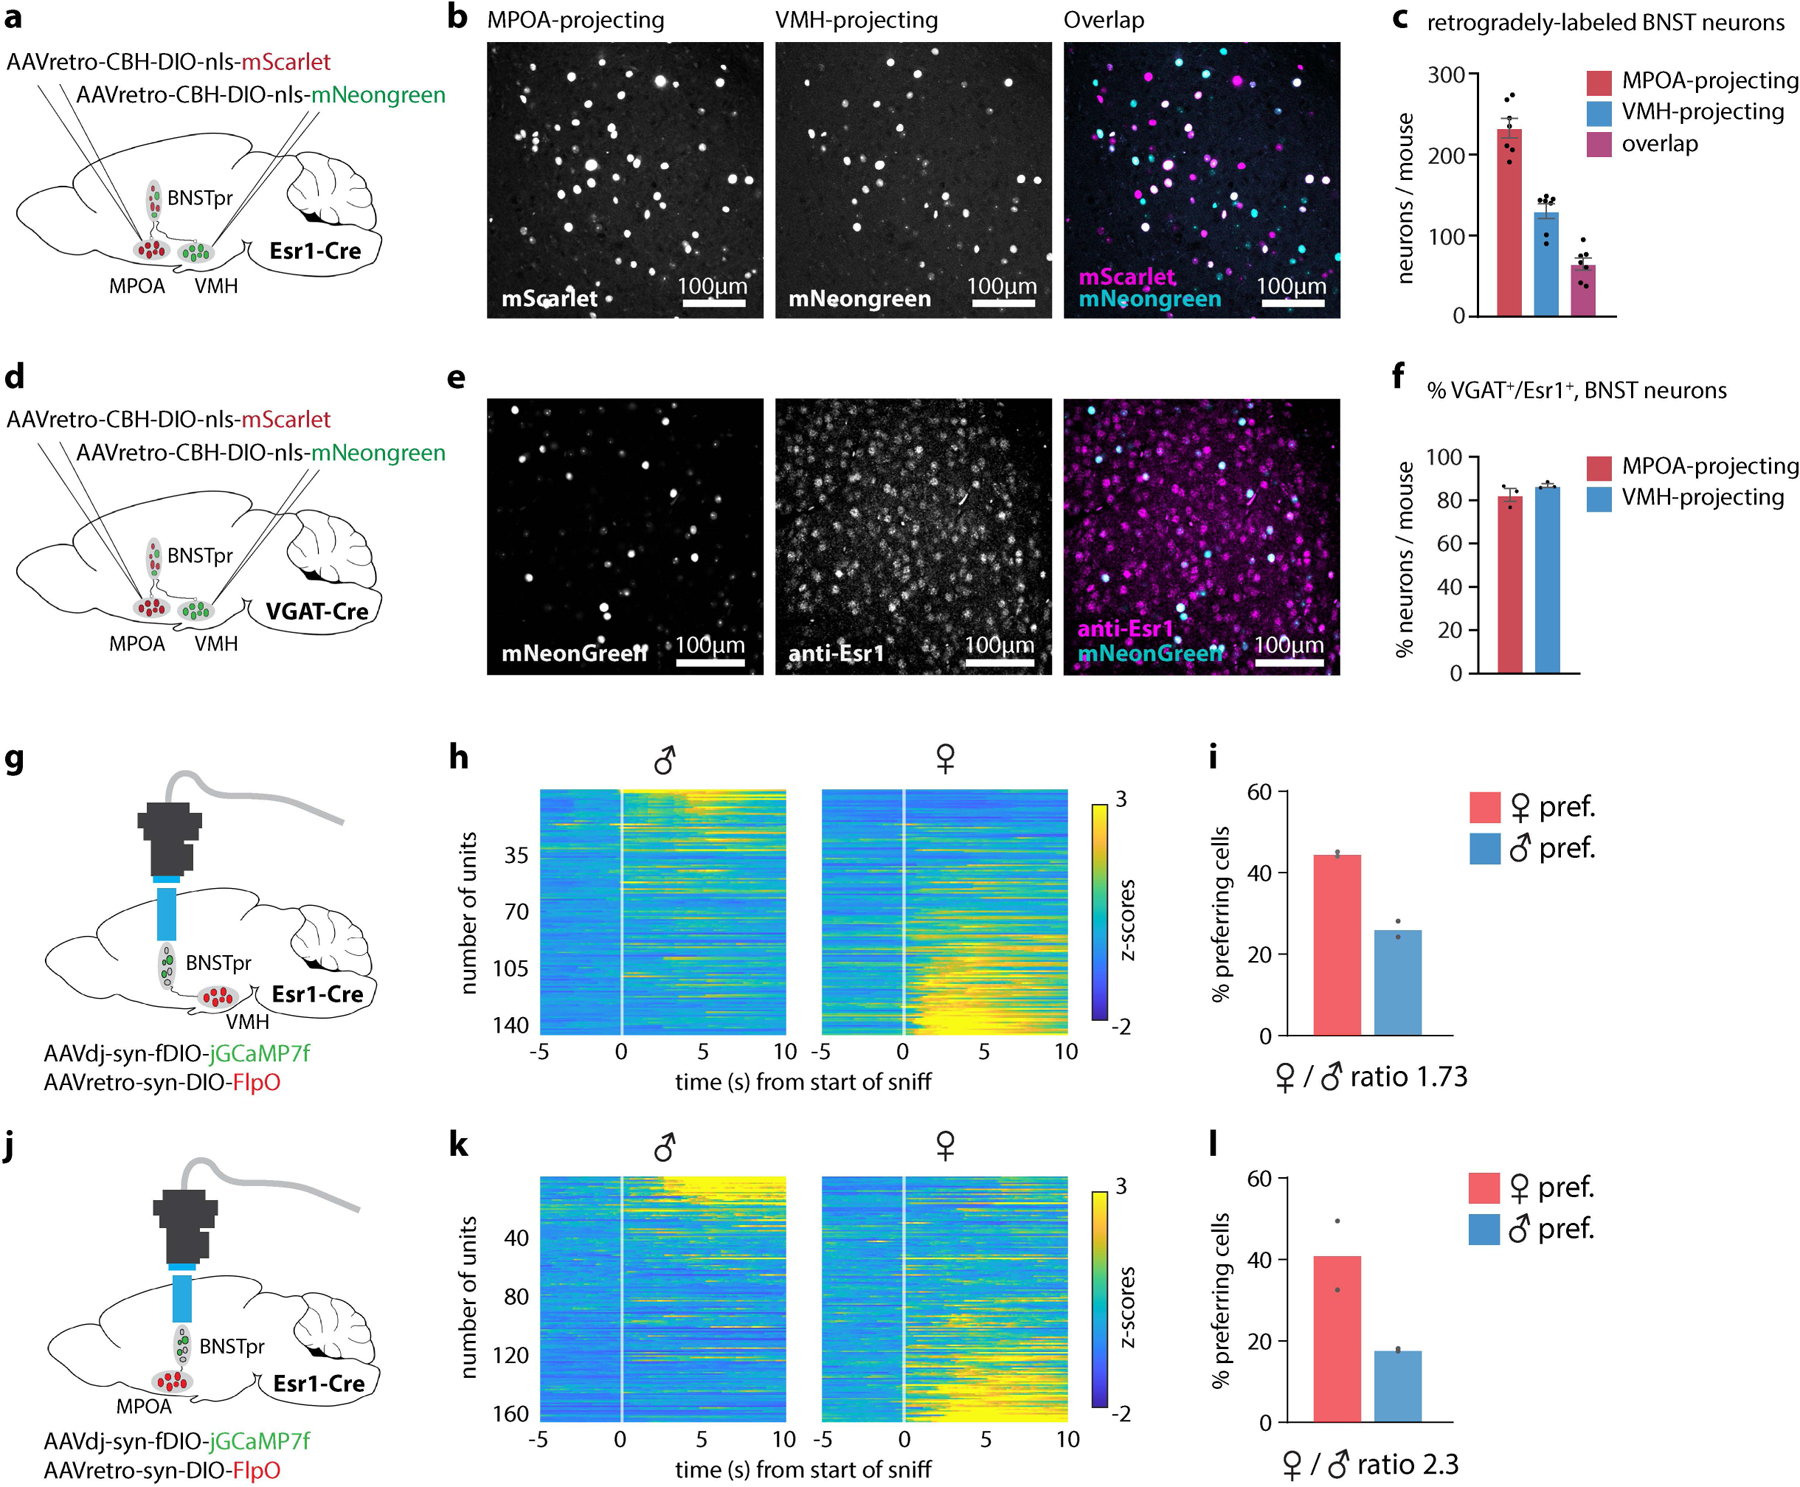
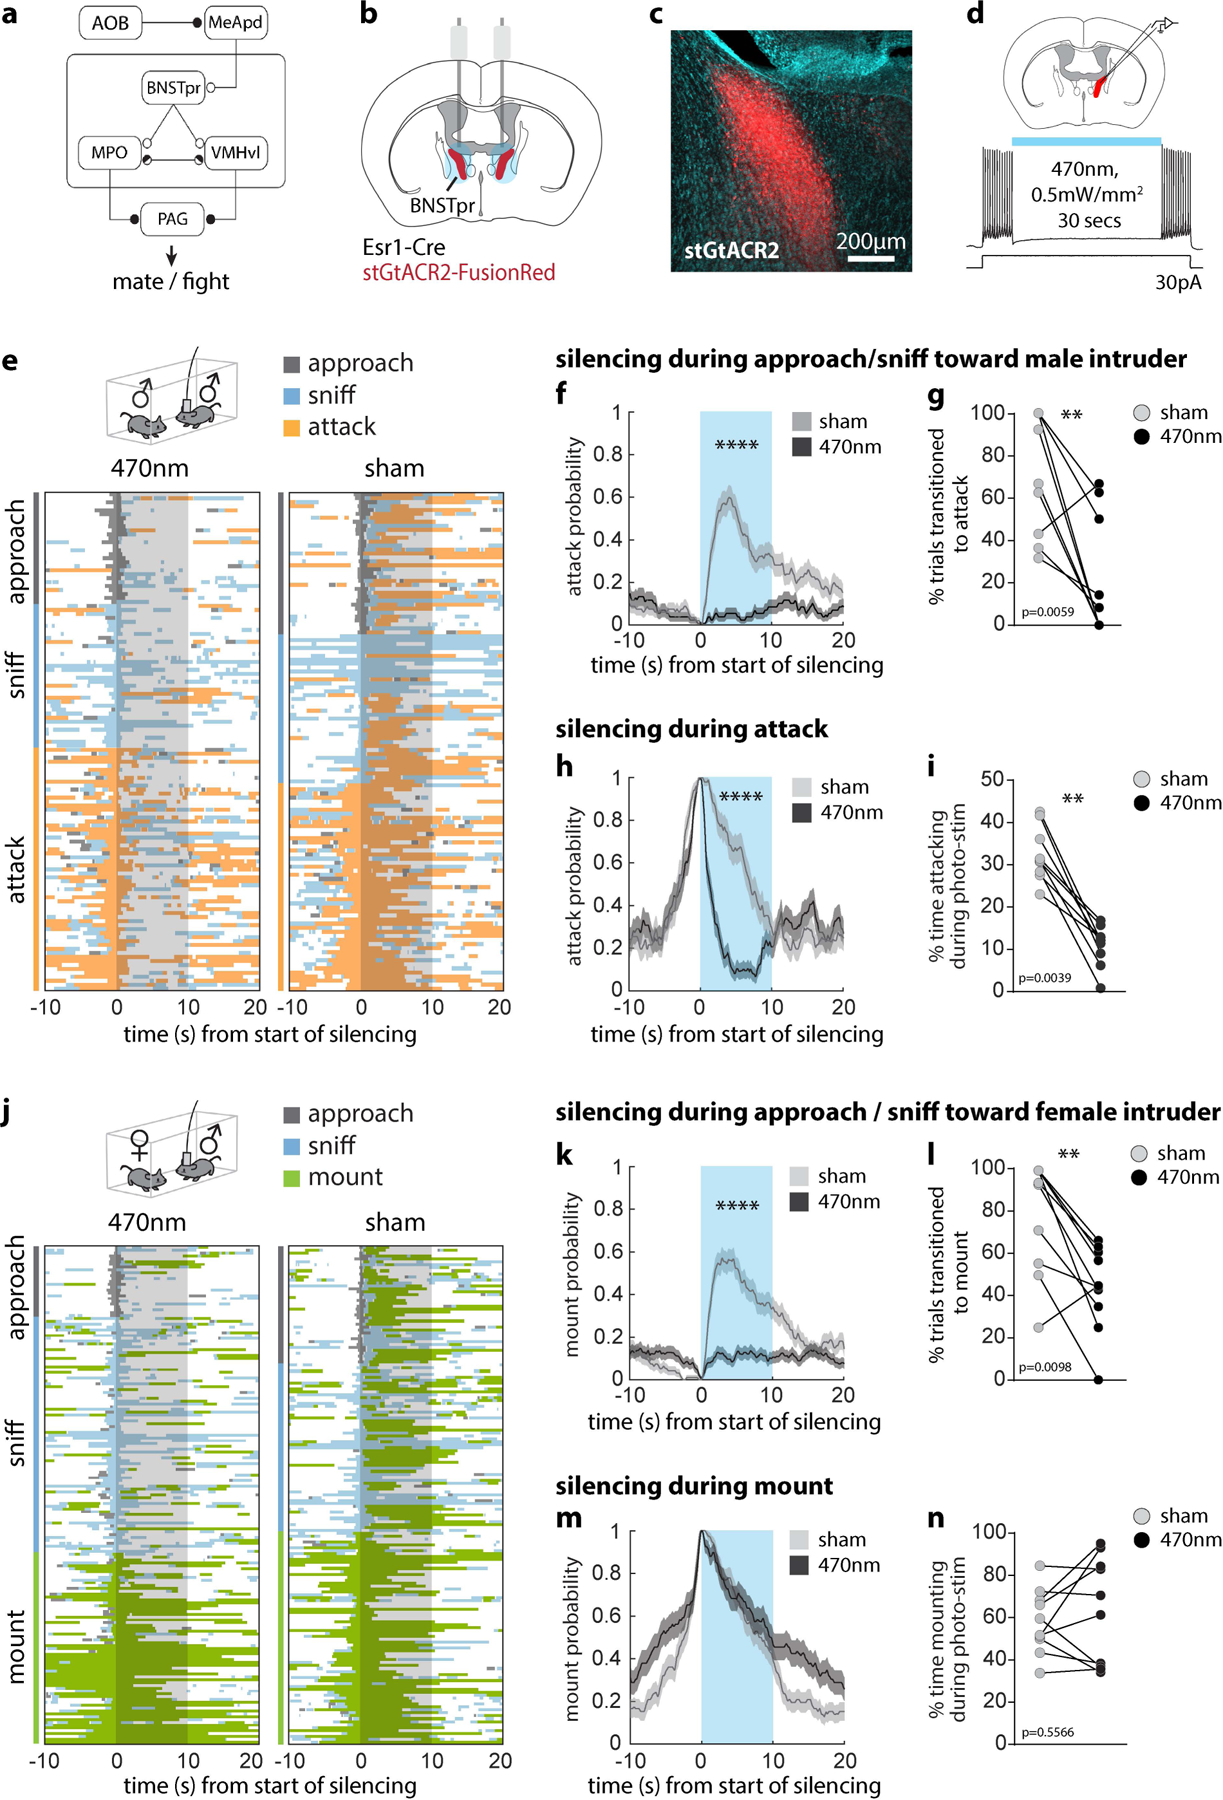
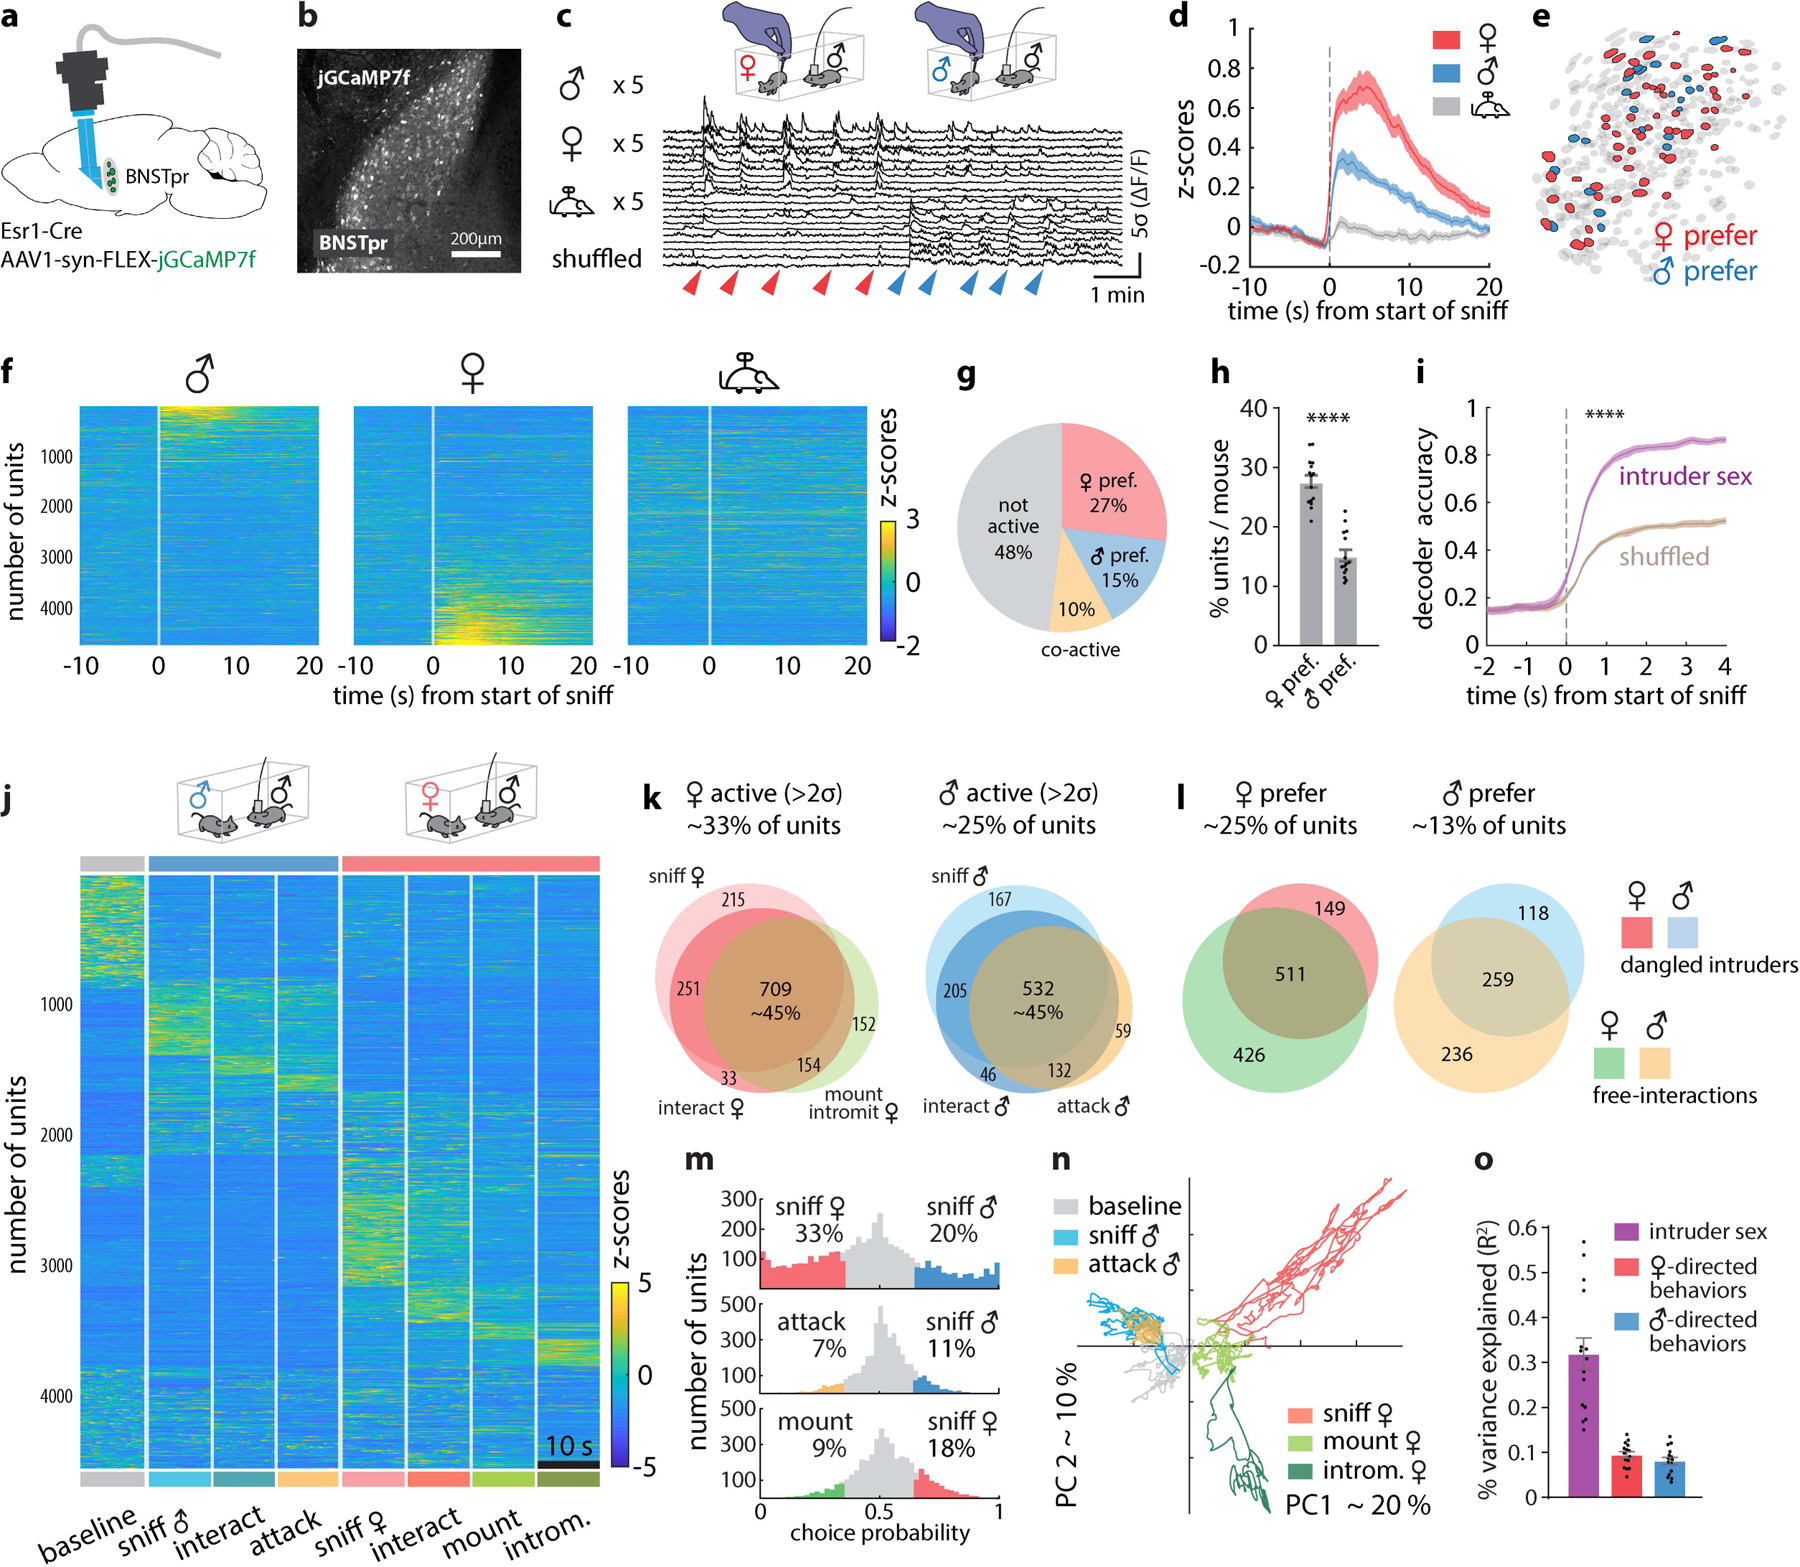
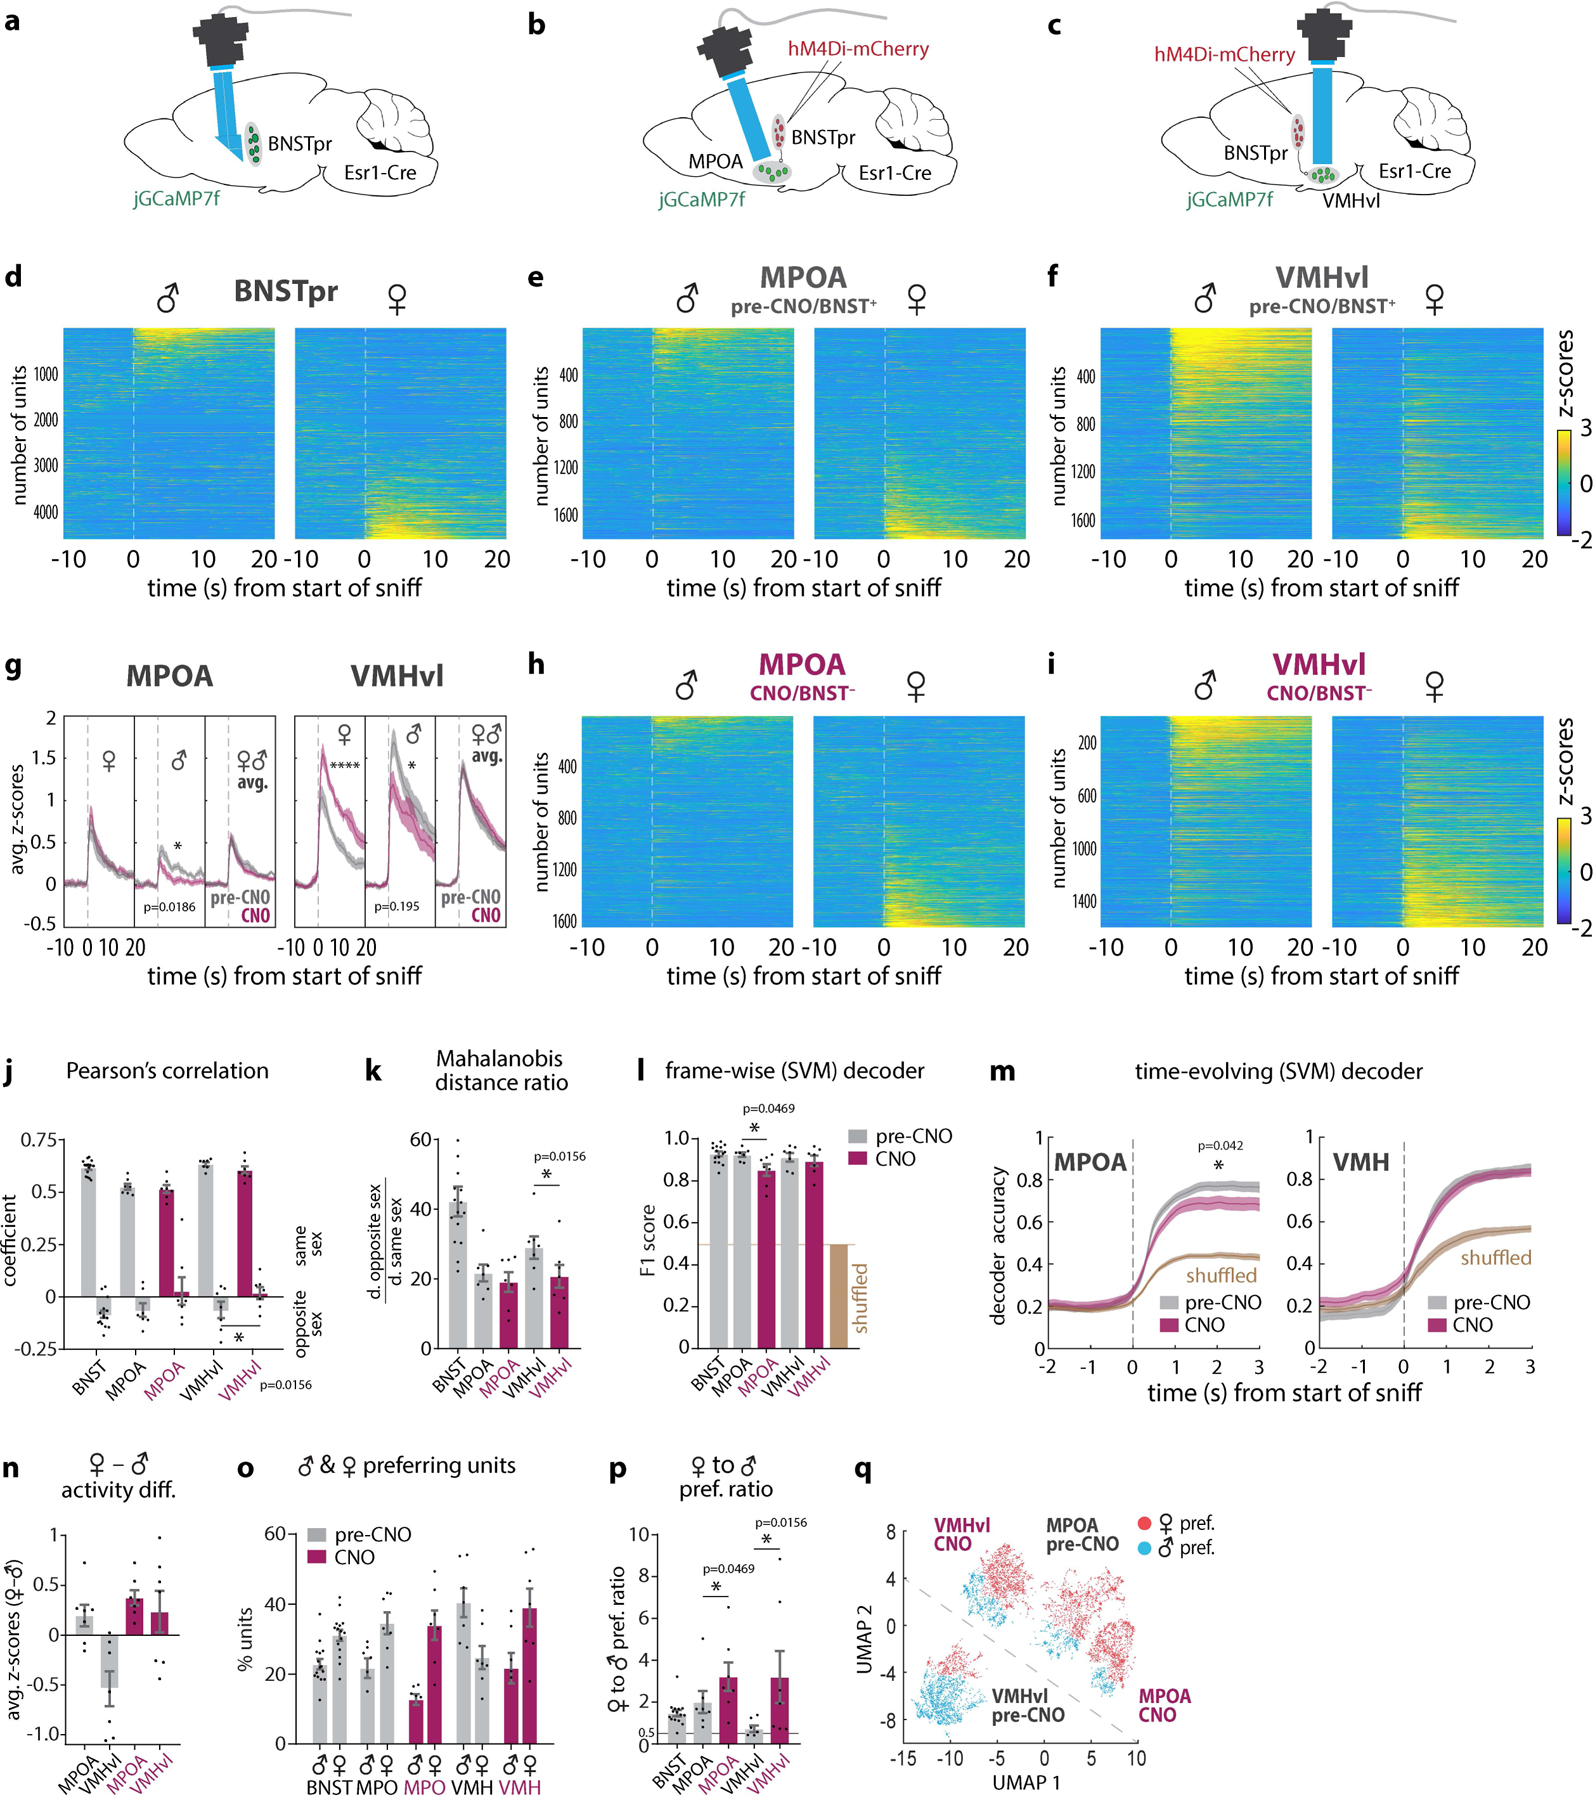
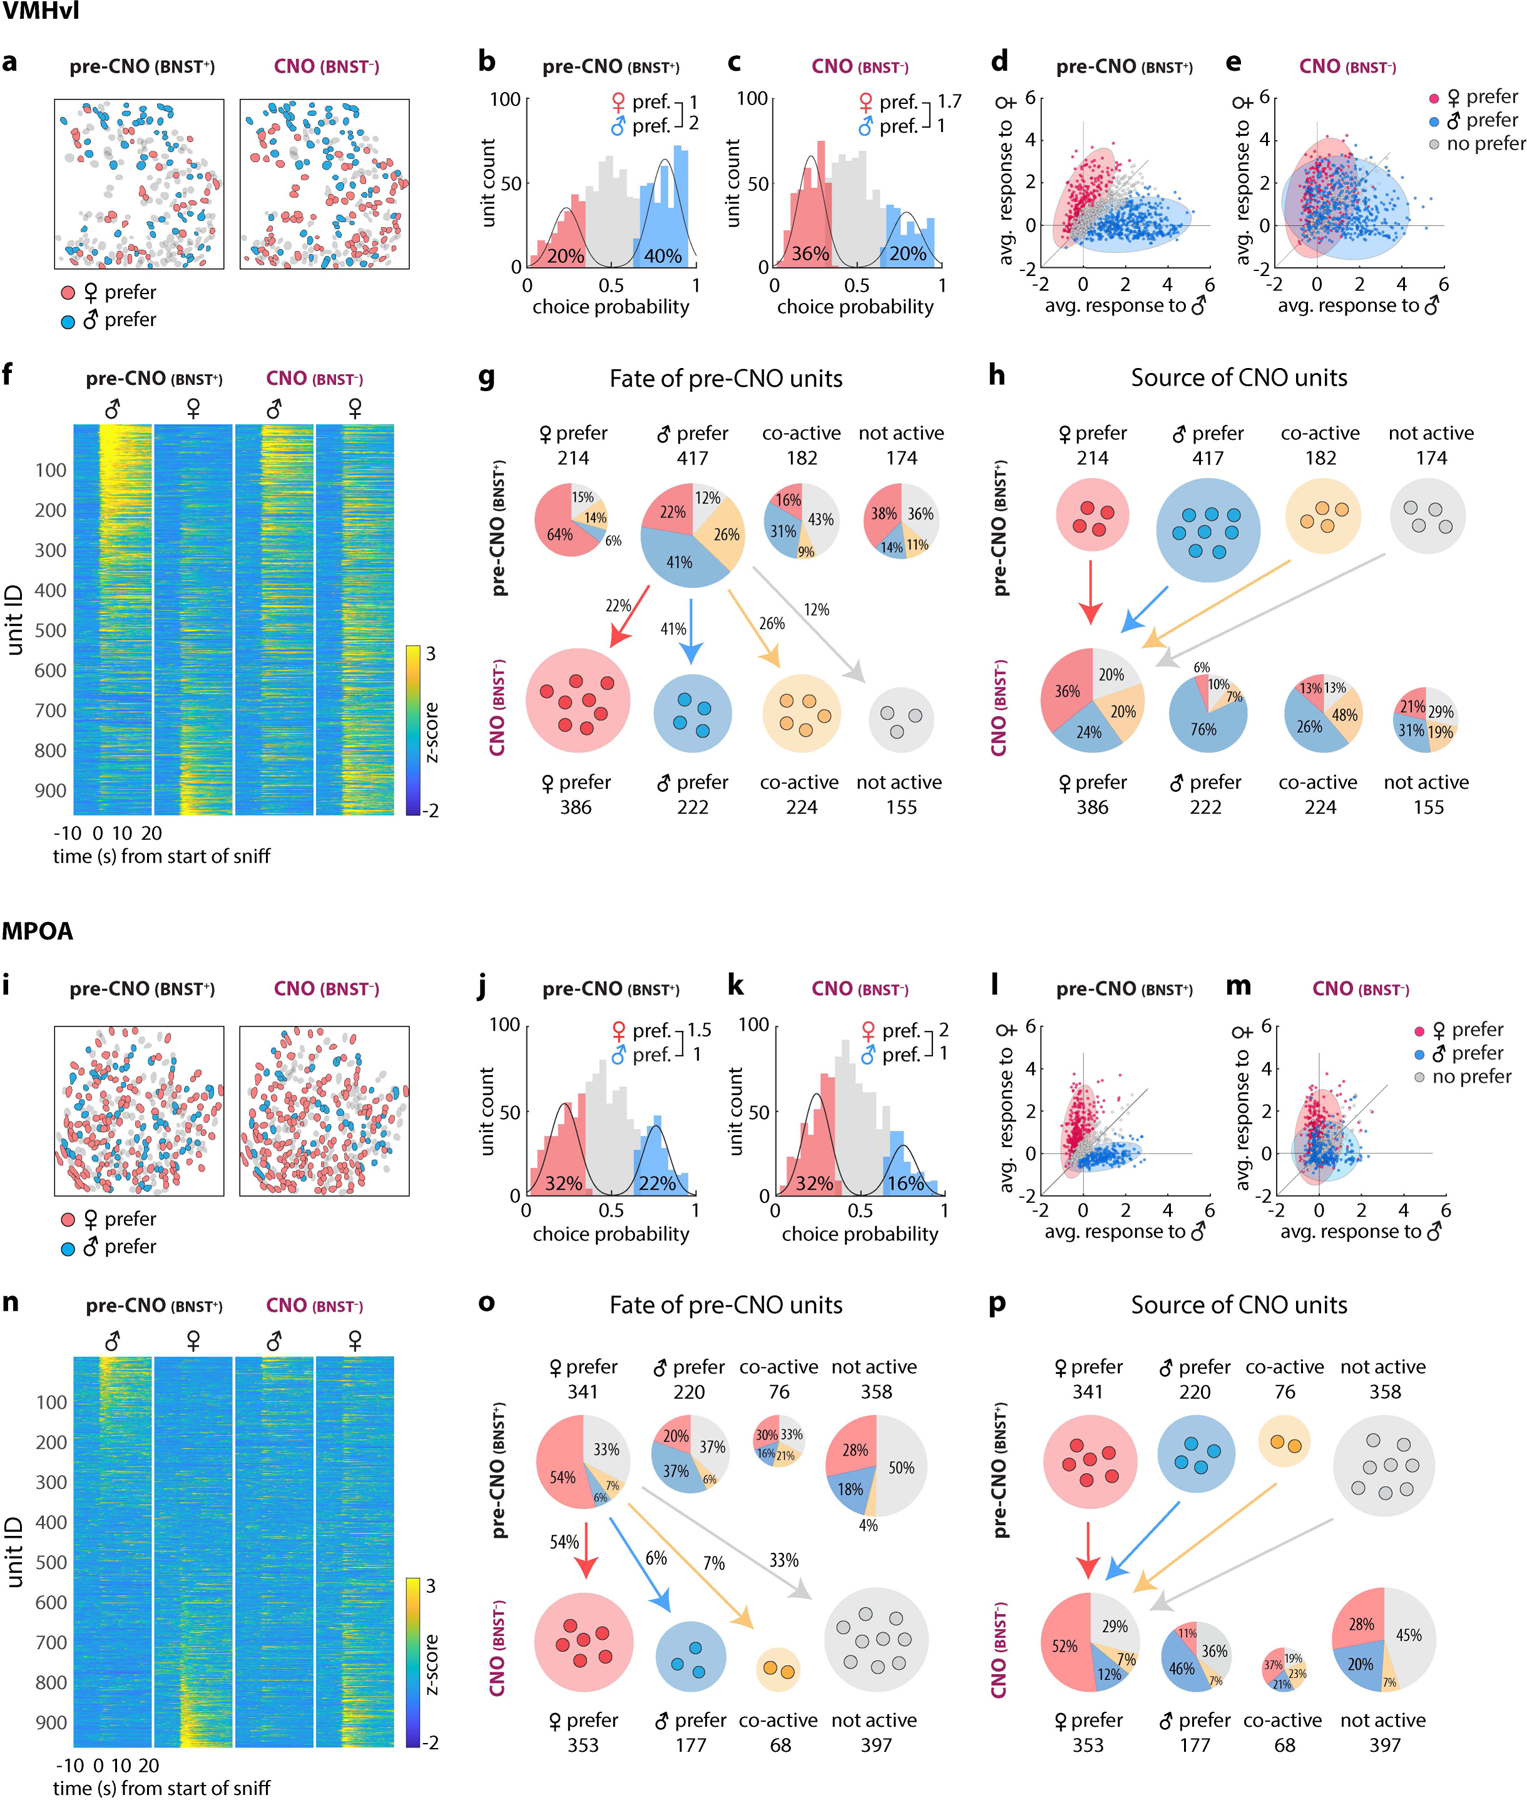
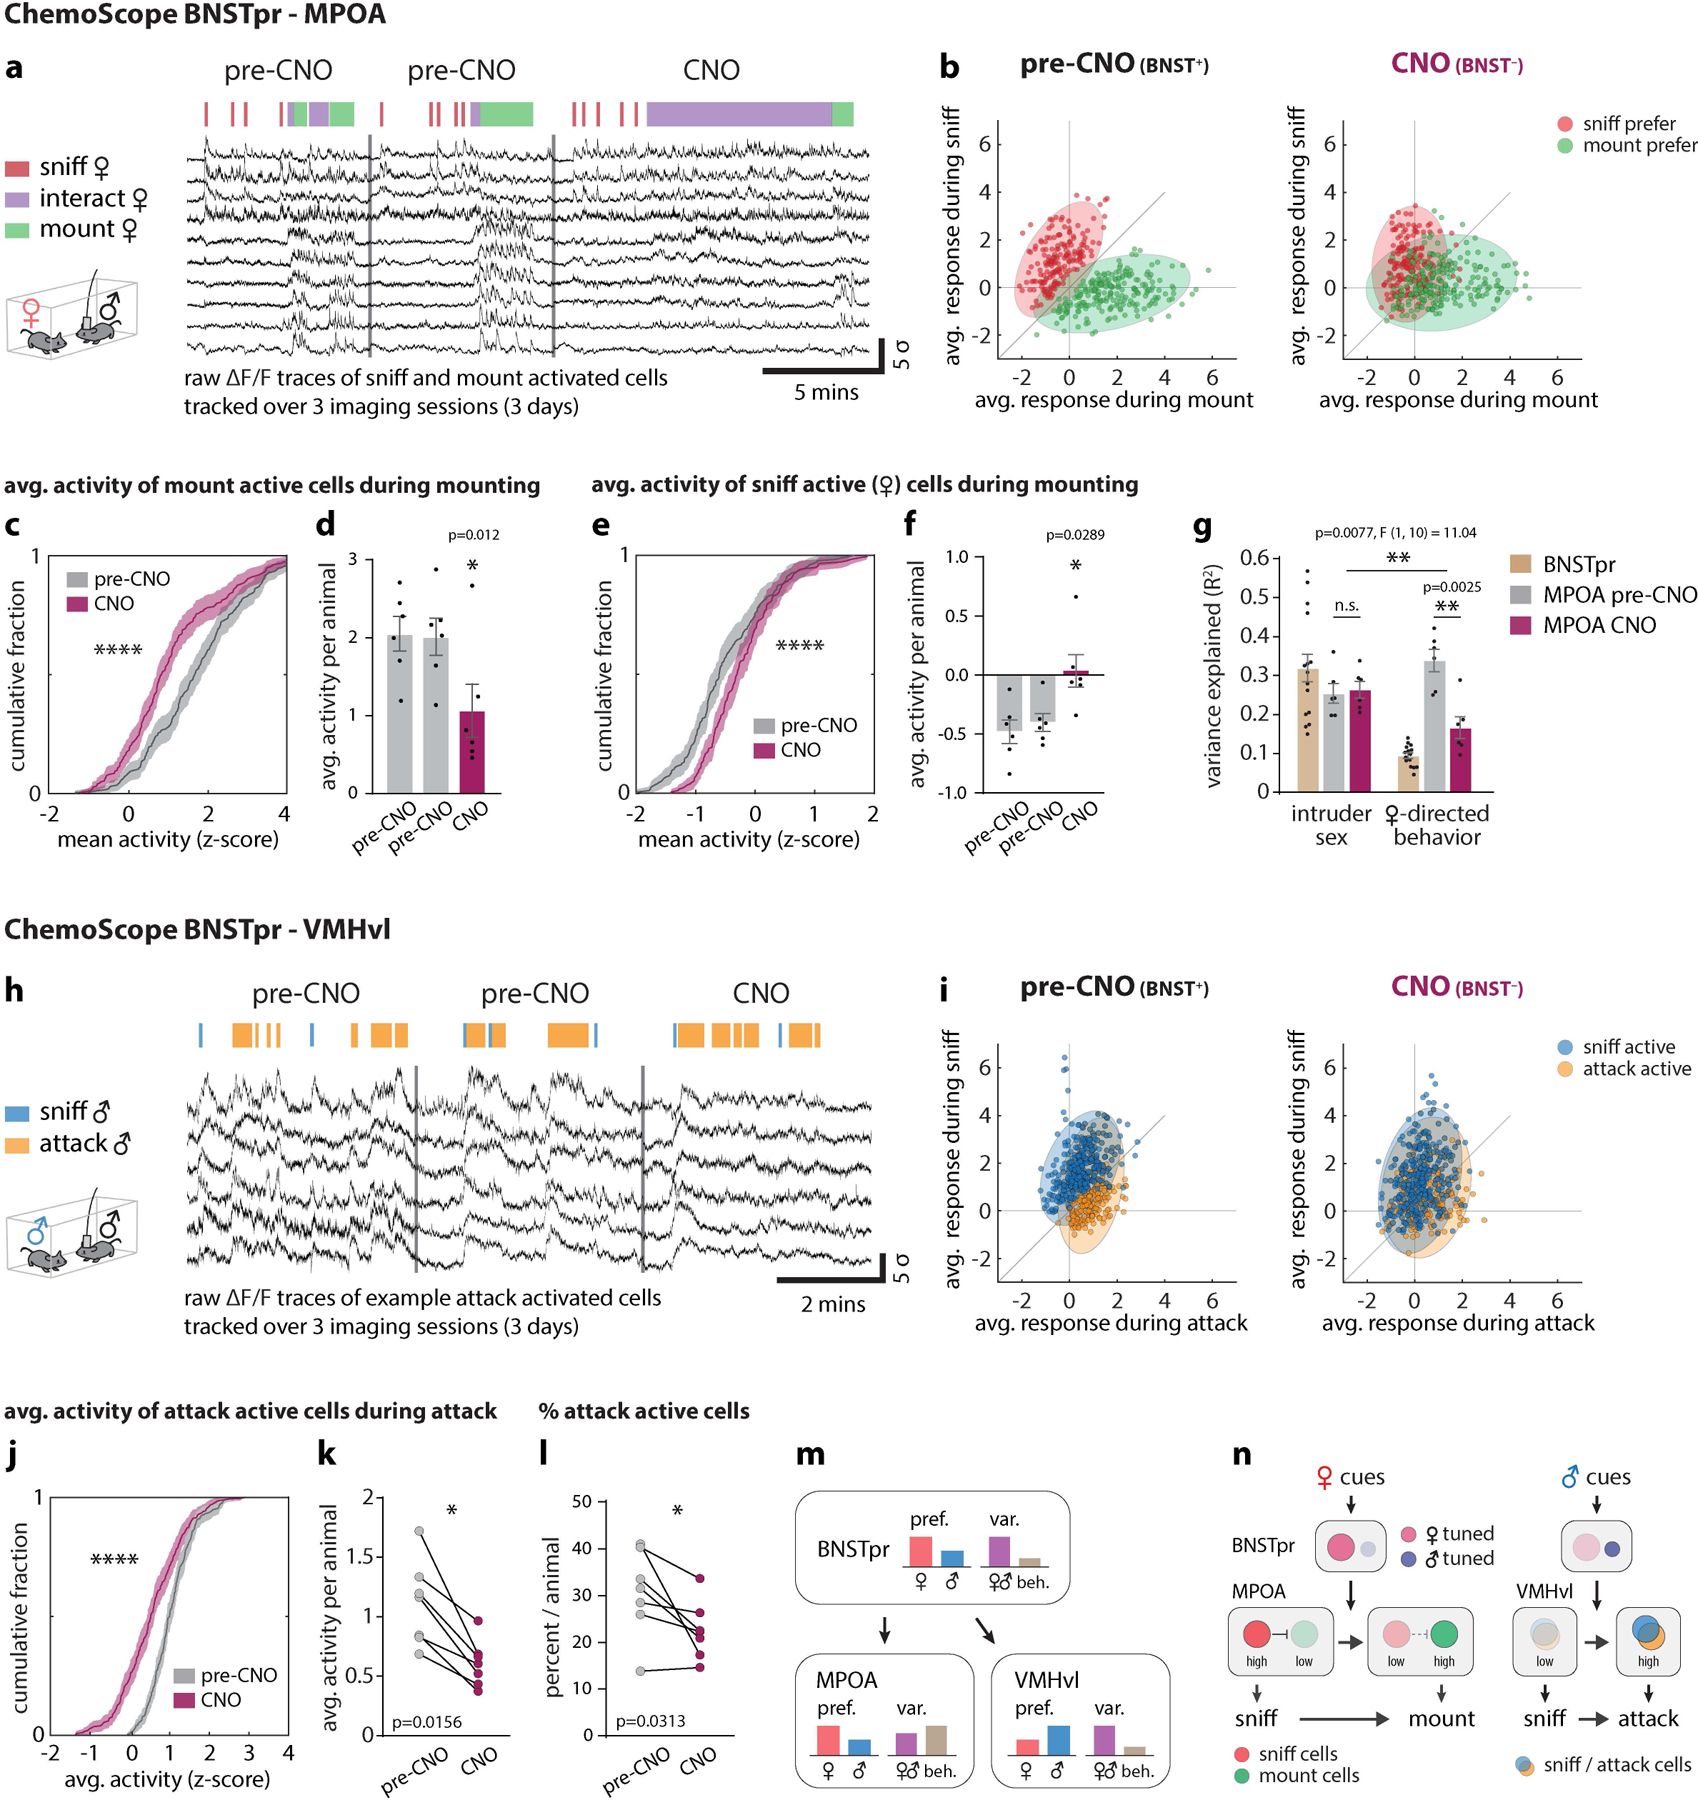
Mating and aggression are innate social behaviours that are controlled by subcortical circuits in the extended amygdala and hypothalamus1-4. The bed nucleus of the stria terminalis (BNSTpr) is a node that receives input encoding sex-specific olfactory cues from the medial amygdala5,6, and which in turn projects to hypothalamic nuclei that control mating7-9 (medial preoptic area (MPOA)) and aggression9-14 (ventromedial hypothalamus, ventrolateral subdivision (VMHvl)), respectively15. Previous studies have demonstrated that male aromatase-positive BNSTpr neurons are required for mounting and attack, and may identify conspecific sex according to their overall level of activity16. However, neural representations in BNSTpr, their function and their transformations in the hypothalamus have not been characterized. Here we performed calcium imaging17,18 of male BNSTprEsr1 neurons during social behaviours. We identify distinct populations of female- versus male-tuned neurons in BNSTpr, with the former outnumbering the latter by around two to one, similar to the medial amygdala and MPOA but opposite to VMHvl, in which male-tuned neurons predominate6,9,19. Chemogenetic silencing of BNSTprEsr1 neurons while imaging MPOAEsr1 or VMHvlEsr1 neurons in behaving animals showed, unexpectedly, that the male-dominant sex-tuning bias in VMHvl was inverted to female-dominant whereas a switch from sniff- to mount-selective neurons during mating was attenuated in MPOA. Our data also indicate that BNSTprEsr1 neurons are not essential for conspecific sex identification. Rather, they control the transition from appetitive to consummatory phases of male social behaviours by shaping sex- and behaviour-specific neural representations in the hypothalamus.


Conflict of interest statement

Competing interests

The authors declare no competing interests.

Figures

Extended Data Figure 1:
Extended Data Figure 1:. Chemogenetic and optogenetic silencing of BNSTprEsr1 neurons disrupts aggression and mating.
a, Illustration of hM4d (Gi)-mediated silencing in bilateral BNSTprEsr1 neurons. b, Example behavior raster plot from 1 animal across 4 recording sessions. c, Percent of BNSTprEsr1 neurons that express mCherry. Values are plotted as mean ± SEM, n=6 mice. d-m, Measurements performed before (pre-CNO: saline injection, gray points) vs. after (CNO injection, maroon points) chemogenetic silencing of BNSTpr, of time spent sniffing male intruders (d), number of attack bouts toward male intruders (e), time spent attacking male intruders (f), time spent sniffing female intruders (g), number of mount bouts toward female intruders (h), time spent mounting female intruders (i), time spent mounting male intruders (j), time spent attacking female (k), and time spent attacking male (l), time spent mounting female (m) in mCherry/CNO only controls (l, m) per 30-minute session. 100μl containing either saline (pre-CNO) or 7.5mg/kg CNO was given i.p. 60 minutes prior to start of behavior tests. n, Illustration of bilateral optogenetic silencing in BNSTpr. o, t, Mean probability of sniff behavior occurring relative to onset of optogenetic silencing. p, u, Duration of sniffing toward male (p) or female (u) intruders. q, v, Duration of attack (q) toward male intruders or mount (v) toward female intruders as a percentage of the duration of optogenetic silencing. “Sham” controls were the same animals during a 10s “sham stimulation,” i.e., without light. r, w, Percent of time spent interacting with male or female urine (r), or male or female conspecifics separated by a meshed barrier (w) before and during (r) or before, during and after (w) optogenetic silencing of BNSTpr. Optogenetic silencing conditions: 470nm @ ~1 mW/mm2 for 10 seconds (o, p, q, t, u, v). 470nm @ ~1 mW/mm2 for 10 minutes (r, s, w, x) Statistics: For Chemogenetic inhibition, two-sided Wilcoxon signed-rank test (d-m). Values are plotted as total time or total bouts per 30-minute session per animal. n = 7 mice (d-k), n=4 mice (l, m). For Optogenetic inhibition during interactions with male or female conspecifics (o, p, q, t, u, v), two-sided Kolmogorov-Smirnov test (o, t), two-sided Wilcoxon signed-rank test (p, q, u, v). Male-male trials (o, p, q), n=131 stim and 125 sham trials pooled from 10 mice. Male-female trials mice (t, u, v), n=181 stim and 170 sham trials pooled from 10 mice. For Optogenetic inhibition during urine preference (r) and “pencil cup” (mesh barrier) (w) tests, two-way ANOVA with Bonferroni correction, n=6 mice. Values are plotted as mean ± SEM. ****p < 0.0001; ***p < 0.001; **p < 0.01; *p < 0.05. The mouse brain in this figure (a, n) has been reproduced with permission from “The mouse brain in stereotaxic coordinate”, Paxinos G. and Watson C., copyright Elsevier Academic Press 2001.
Extended Data Figure 2:
Extended Data Figure 2:. Optogenetic silencing of BNSTprEsr1 terminals in MPOA or VMHvl during male-male/ male-female interactions.
a, c, Diagram illustrating BNST terminal silencing in MPOA (a) or VMHvl (c). b, d, Representative images showing Halo-EYFP cell body expression in BNSTpr and axonal expression in MPOA (b) and VMHvl (d). Similar expression patterns were observed in all 14 animals tested (b, d). e, h, k, n, Raster plots showing distribution of social behaviors relative to optogenetic silencing of BNSTpr terminal in MPOA (e, k) or VMHvl (h, n). f, i, l, o, Average probability of behavior occurring relative to onset of optogenetic silencing. g, j, m, p, Duration of attack (g, j) or mount (m, p) as a percentage of the 5-second optogenetic silencing. Statistics: two-sided Kolmogorov-Smirnov test (f, i, l, o), values are plotted as mean ± SEM. Two-sided Wilcoxon signed-rank test (g, j, m, p). ****p < 0.0001; ***p < 0.001; **p < 0.01; *p < 0.05. n=7 mice for each silenced region. The mouse brain in this figure (a, c) has been reproduced with permission from “The mouse brain in stereotaxic coordinate”, Paxinos G. and Watson C., copyright Elsevier Academic Press 2001.
Extended Data Figure 3:
Extended Data Figure 3:. Performance of 0.85 mm Ø prism coupled GRIN lens compared to 0.6 mm Ø GRIN lens for imaging BNSTpr.
a, b, d, e, Illustrations showing GRIN lens placement in BNSTpr from top (a, d) and side (b, e) views. a-c, Illustrations or data from animals implanted with prism lenses. d-f, Data from animals implanted with conventional cylindrical GRIN lenses. c, f, Mean pixel correlation during 1 example imaging session. g, Cumulative fraction of number of units captured per imaging session normalized to the diameter of the GRIN lens. h, Cumulative fraction of the peak to noise ratio (PNR) of all units imaged using either a 0.6mm grin lens or a 0.85mm prism-coupled grin lens. i, Raster plots of MeApd, BNSTpr, MPOA and VMHvl Esr1+ neuronal activity during male-male or male-female unrestrained social interactions. For comparative purposes, all frames containing each behavior scored (indicated below plot) during a 30 minute social interaction were concatenated and binned into 10s intervals; Averaged z-scored responses of each unit across all bins are shown. Tables below show the average variance (R2) in population activity that can be explained by intruder sex or by male and female-directed consummatory behavior and the ratio of female-preferring to male-preferring neurons in each imaged region. The mouse brain in this figure (i) has been reproduced with permission from “The mouse brain in stereotaxic coordinate”, Paxinos G. and Watson C., copyright Elsevier Academic Press 2001.
Extended Data Figure 4:
Extended Data Figure 4:. Miniscope imaging analysis of BNSTpr neurons.
a, Example raster plot of population responses to 5 repeated presentations of dangled male, female or toy intruders from a cohort of 9 individual animals (cohort 1, n = 6, cohort 2, n = 9). b, continuously recorded raw ΔF/F traces of 20 example neurons from 1 recording session. c, Average z-scored responses of BNSTpr neurons per animal (n=15 mice) during 8 annotated behaviors/conditions. d, Percent of units per animal (n=15 mice) whose average response is >2σ baseline measured prior to intruder introduction. e, Histograms of male- / female-preferring units determined by choice probability from single-unit responses to dangled intruders. f, Venn diagram of units that are male- or female- sniff preferring (top), or attack- or mount- preferring (bottom) (determined by choice probability) during free interactions with, or sniffing of dangled, male or female intruders. g-l, Comparison of BNSTprEsr1 (g, h, i) and BNSTprAB (j, k, l) population responses to dangled presentation of male or female intruders. g, j, Illustration of BNSTprEsr1 (g) and BNSTprAB (j) miniscope imaging using a conventional 0.6mm GRIN lens. h, k, Average z-scores of single-unit responses relative to the start of sniff during 5 repeated dangling presentations of male or female intruders. i, l, percent of male vs female preferring units in BNSTpr. n=15 mice. The mouse brain in this figure (g, j) has been reproduced with permission from “The mouse brain in stereotaxic coordinate”, Paxinos G. and Watson C., copyright Elsevier Academic Press 2001.
Extended Data Figure 5:
Extended Data Figure 5:. ChemoScope imaging of MPOA and VMHvl across multiple days.
a, f, k, Diagram showing the position of 0.6mm GRIN lens in relation to MPOA, BNSTpr and VMHvl. b-e, Sagittal histology sections showing the expression of jGCaMP7f in MPOA (b, c), hM4Di-mCherry in BNSTpr (b, e), and lack of cell body expression of hM4Di-mCherry in MPOA (d). g-j, Coronal histology sections showing the expression of jGCaMP7f in MPOA (g, h), hM4Di-mCherry in BNSTpr (g, j), and lack of cell body expression of hM4Di-mCherry in MPOA (i). l-o Coronal histology sections showing the expression of jGCaMP7f VMHvl (l, m), hM4Di-mCherry in BNSTpr (o), and lack of cell body expression of hM4Di-mCherry in VMHvl (n). Similar expression patterns were observed in 14 mice tested (7 mice for each imaged region). p, r example raster plots of average single-unit responses to 5 trials of dangled male or female intruders in MPOA (p) and VMHvl (r) across multiple imaging sessions (sessions are 2–3 days apart). Units are sorted based on their eigenvalues in the first principal component of the population activity vector. q, s percent of units that are male or female preferring across 2 days of imaging in MPOA (q) and VMHvl (s), in saline-injected animals. n=7 mice from each imaged region.
Extended Data Figure 6:
Extended Data Figure 6:. ChemoScope imaging of MPOA and VMHvl
a-p, Cumulative fractions showing average single unit responses to dangled male and female intruders from initially (i.e., in saline-injected animals) male preferring (a-d), female preferring (e-h), co-active (i-l) and not active (m-p) units in MPOA (a, b, e, f, i, j, m, n) and VMHvl (c, d, g, h, k, l, o, p). q average responses to dangled male or female intruders in MPOA (left panel) and VMHvl (right panel). r-t, mean response difference between dangled female and male intruders (r), percentage of male vs female preferring units (s) and the ratio of female- to male-preferring units (t) before and after the application of CNO, in MPOA or VMHvl. Statistics: two-sided Kolmogorov-Smirnov test (a-q), values are plotted as mean ± SEM. Two-sided Wilcoxon signed-rank test (r-t). ****p < 0.0001; ***p < 0.001; **p < 0.01; *p < 0.05. n=7 mice from each imaged region.
Extended Data Figure 7:
Extended Data Figure 7:. Tracking changes to MPOA and VMHvl single-unit responses before and after silencing BNSTpr.
a, b, Spatial maps showing distribution of male- or female preferring units before (gray) and after (maroon) chemogenetic silencing of BNSTpr in MPOA(a) or VMHvl (b). c, d, response profiles of initially (i.e., in saline-injected animals/pre-CNO) male- or female preferring units after BNSTpr silencing, in MPOA (c) and VMHvl (d). (e-s) 2d scatter plots and bar plots showing average single-unit responses to dangled male and female intruders from tracked units in MPOA and VMHvl, sorted as indicated.
Extended Data Figure 8:
Extended Data Figure 8:. Effect of BNSTpr silencing on VMHvl behavior representations and female / male preference
a, Raster plot of all recorded units from 1 example animal over 3 imaging sessions. Units are sorted separately for each recorded session based on their responses during male and female interactions. b, c, e-h, Cumulative fractions (b, e, g) and bar graphs (c, f, h) of VMHvl single-unit responses to initially (i.e., in saline-injected animals/pre-CNO) sniff active (b, c) or attack active (e-h) cells during attack before CNO (i.e., saline-injected/pre-CNO) (e, f), or before and after CNO (b, c, g, h). g, h, mCherry/CNO only controls. d, percent sniff active cells in VMHvl before (i.e., saline-injected/pre-CNO) and after CNO. Statistics: two-sided Kolmogorov-Smirnov test (b, e, g), values are plotted as mean ± SEM, two-sided Wilcoxon signed-rank test (c, d f, h). ****p < 0.0001; ***p < 0.001; **p < 0.01; *p < 0.05. n=7 mice.
Extended Data Figure 9:
Extended Data Figure 9:. Retrograde tracing and imaging of BNSTpr projection neurons
a, d, Diagram showing retrograde tracing of BNSTpr projection neurons. b, e, Example images showing MPOA or VMHvl projecting neurons expressing mScarlet or mNeongreen. c, Average number of back-labeled BNSTpr neurons per animal. n=7 mice. f, Percent of VGAT+ projection neurons that are Esr1+. n=3 mice per injected region. Values are plotted as mean ± SEM (c, f). g, j, Diagram showing miniscope imaging of VMHvl-projecting (n=2 mice) or MPOA-projecting (n=2 mice) BNSTpr neurons. h, k, Average z-scores of single-unit responses relative to the start of sniff during 5 repeated dangling presentations of male or female intruders (n=2 mice per injected region). i, l, Percent of male- or female-preferring units (n=2 mice per injected region). The mouse brain in this figure (a, b, g, j) has been reproduced with permission from “The mouse brain in stereotaxic coordinate”, Paxinos G. and Watson C., copyright Elsevier Academic Press 2001.
Figure 1:
Figure 1:. BNSTprEsr1 neurons are necessary for the transition from appetitive to consummatory social behaviors in sexually experienced male mice.
a, Schematic of circuit under study. Solid bars, inhibitory connections; Small arrows, excitatory connections. b, Illustration of bilateral optogenetic silencing in BNSTpr. c, Representative image showing stGtACR2 expression in BNSTpr. Similar expression patterns were observed in all animals tested (n = 10). d, Whole cell voltage clamp showing light mediated silencing of BNSTprEsr1 neurons in an acute slice preparation. e, j, Raster plots showing distribution of social behaviors relative to optogenetic silencing. f, h, k, m, Mean probability of behavior occurring relative to onset of optogenetic silencing. g, l, percent of trials that transitioned to attack (g) or mount (l). i, n, Duration of attack (i) or mount (n) as a percentage of the 10s optogenetic silencing interval. Statistics: two-sided Wilcoxon signed-rank test (g, i, l, n), two-sided Kolmogorov-Smirnov test (f, h, k, m). Values are plotted as mean ± SEM. ****p < 0.0001; ***p < 0.001; **p < 0.01; *p < 0.05. Male-male trials: n=131 stim and 125 sham trials pooled from 10 mice. Male-female trials: n=181 stim and 170 sham trials pooled from 10 mice. The mouse brain in this figure (b) has been reproduced with permission from “The mouse brain in stereotaxic coordinate”, Paxinos G. and Watson C., copyright Elsevier Academic Press 2001.
Figure 2:
Figure 2:. BNSTprEsr1 neurons represent intruder sex via a cell-identity code.
a, Illustration of BNSTpr miniscope imaging using a prism-coupled GRIN lens. b, Representative image showing jGCaMP7f expression in BNSTpr. Similar expression patterns were observed in 20 mice. c, Imaging experiment paradigm and responses of 20 example neurons during dangled presentation of conspecifics. d, Mean responses of BNSTprEsr1 neurons during 5 stimulus presentations. e, Spatial map of female- and male-preferring units from 1 representative mouse. f, Single-unit responses during 5 repeated dangling presentations of male, female or toy mice. g, Mean percentages of male- or female-preferring or co-active units (calculated by choice probability; see Methods). h, Percentage of male- or female-preferring units per imaged animal. i, Performance of time-evolving SVM decoders (Methods) of intruder sex. j, Raster plot of BNSTpr neuronal activity during male-male or male-female unrestrained social interactions. For comparative purposes, all frames containing each behavior scored during a 30-minute social interaction were concatenated and binned into 10s intervals; Average responses of each unit across all bins are shown. k, Venn diagram of units that are >2σ over pre-intruder baseline during male-male / male-female interactions. Color code as in (j). l, Venn diagram of units that are male- or female- preferring (determined by choice probability) during dangled presentations of, or free interactions with, intruders. Color scheme to right. m, Choice probability histograms and percentages of tuned units. n, Population activity vectors in the first two principal components space during male- and female-directed behaviors, from 1 example mouse. o, Variance (R2) in population activity that can be explained by conspecific’s sex or by male- or female-directed consummatory behavior. Statistics: two-sided Wilcoxon signed-rank test (h). two-sided Kolmogorov-Smirnov test (i). Values are plotted as mean ± SEM. ****p < 0.0001. n=15 mice. The mouse brain in this figure (a) has been reproduced with permission from “The mouse brain in stereotaxic coordinate”, Paxinos G. and Watson C., copyright Elsevier Academic Press 2001.
Figure 3:
Figure 3:. BNSTpr is required for male-biased intruder sex representations in VMHvl.
a, Illustration of BNSTpr miniscope imaging. b, c, Illustration of ChemoScope imaging in MPOA (b) and VMHvl (c) while silencing BNSTpr. d, e, f, h, i Average single-unit responses imaged during 5 repeated dangling presentations of male or female mice in BNSTpr (d), pre-CNO MPOA (e), and pre-CNO VMHvl (f), or CNO-treated (7.5mg/kg CNO i.p.) MPOA (h), and VMHvl (i), “Pre-CNO” animals received an equivalent volume of saline i.p. CNO controls shown in ED Fig. 1l, m. g, Average bulk (down-sampled) calcium responses to dangled female or male stimuli, or combined male and female responses, before (i.e., saline-injected) vs. after the application of CNO, in MPOA (left panel) or VMHvl (right panel). j, Average Pearson’s correlation coefficient and k, average Mahalanobis distance ratio between population responses to dangled mice of the same or opposite sex in BNSTpr, MPOA and VMHvl, ±CNO. l, m Performance of frame-wise (l) or time-evolving (m) decoders. n, Average difference between responses to female or male stimuli in MPOA and VMHvl. o, Average percentage of male- vs female-preferring units. p, Ratio of female to male-preferring units. q, supervised UMAP embedding of population responses to male and female stimuli across MPOA and VMHvl (see Methods). Statistics: two-sided Kolmogorov-Smirnov test (g, m). two-sided Wilcoxon signed-rank test (j, k, l, p). Values are plotted as mean ± SEM. ****p < 0.0001; ***p < 0.001; **p < 0.01; *p < 0.05. n=7 mice per imaged region. The mouse brain in this figure (a-c) has been reproduced with permission from “The mouse brain in stereotaxic coordinate”, Paxinos G. and Watson C., copyright Elsevier Academic Press 2001.
Figure 4:
Figure 4:. Differential effect of BNSTpr silencing on sex representations in VMHvl and MPOA revealed by sequential imaging of identified units
a, i, Spatial maps of tracked male and female-preferring units in VMHvl (a) and MPOA (i) before and after CNO application. f, n, Single-unit responses to dangled male or female stimuli in VMHvl (f) or MPOA (n) before vs. after CNO application. Sorting of units is the same pre- vs. post-CNO b, c, j, k, Histograms of male- vs. female-tuned units determined by choice probability from single-unit responses to dangled intruders. d, e, l, m, Scatter plots of single-unit responses to dangled male and female mice before and after CNO application in VMHvl (d, e) or MPOA (l, m). Each dot (d, e, l, m) represents a single neuron and the color of each dot indicate its male / female preference before CNO application. Distribution of male- or female-preferring units before (d, l) and after (e, m) CNO are shown as colored ellipses. g, h, o, p, Pie charts showing fates (g, o) and sources (h, p) of units in VMHvl (g, h) or MPOA (o, p) before vs. after CNO treatment, respectively. The percentage of units of each type that retained or switched sex-preference, responded to both sexes (“co-active”) or responded to neither sex (“not active”) is indicated.
Figure 5:
Figure 5:. Differential effect of BNSTpr silencing on behavior representations in MPOA and VMHvl revealed by unilateral ChemoScope imaging.
a, h, responses from example neurons tracked over 3 imaging sessions in MPOA (a) and VMHvl (h). b, i, Scatter plot of single-unit responses to sniff and mount females in MPOA (b), or to sniff and attack males in VMHvl (i). Each dot (b, i) represents a single neuron and the color of each dot indicates its tuning before CNO application. Distribution of sniff vs mount MPOA units (b) or sniff vs attack VMHvl units (i) before and after CNO are shown as colored ellipses. c-f Cumulative fractions (c, e) and bar graphs (d, f) of MPOA single-unit responses to initially (i.e., in saline-injected animals/pre-CNO) mount active (c) or sniff active (e) cells during mounting. g, Variance (R2) in population activity that can be explained by intruder sex or by female-directed consummatory behavior. j, k, Cumulative fractions (j) and scatter plots (k) of VMHvl single-unit responses to initially attack-active cells during attack. l, percent of attack-active cells per animal. m, Diagram summarizing observed transformations of sex and behavior representations from BNSTpr to MPOA and VMHvl. “pref.,” fraction of units that are either female (red bars)- or male (blue bars)-preferring neurons. “var expl.,” fraction of variance explained (R2) by intruder sex (purple bars) or consummatory behavior (light brown bars). n, Schematic illustrating the role of BNSTprEsr1 neurons in controlling the transition from sniffing to mounting or attack. Pale circles, low activity; saturated circles; high activity. Vertical arrows indicate net functional influences and requirements for BNSTpr activity. Horizontal arrows indicate time-dependent transitions. Statistics: two-sided Kolmogorov-Smirnov test (c, e, j), two-sided Wilcoxon signed-rank test (k, l), Friedman test with Dunn’s correction (d, f), two-way ANOVA with Bonferroni correction (g). ****p < 0.0001. Values are plotted as mean ± SEM. For ChemoScope BNSTpr – MPOA, n=6 mice (d, f, g); For ChemoScope BNSTpr – VMHvl, n=7 mice (k, l).

Comment in

Similar articles

Cited by

References

    1. Yang CF & Shah NM Representing Sex in the Brain, One Module at a Time. Neuron 82, 261–278 (2014). - PMC - PubMed
    1. Anderson DJ Circuit modules linking internal states and social behaviour in flies and mice. Nat. Rev. Neurosci 17, 692–704 (2016). - PubMed
    1. Hashikawa K, Hashikawa Y, Falkner A & Lin D The neural circuits of mating and fighting in male mice. Curr. Opin. Neurobiol 38, 27–37 (2016). - PMC - PubMed
    1. Chen P & Hong W Neural Circuit Mechanisms of Social Behavior. Neuron 98, 16–30 (2018). - PMC - PubMed
    1. Bergan JF, Ben-Shaul Y & Dulac C Sex-specific processing of social cues in the medial amygdala. eLife 3, e02743 (2014). - PMC - PubMed