. 2022 Aug;608(7922):405-412.
doi: 10.1038/s41586-022-05016-1. Epub 2022 Aug 3.

Cellular recovery after prolonged warm ischaemia of the whole body

Affiliations

Cellular recovery after prolonged warm ischaemia of the whole body

David Andrijevic et al. Nature. 2022 Aug.

Abstract

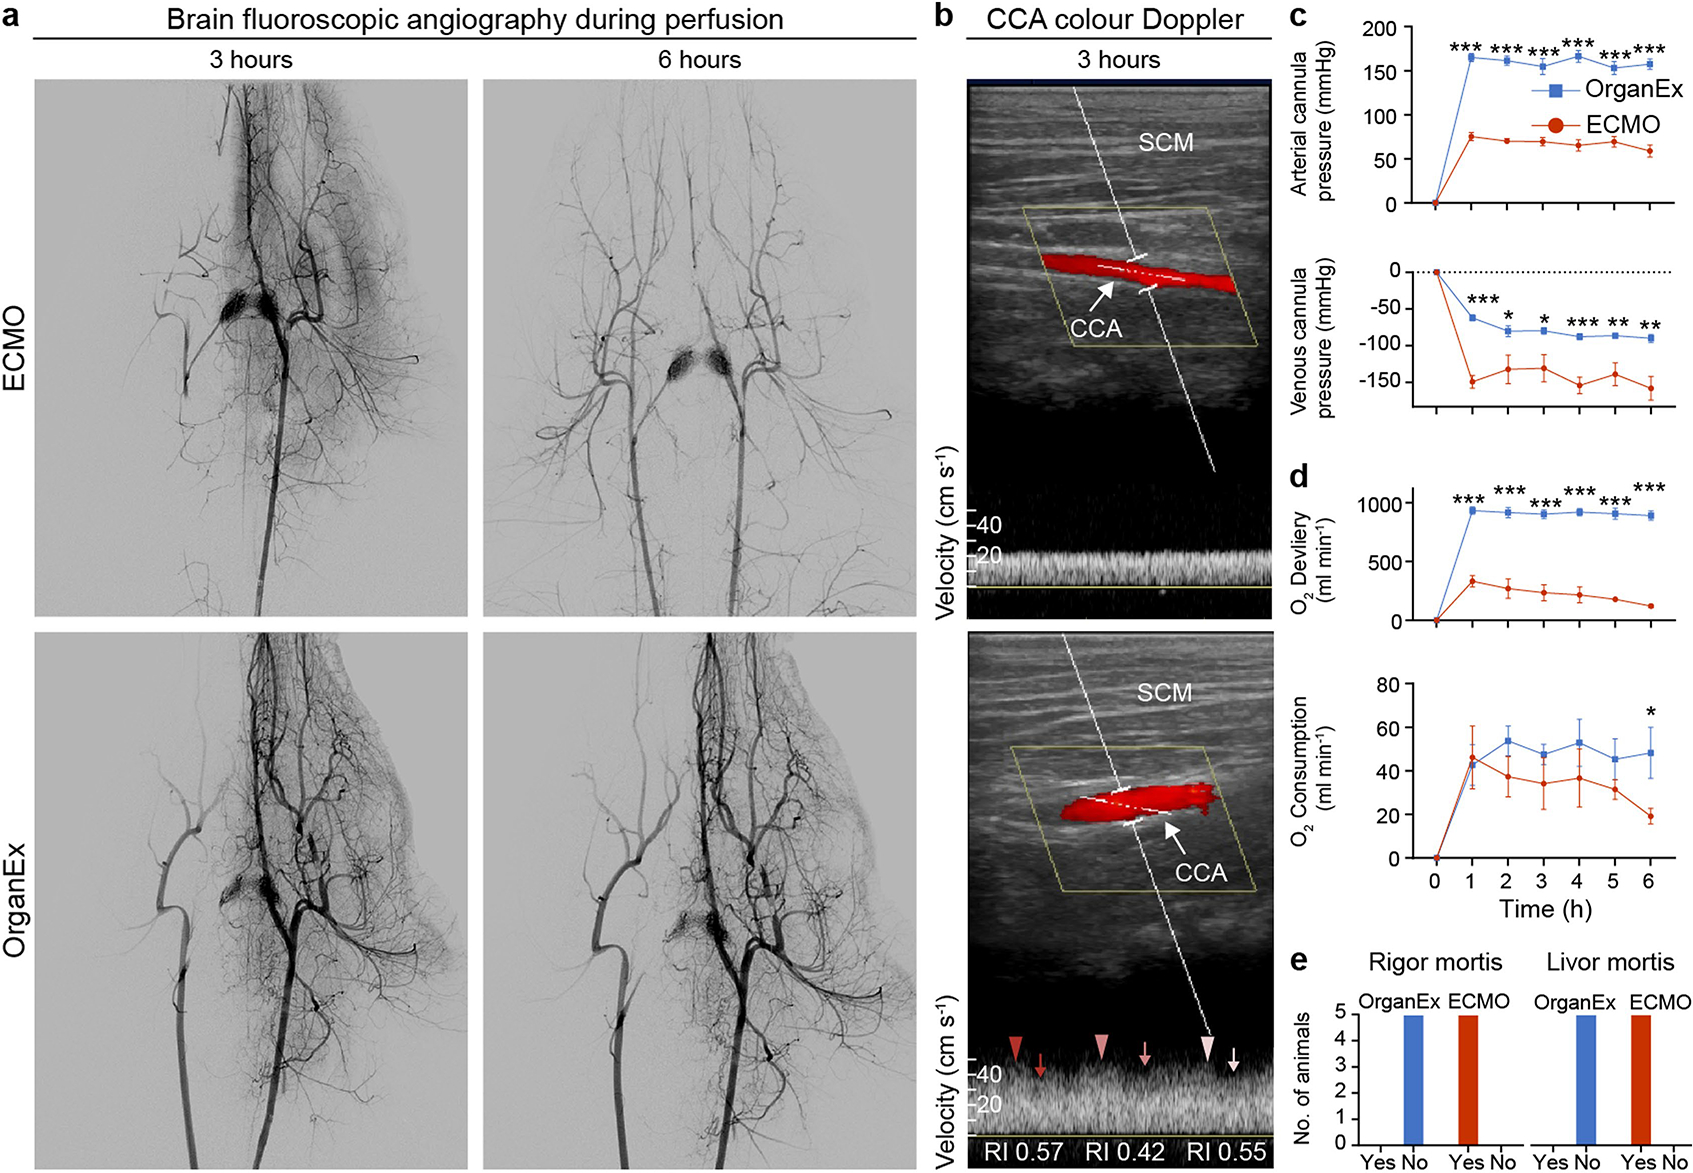
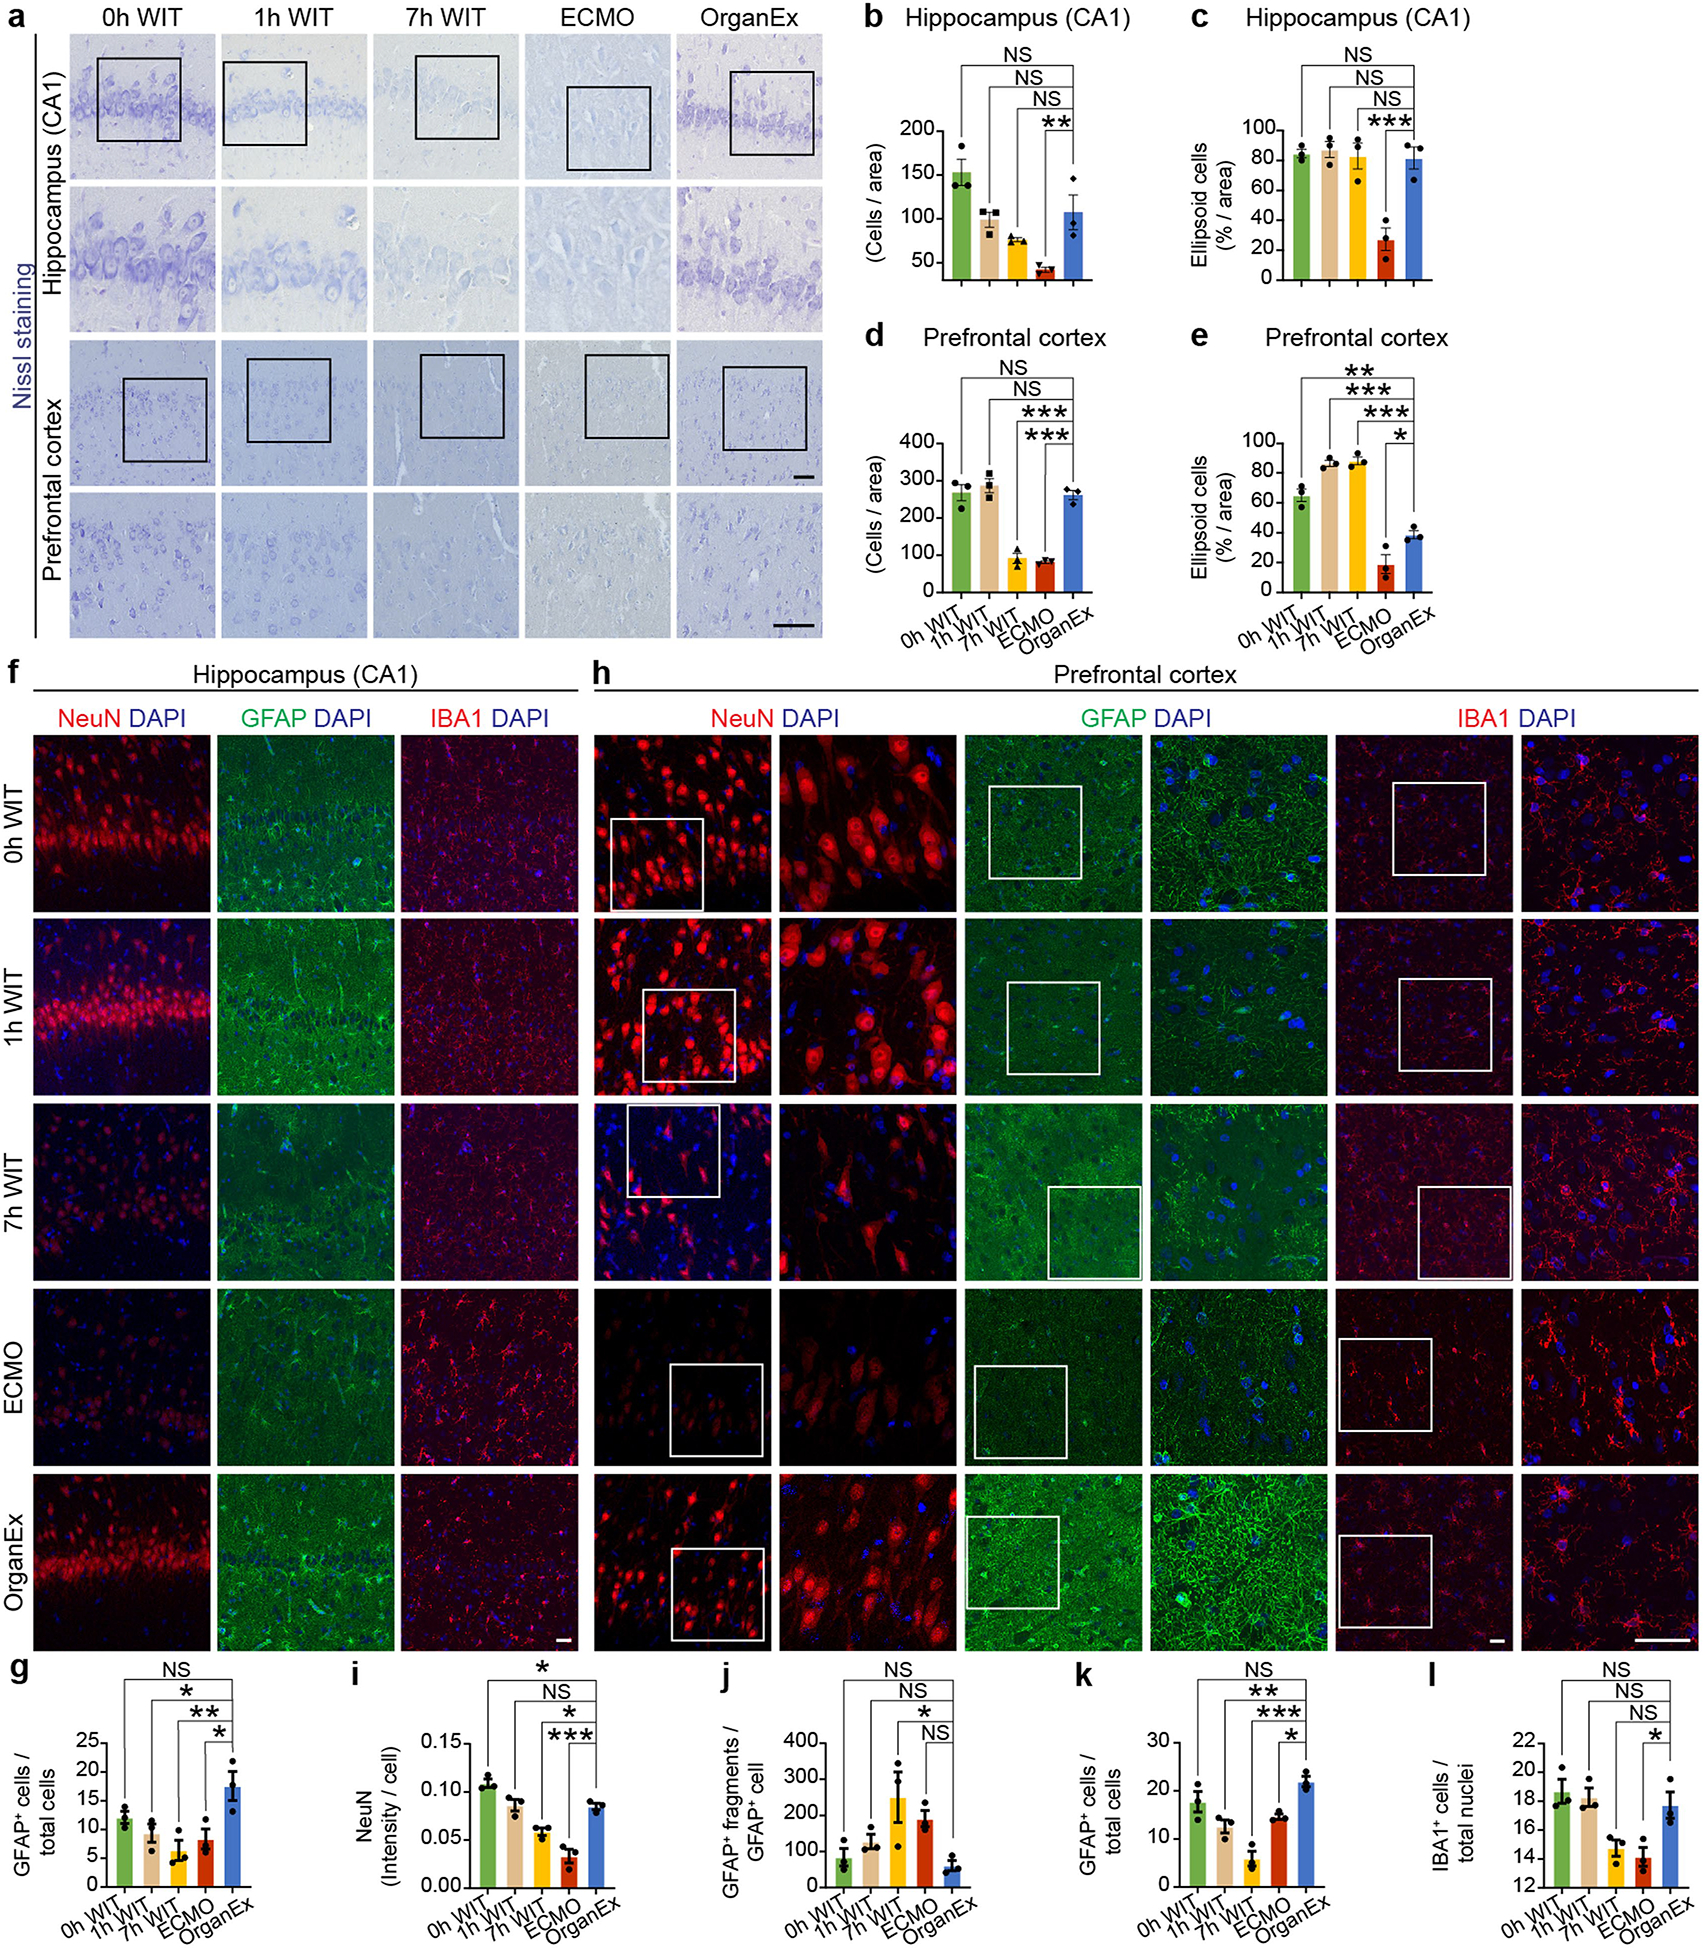
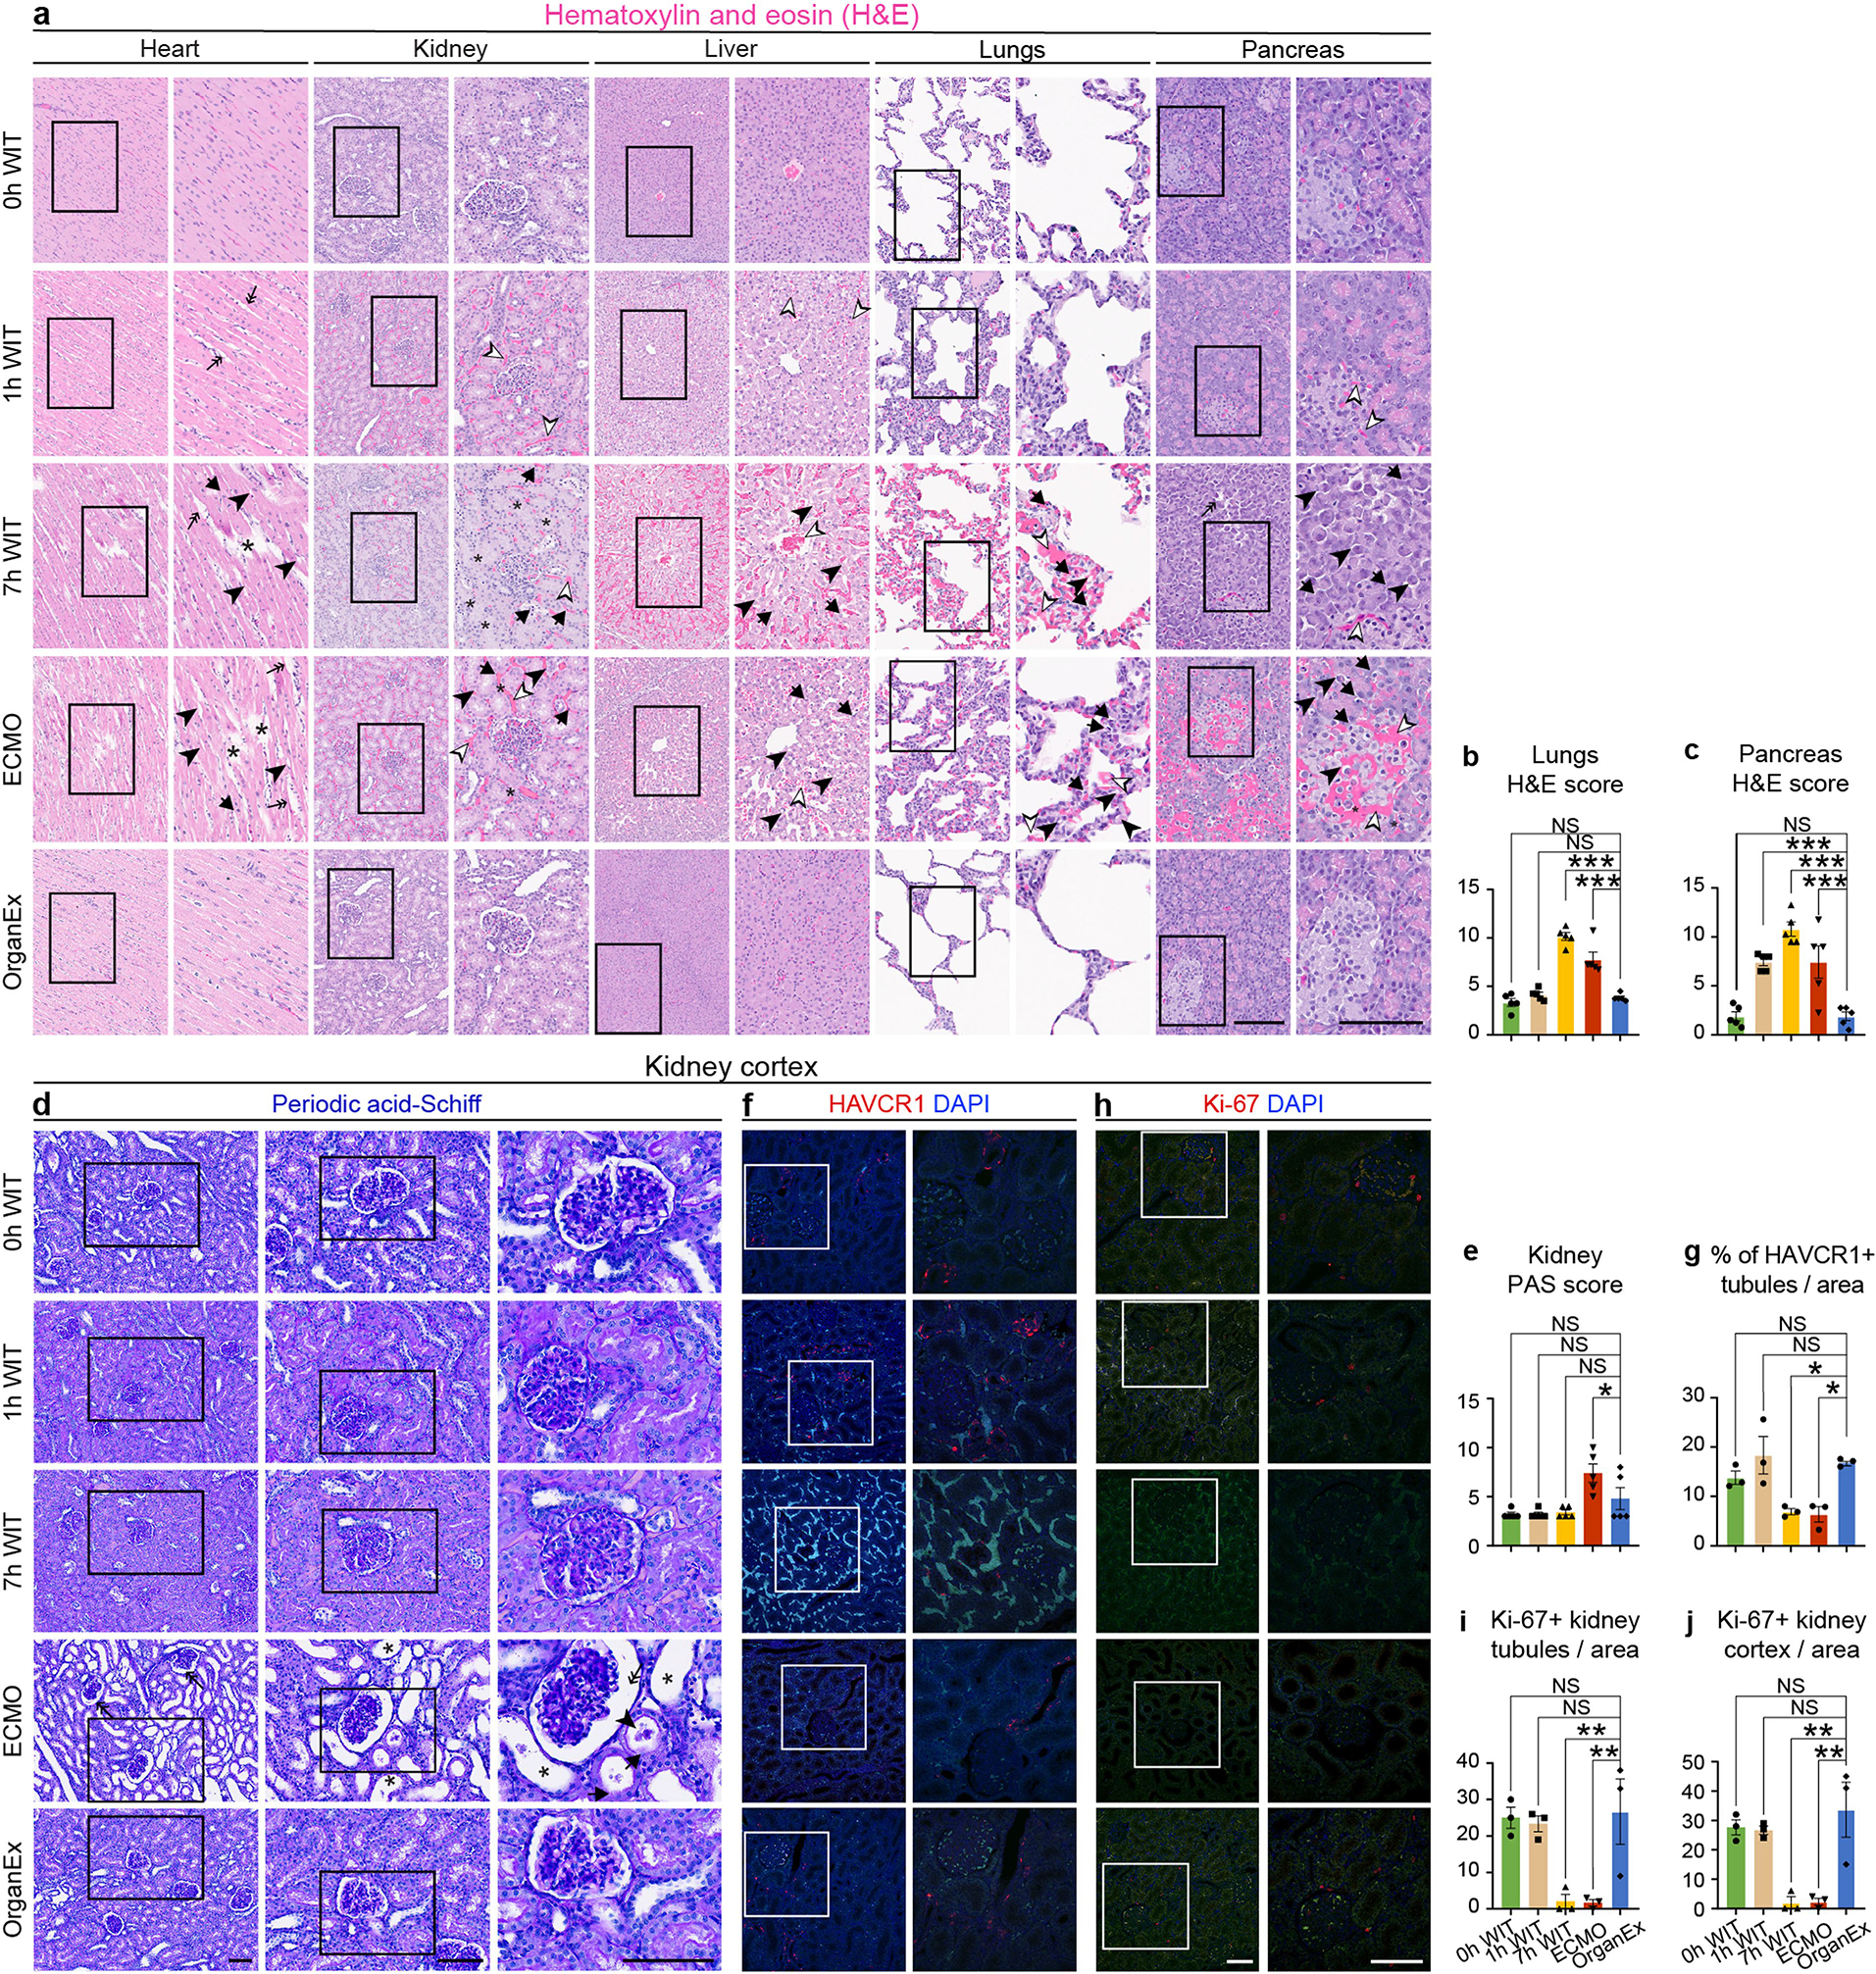
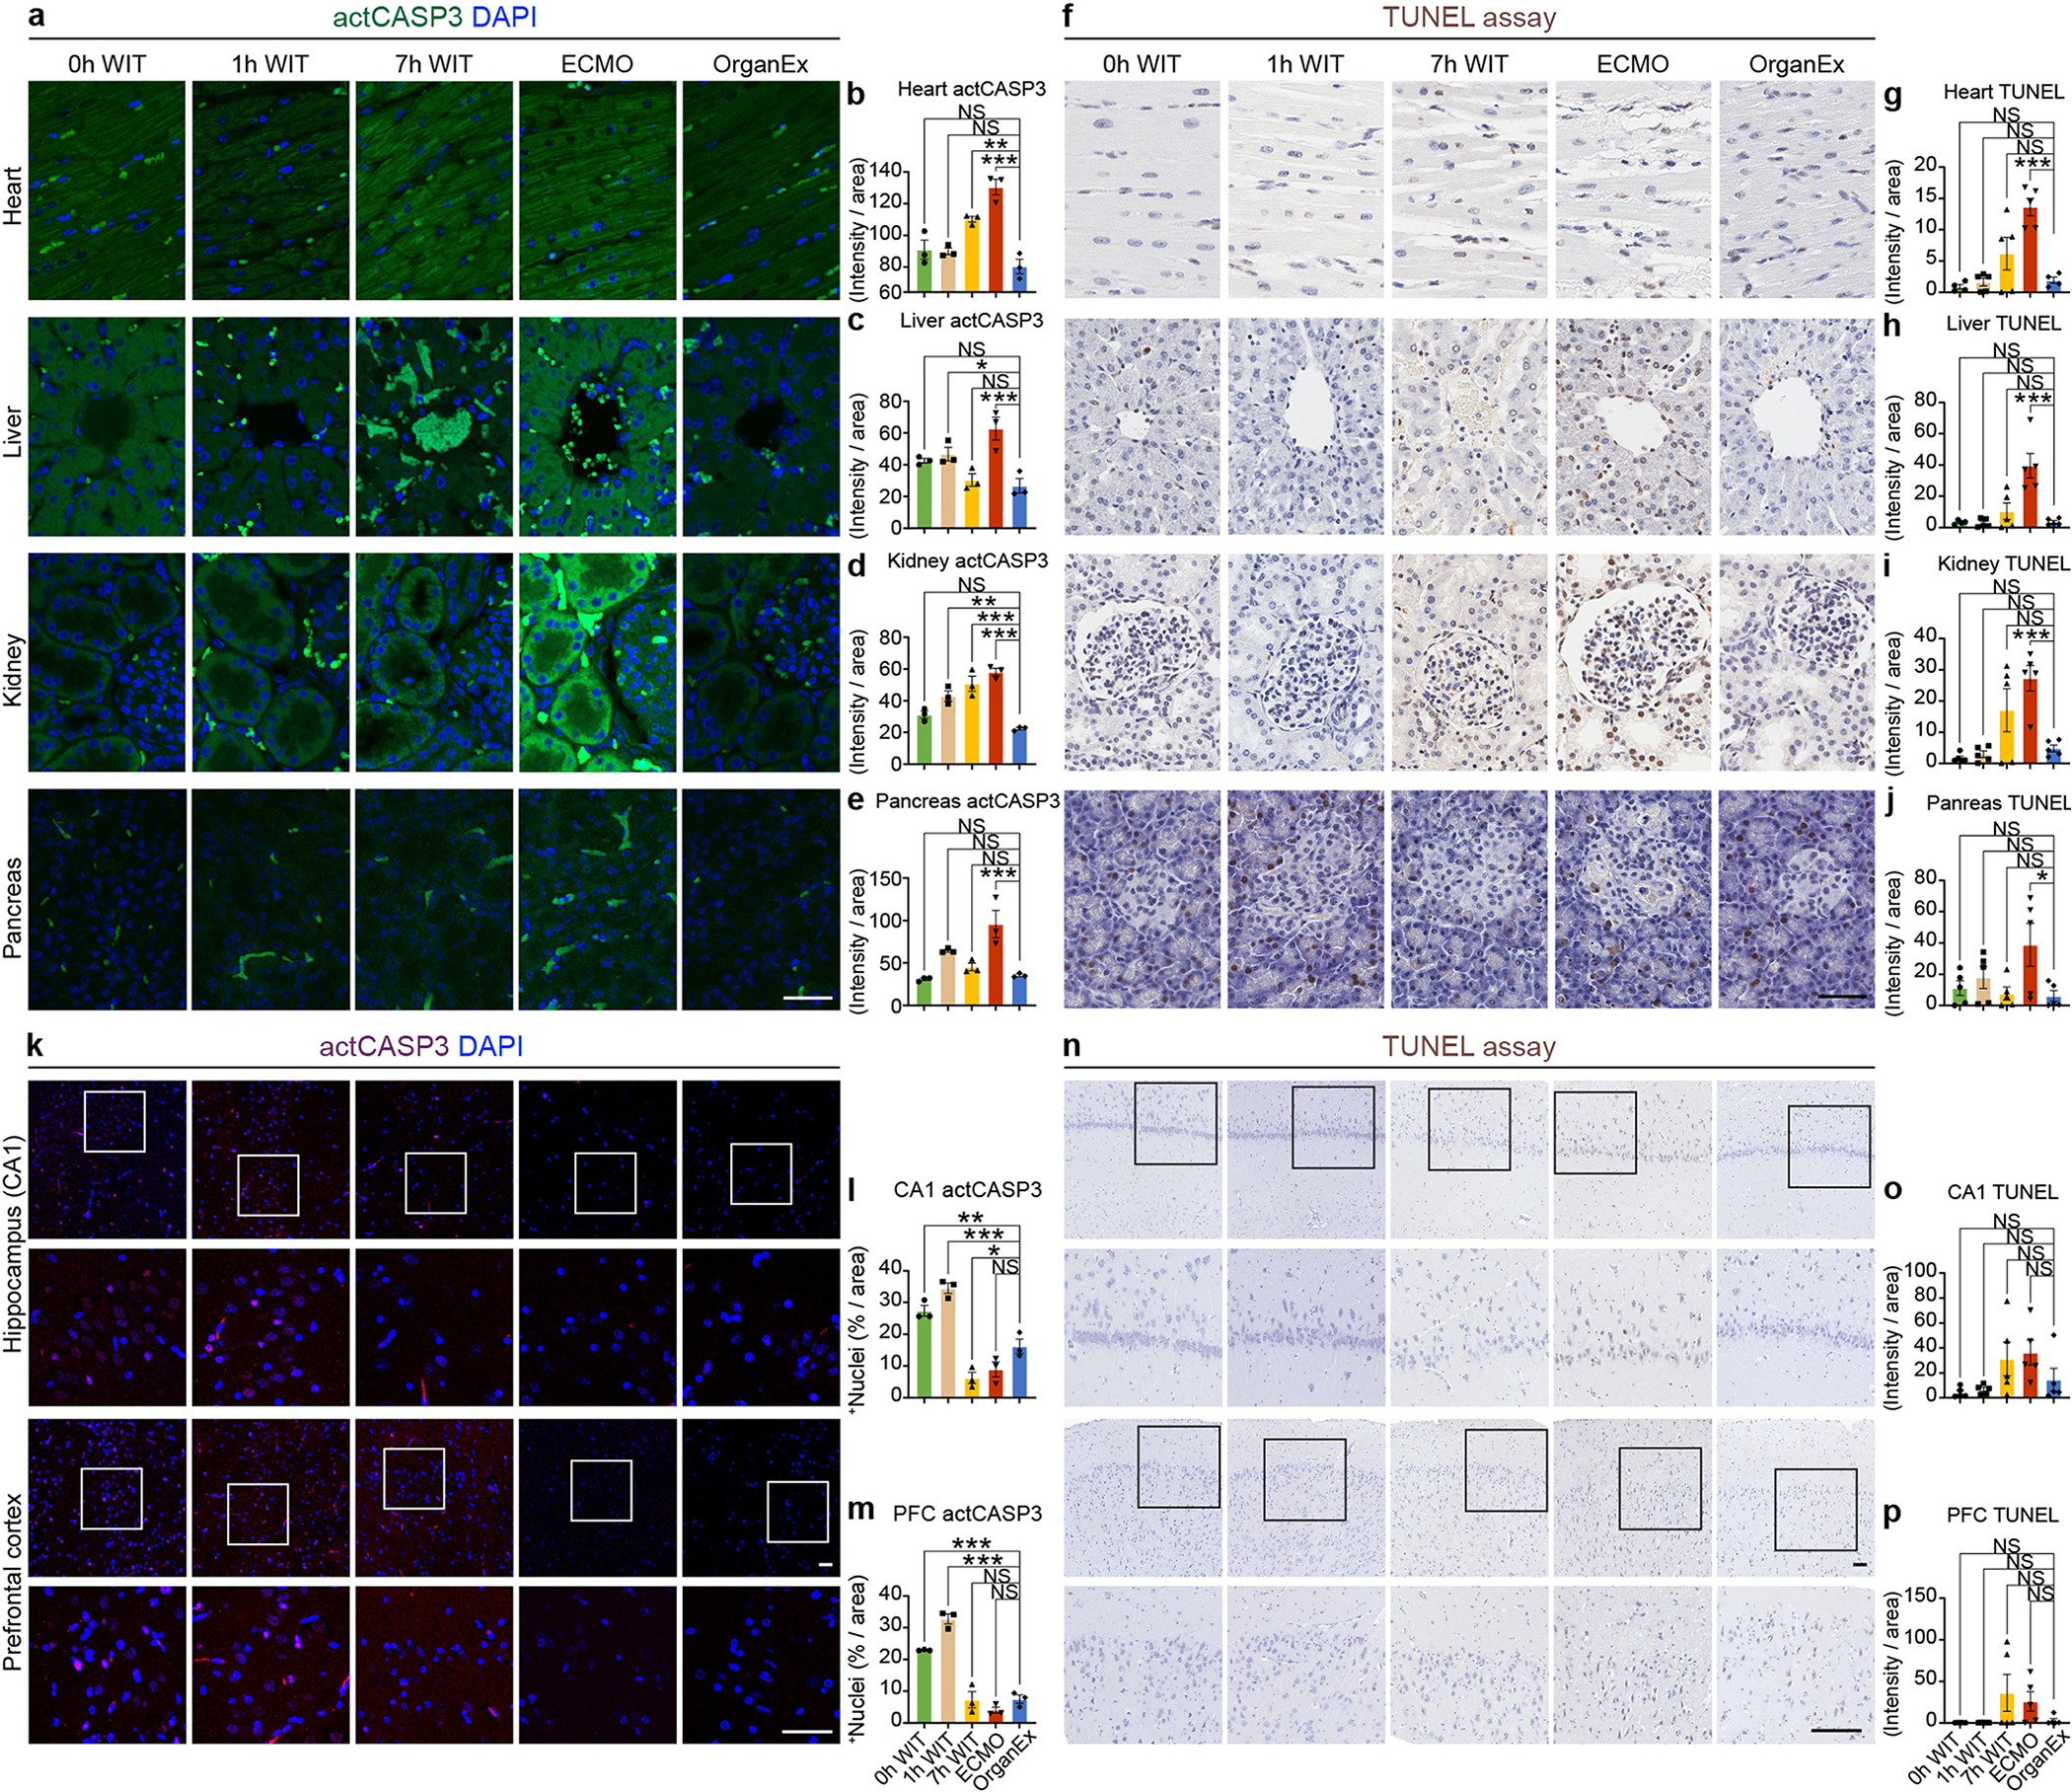
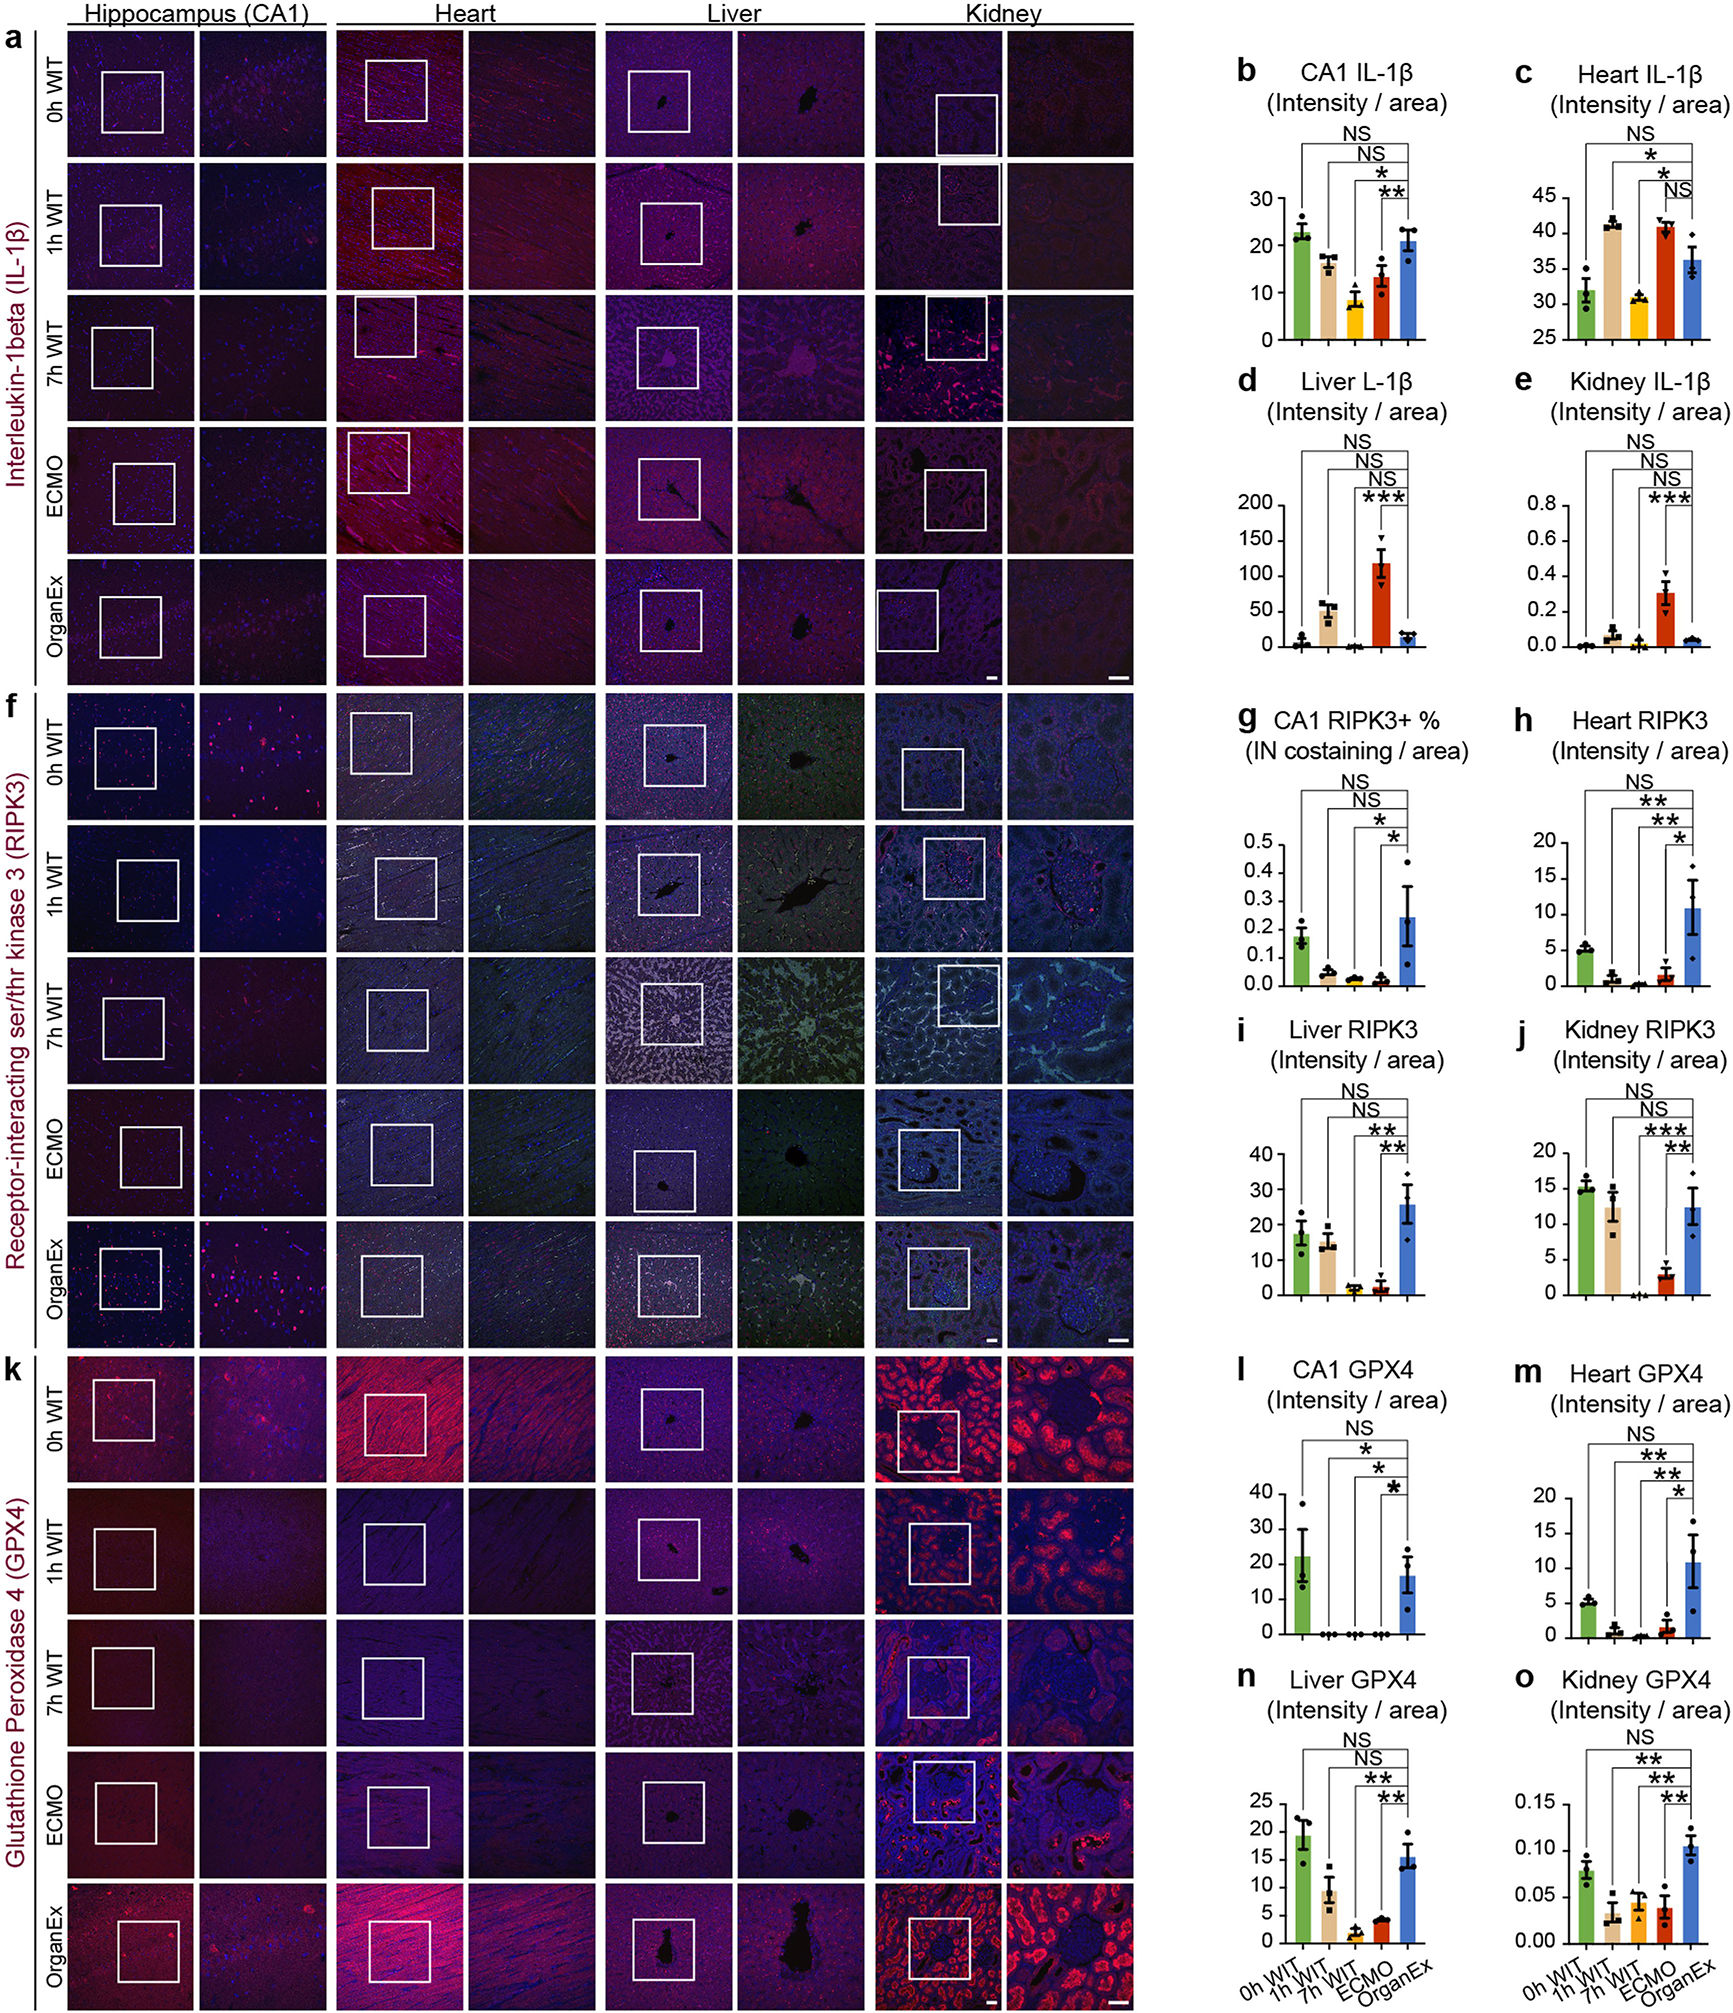
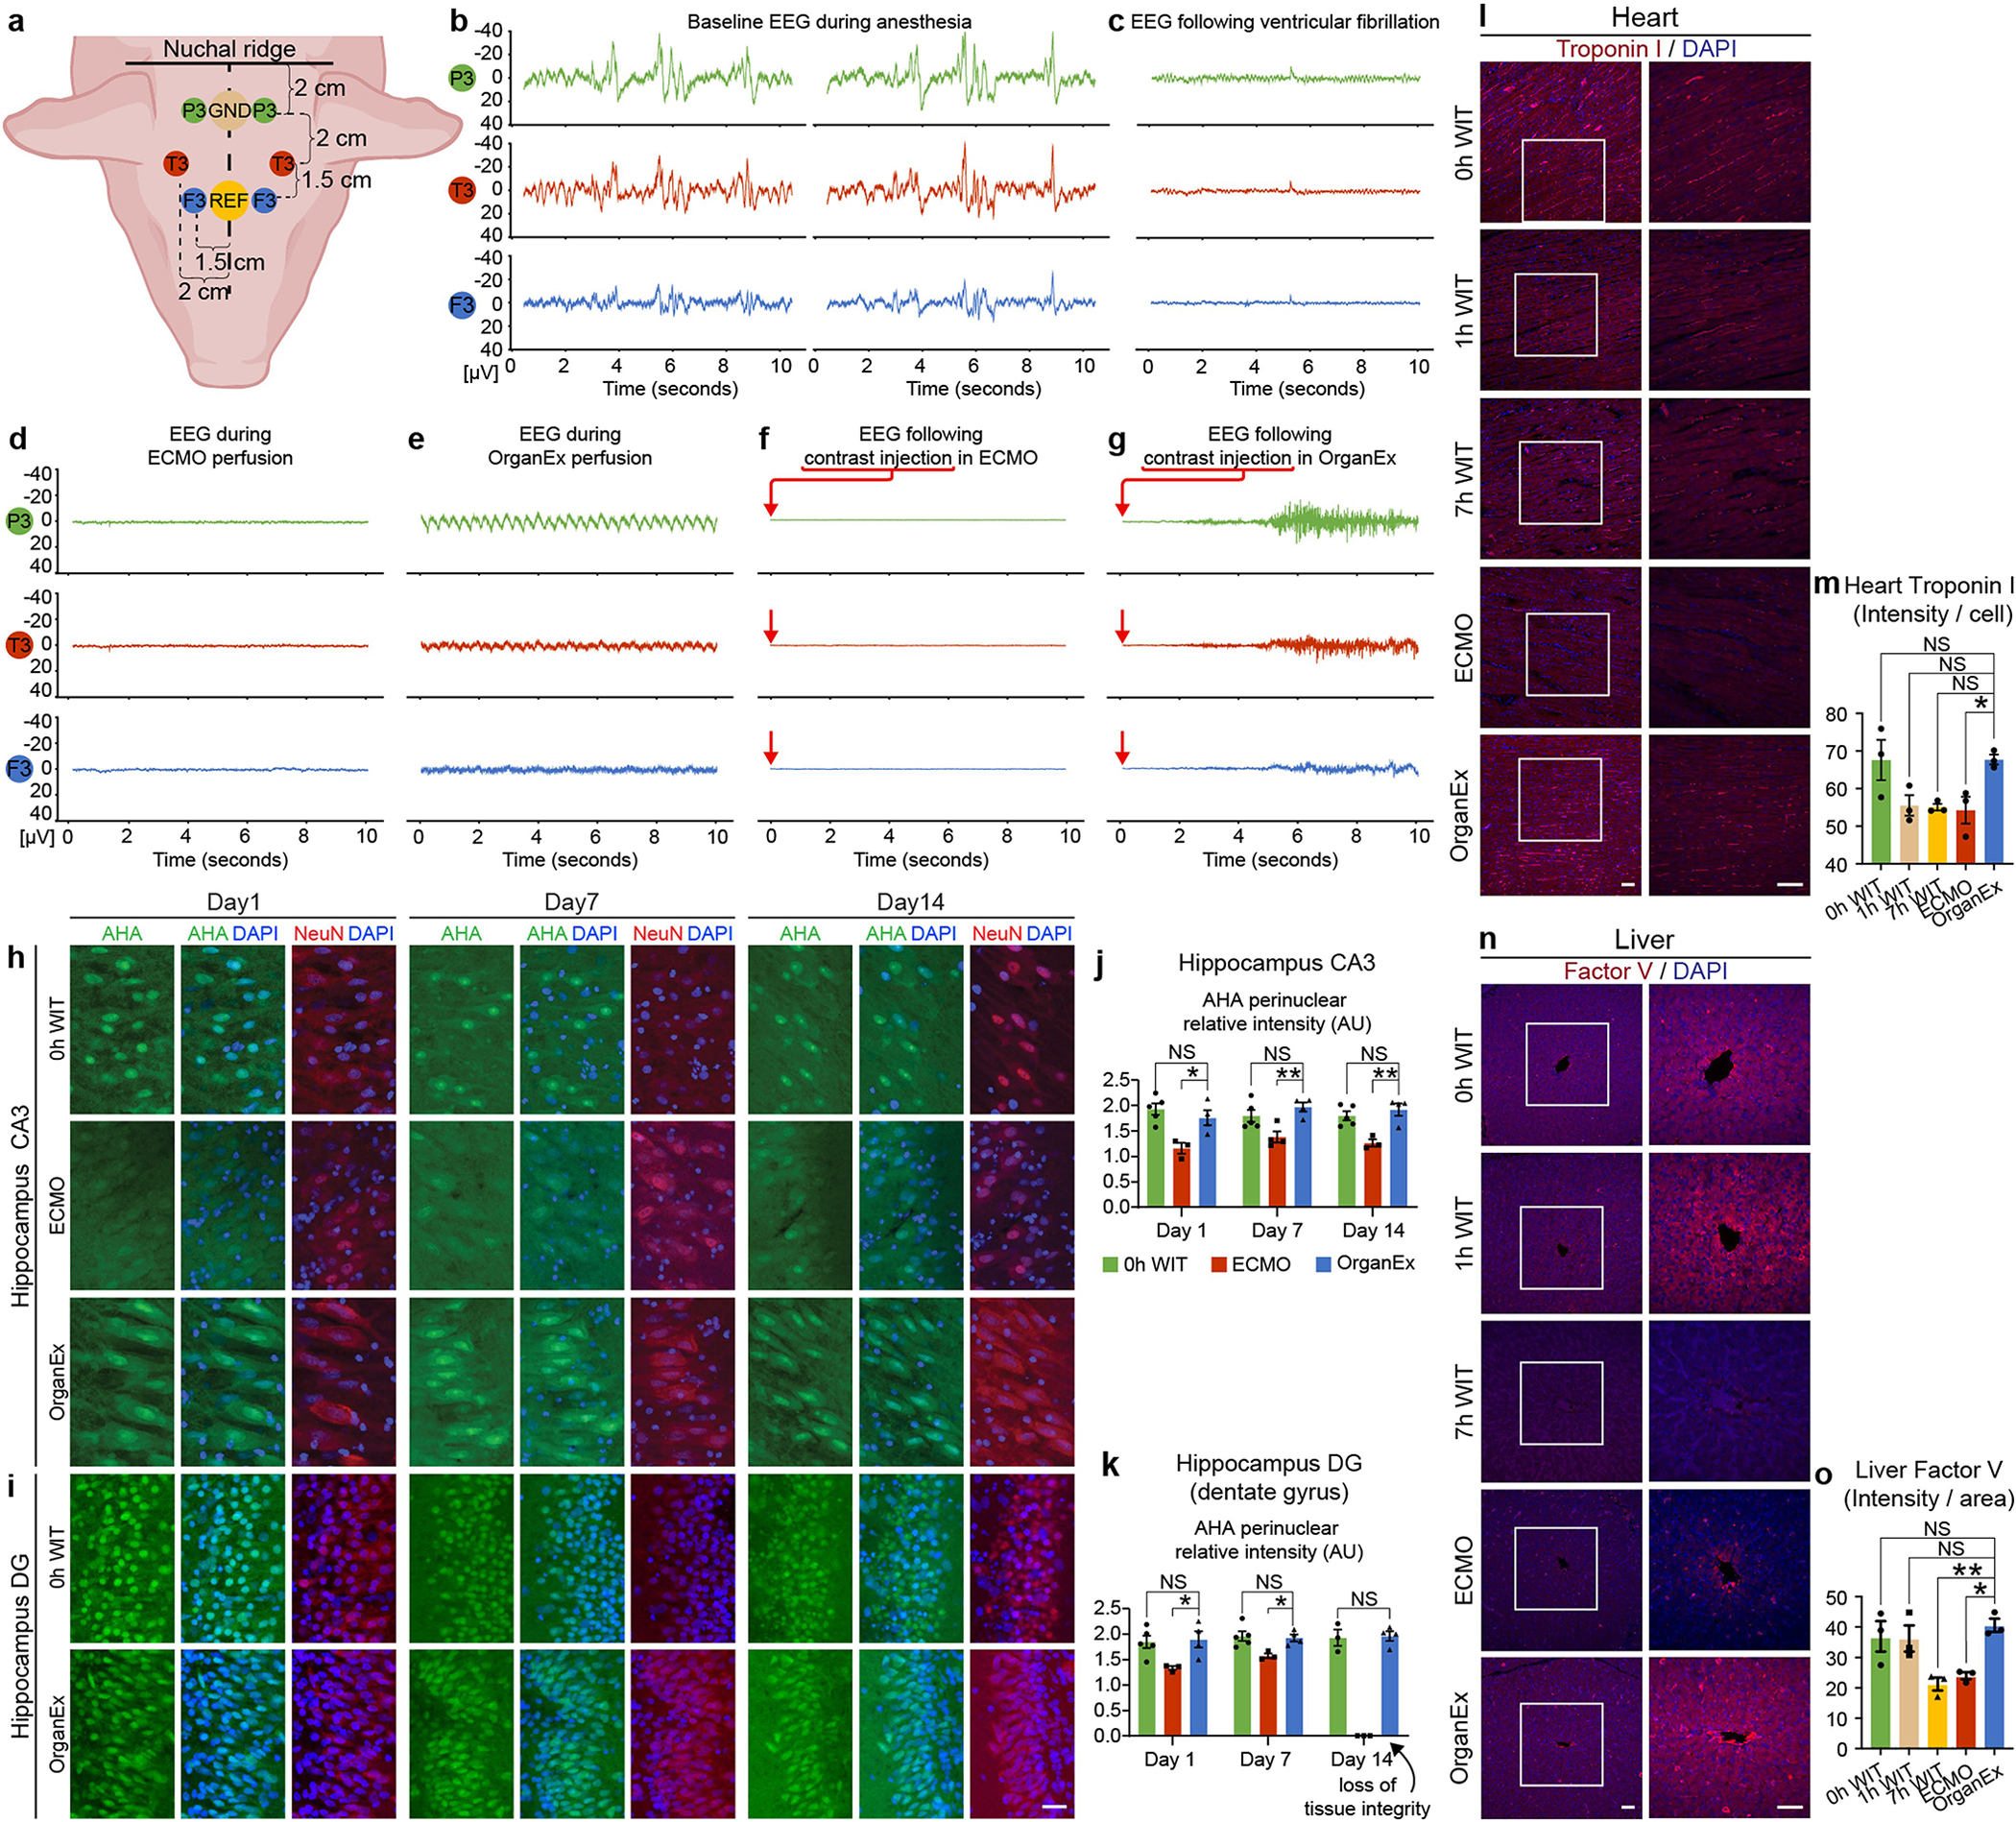
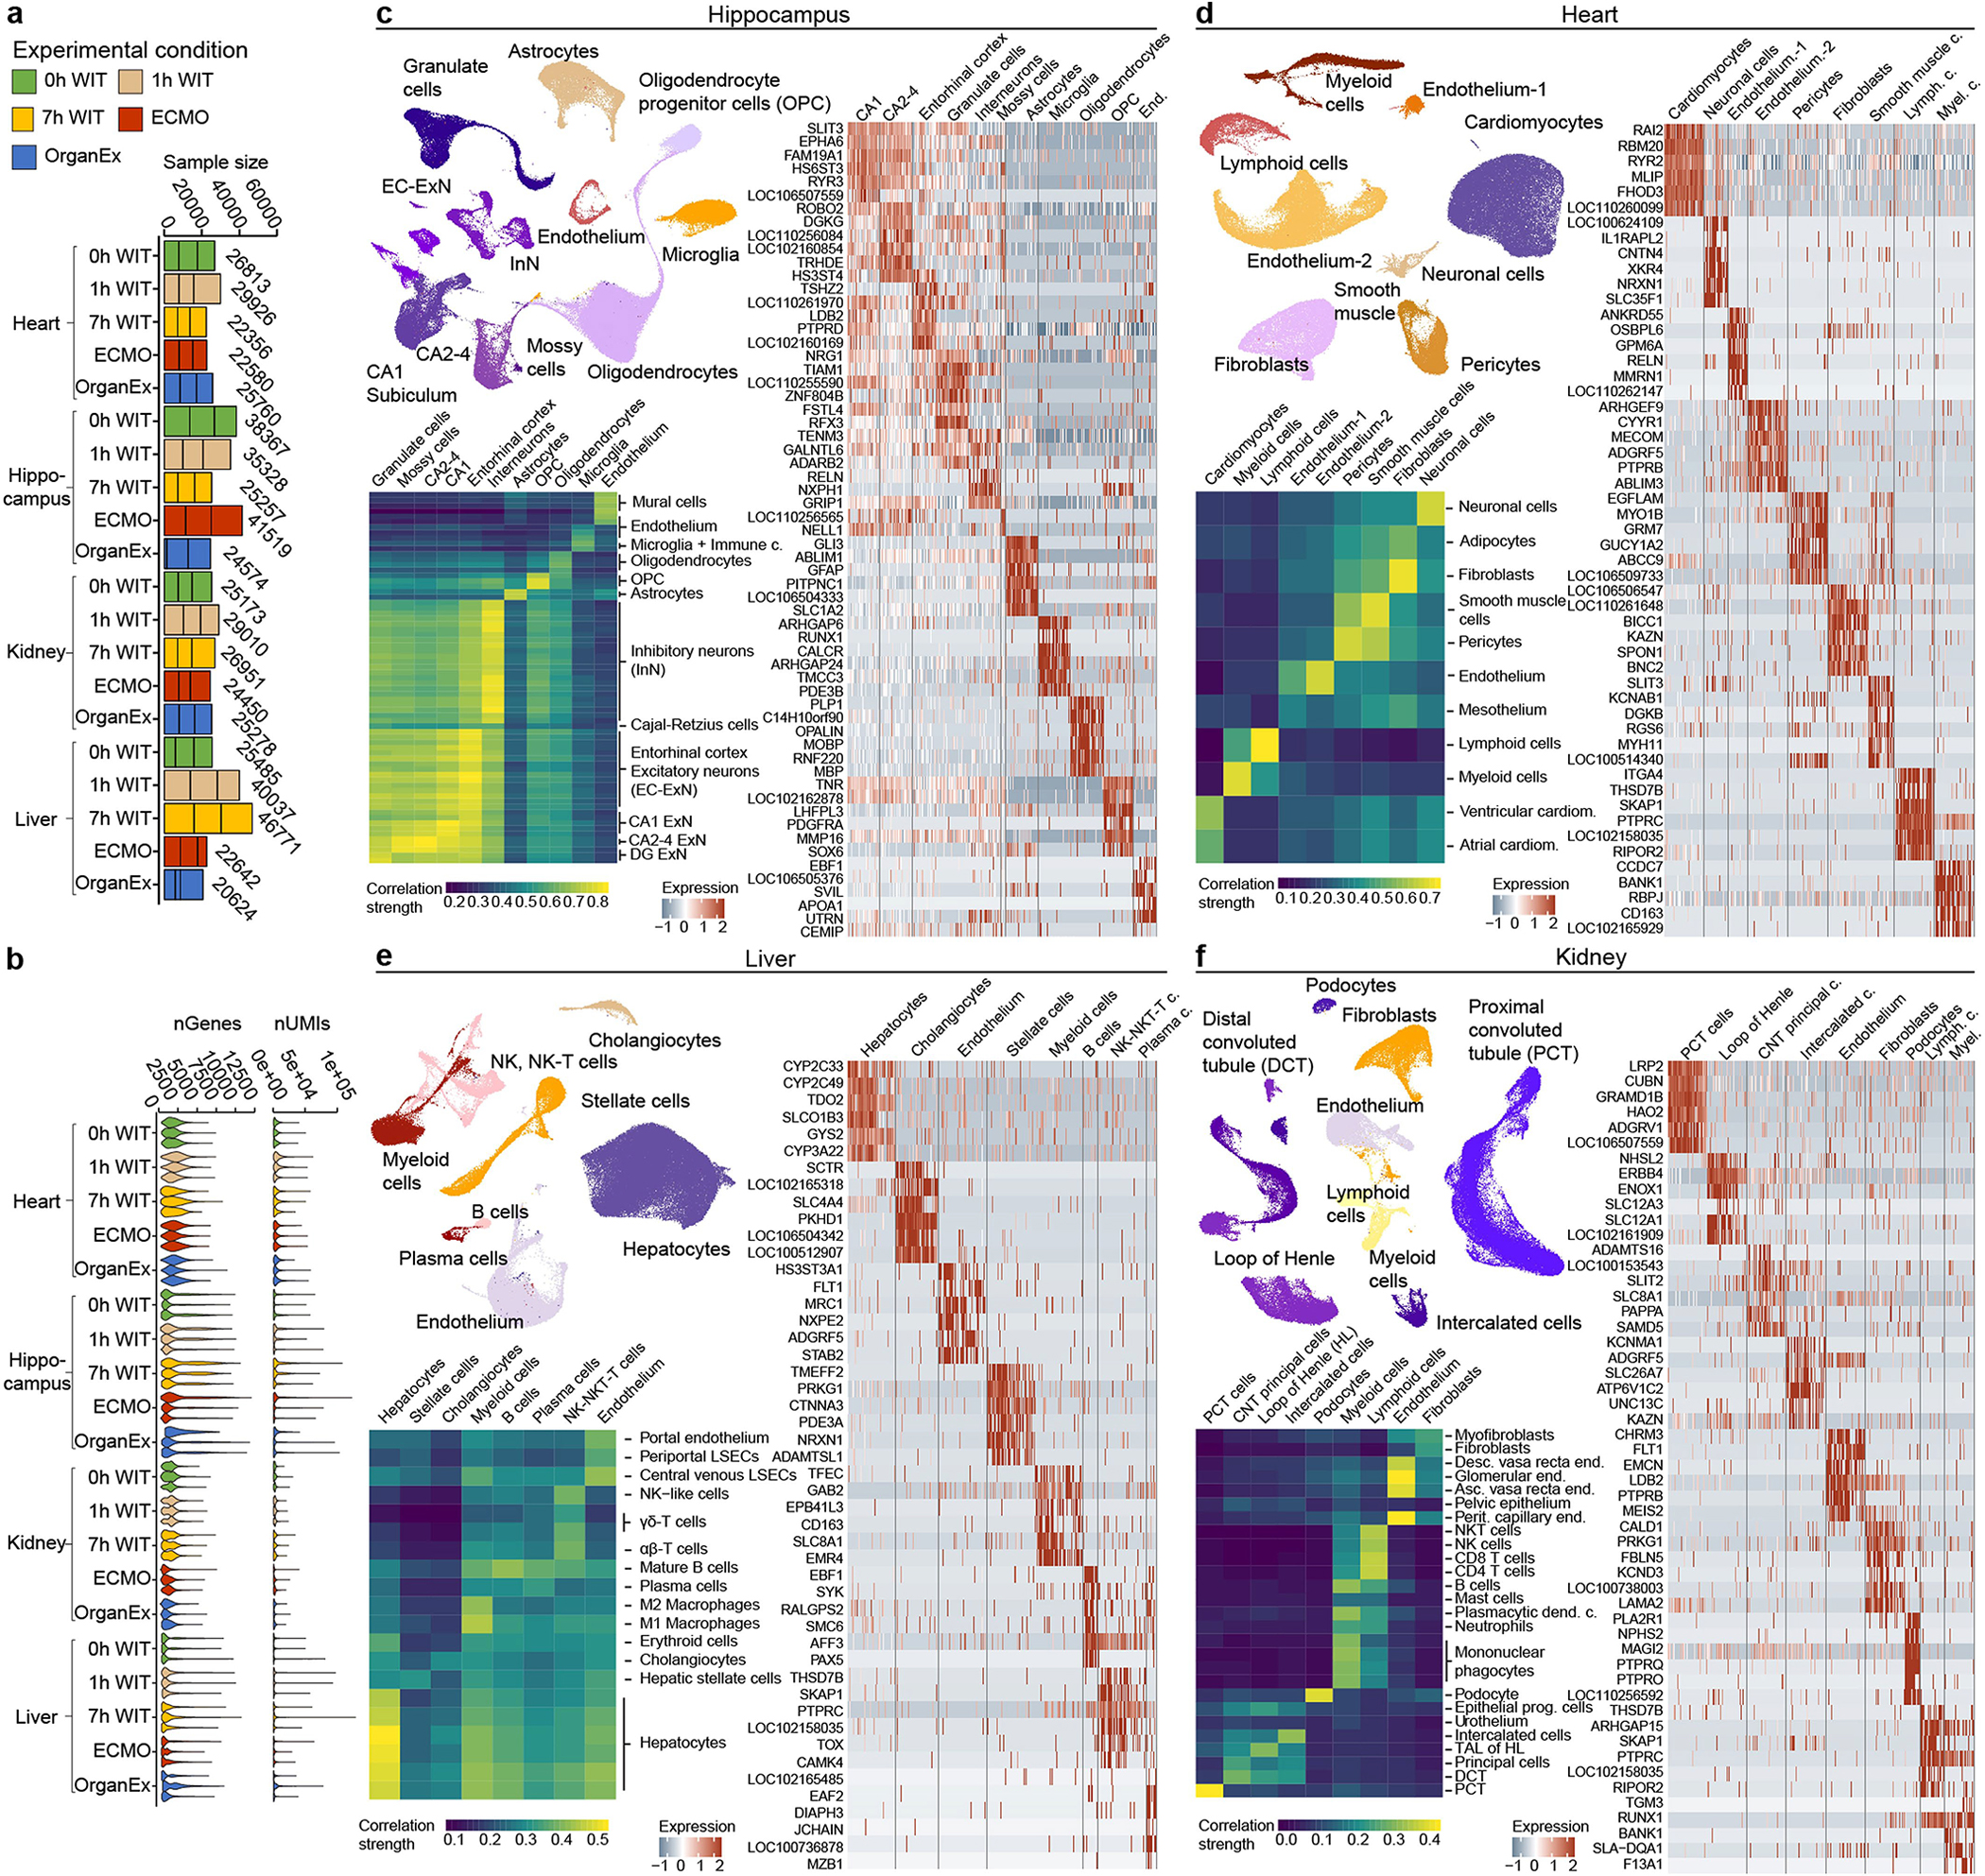
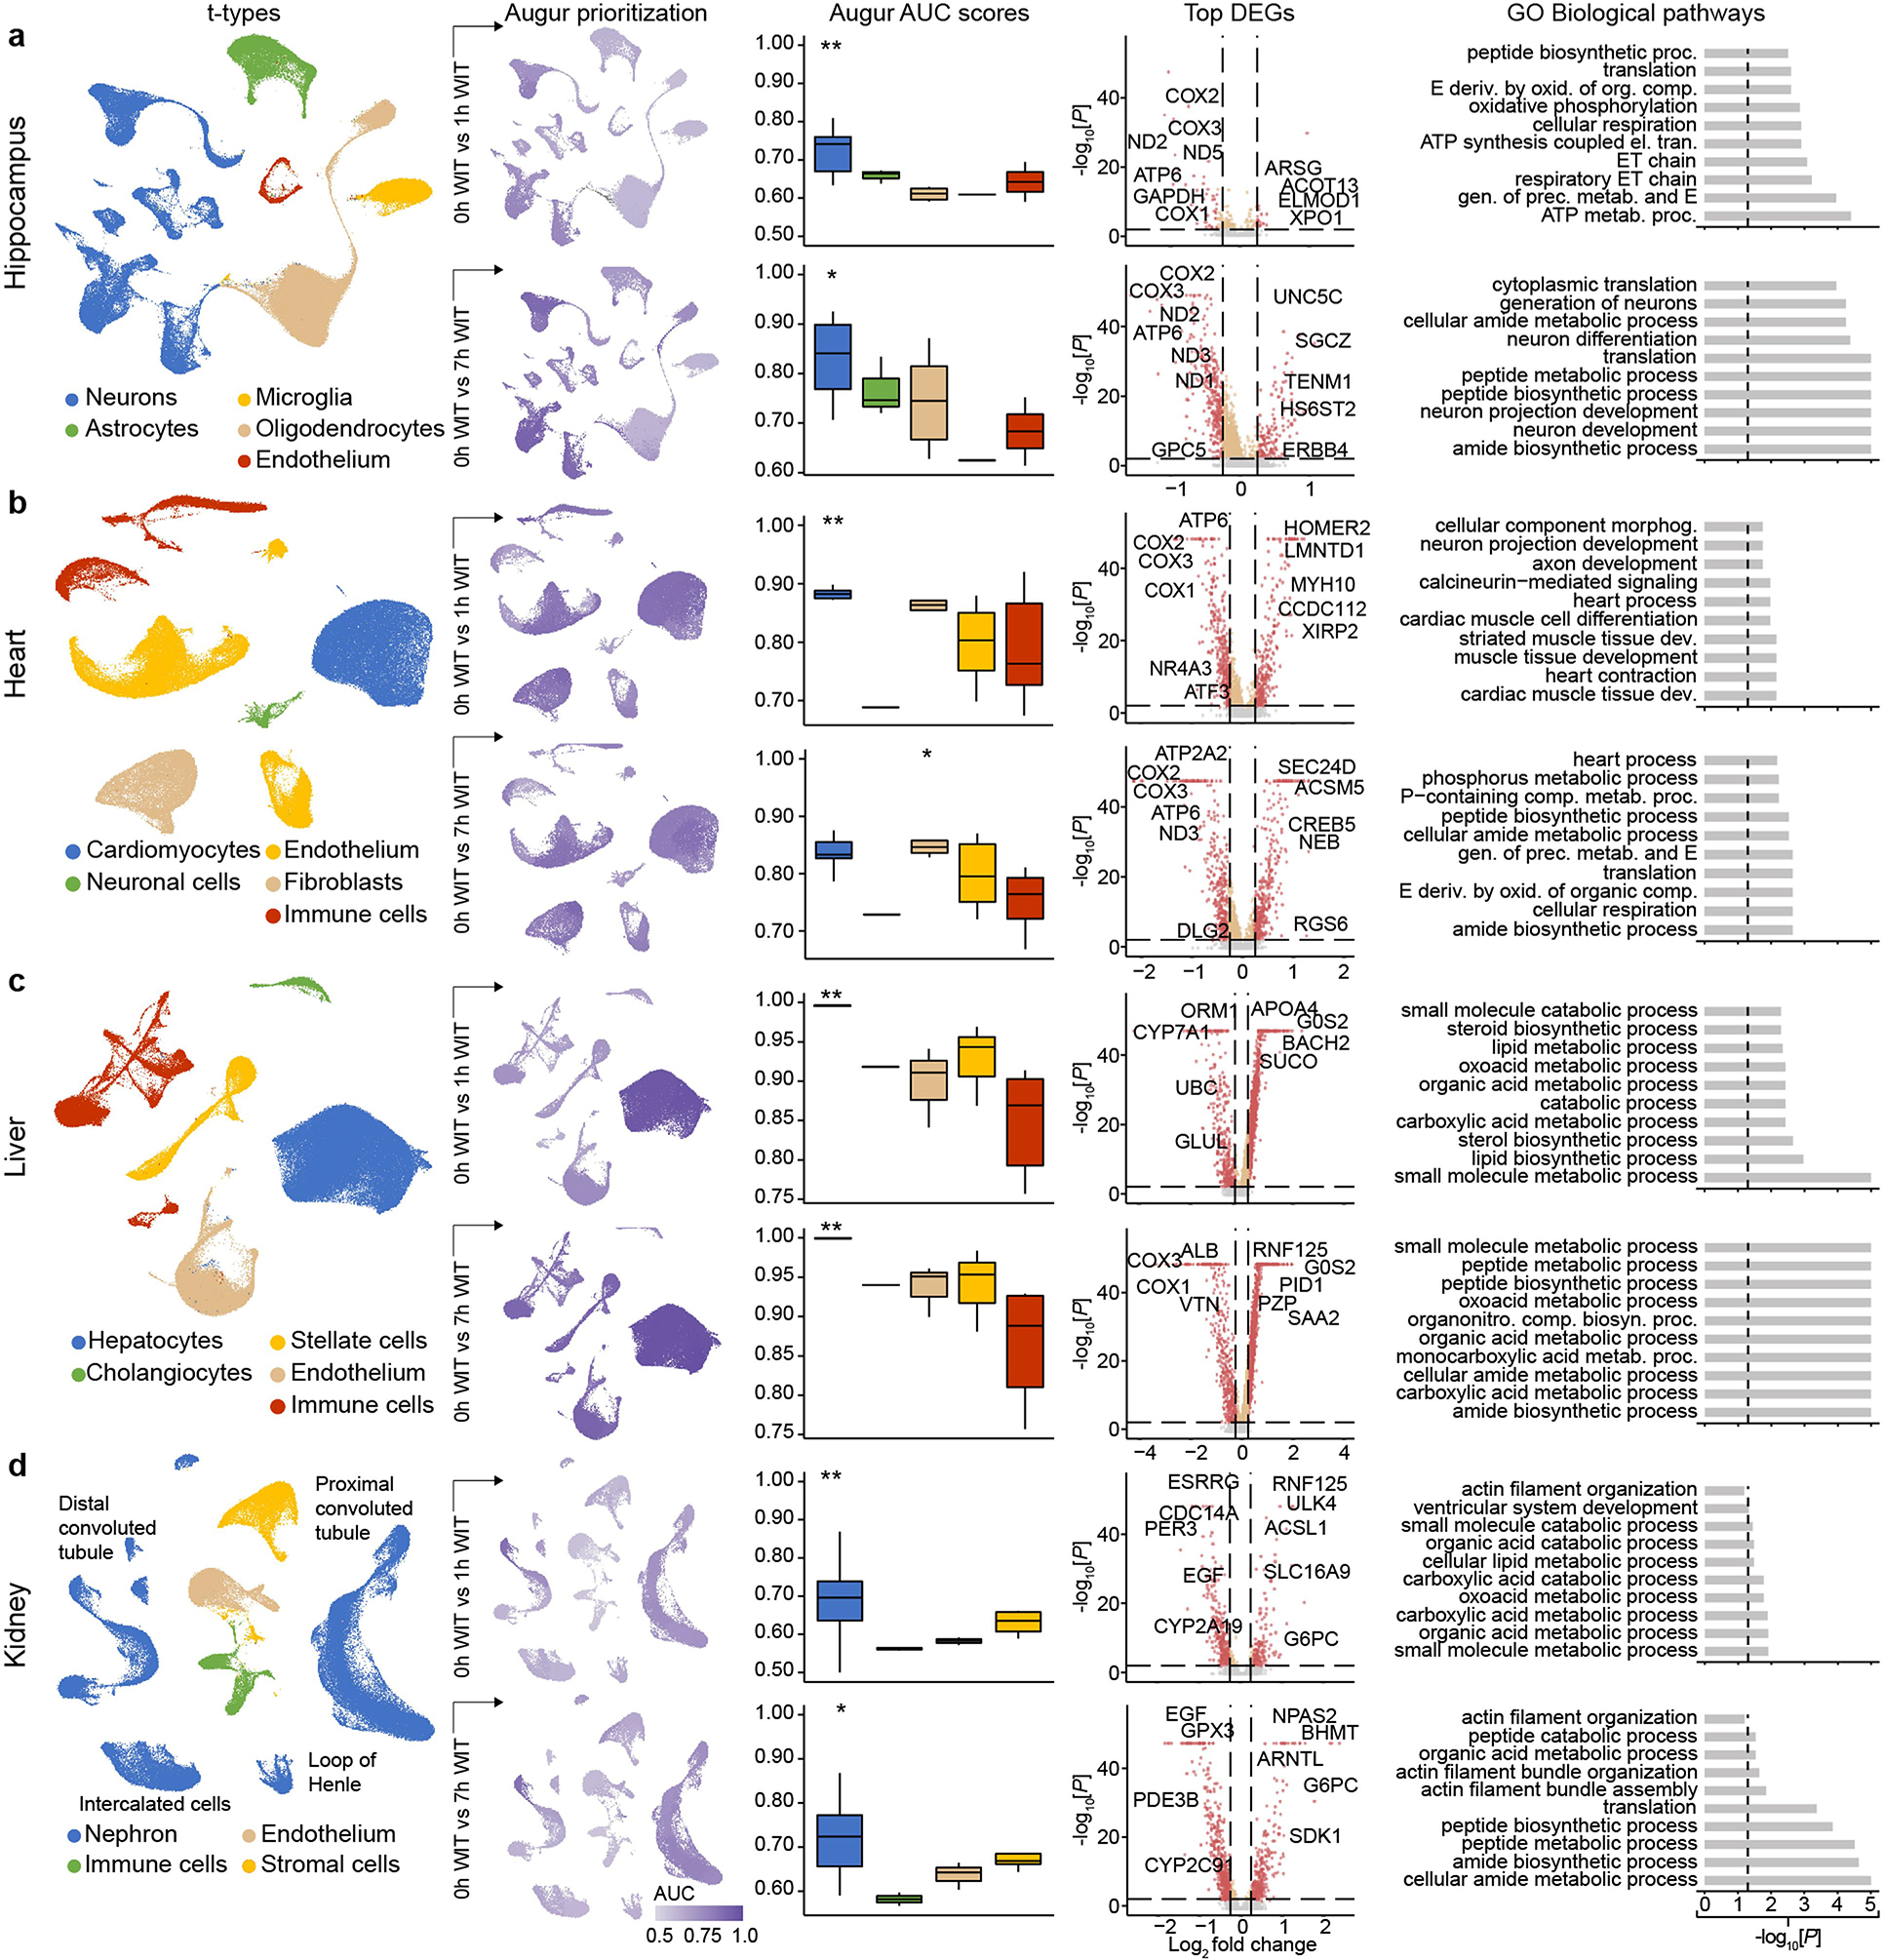
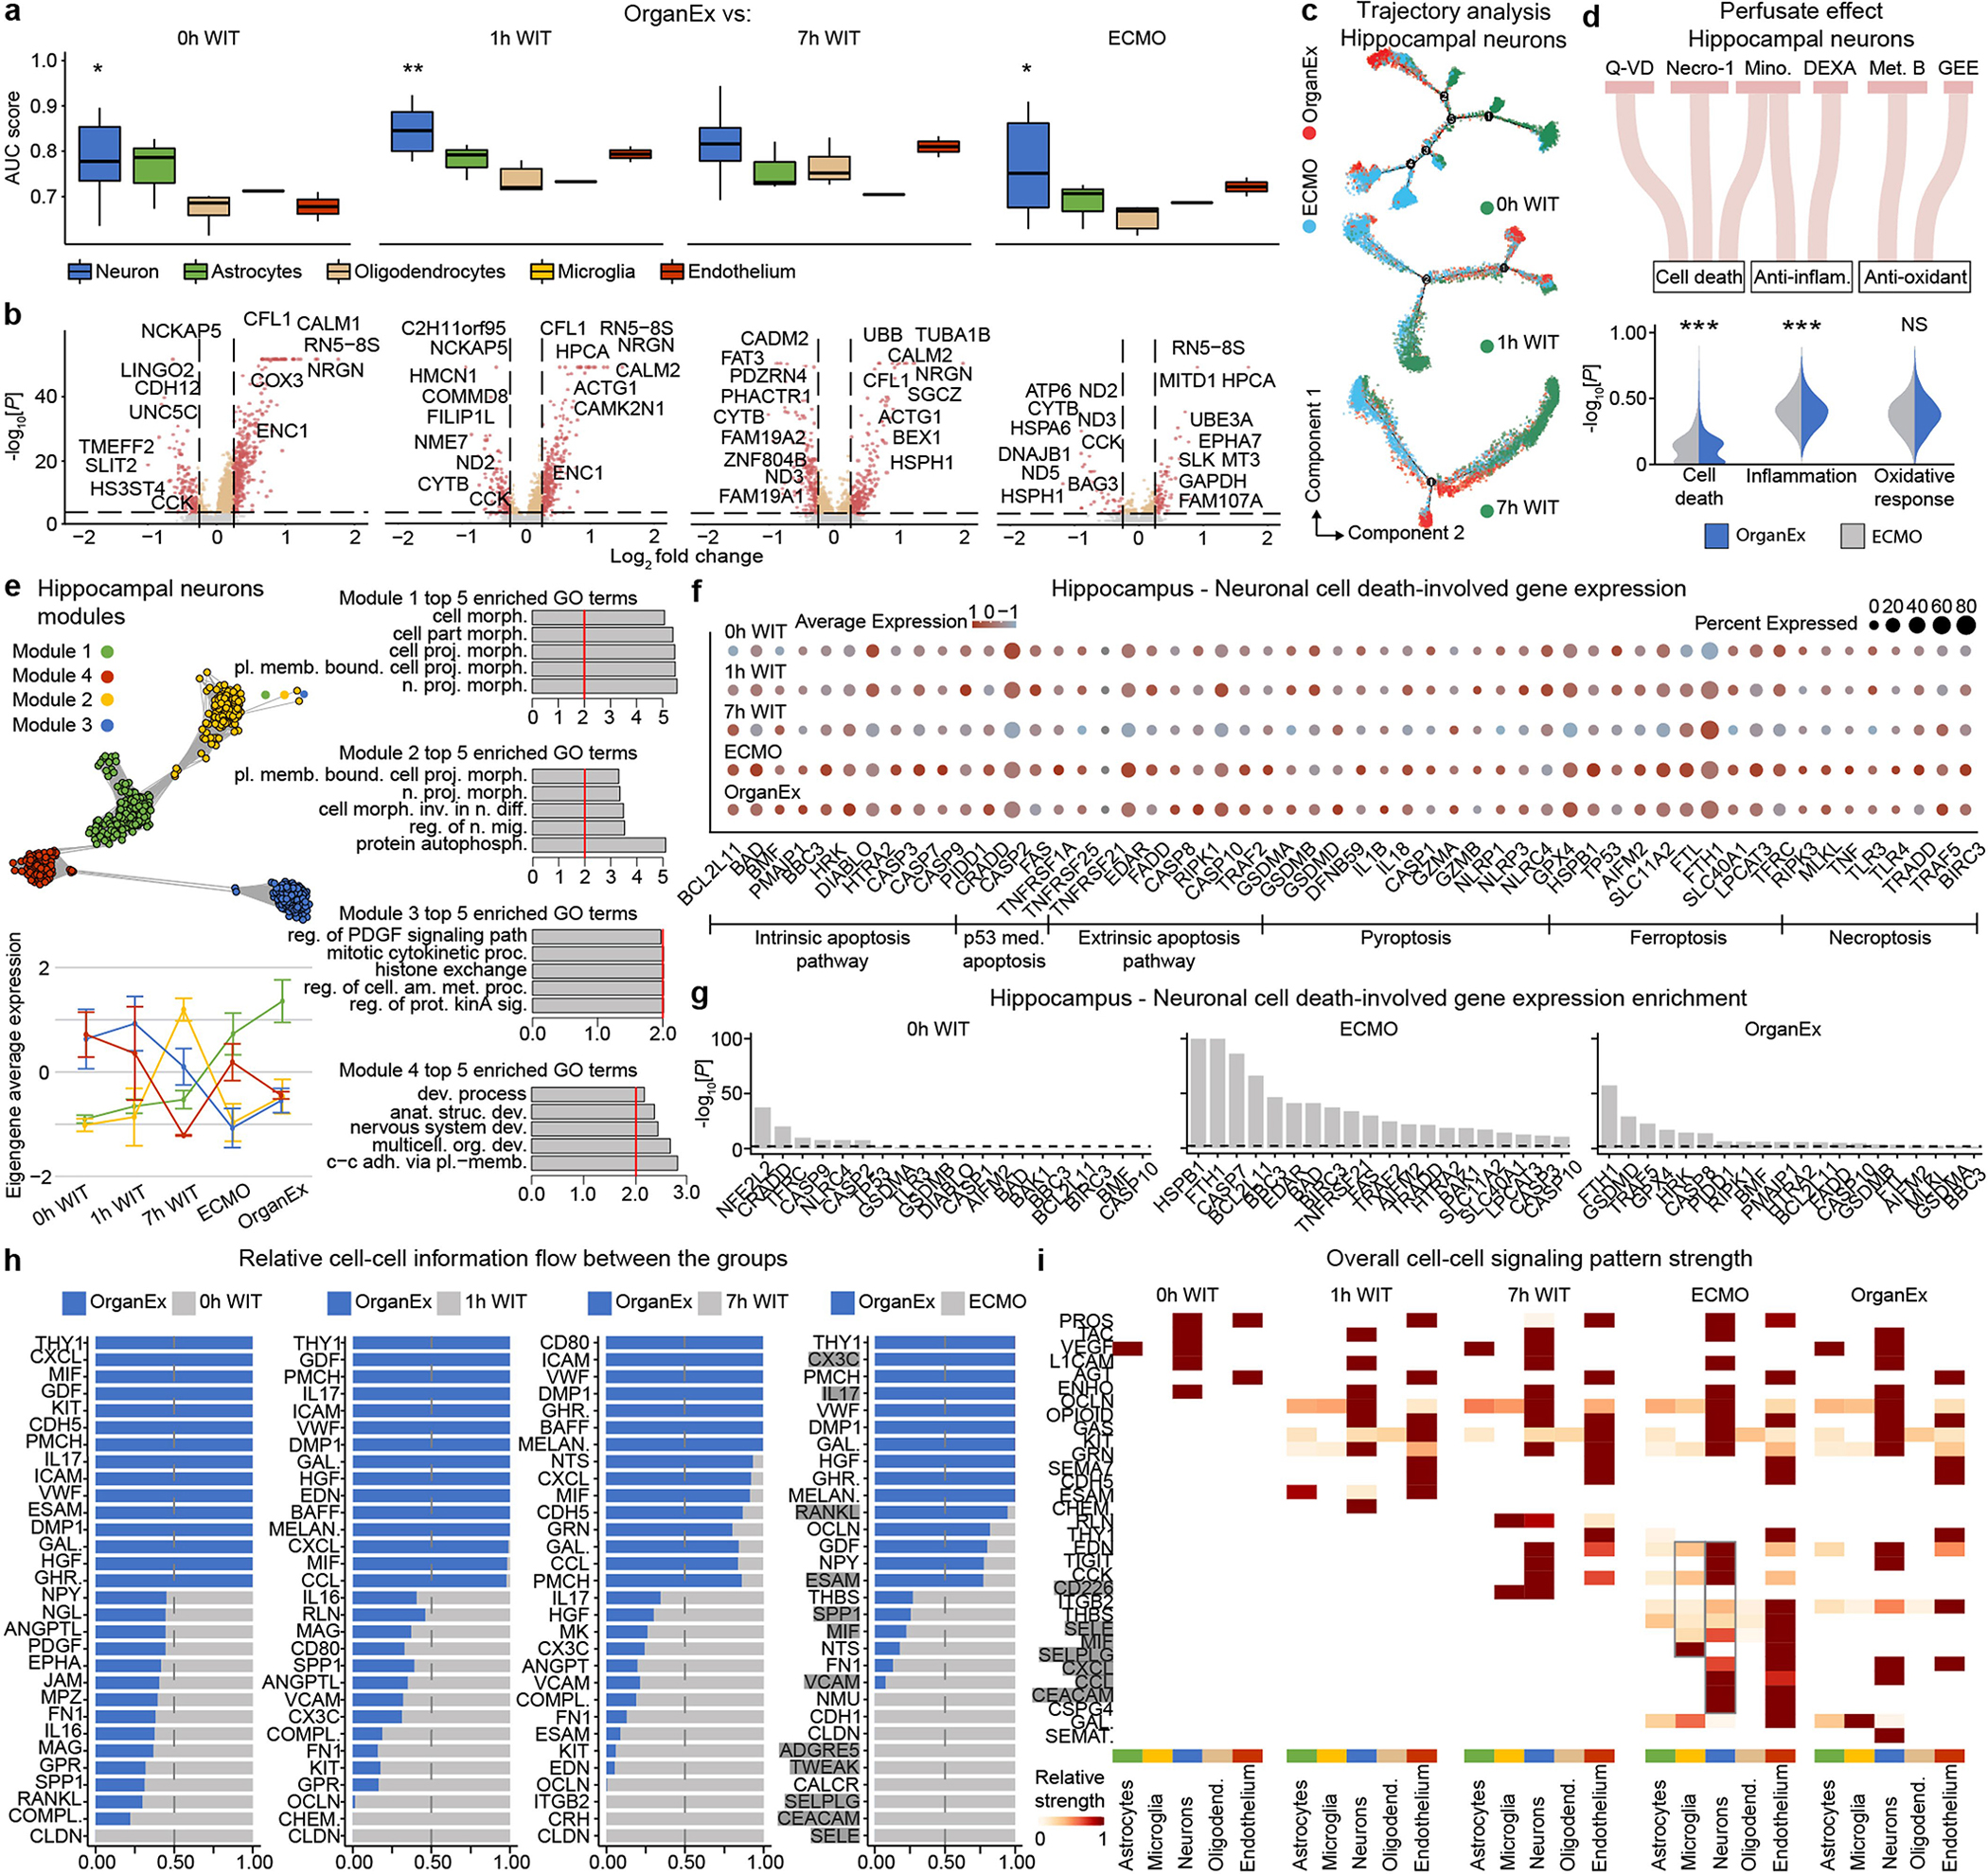
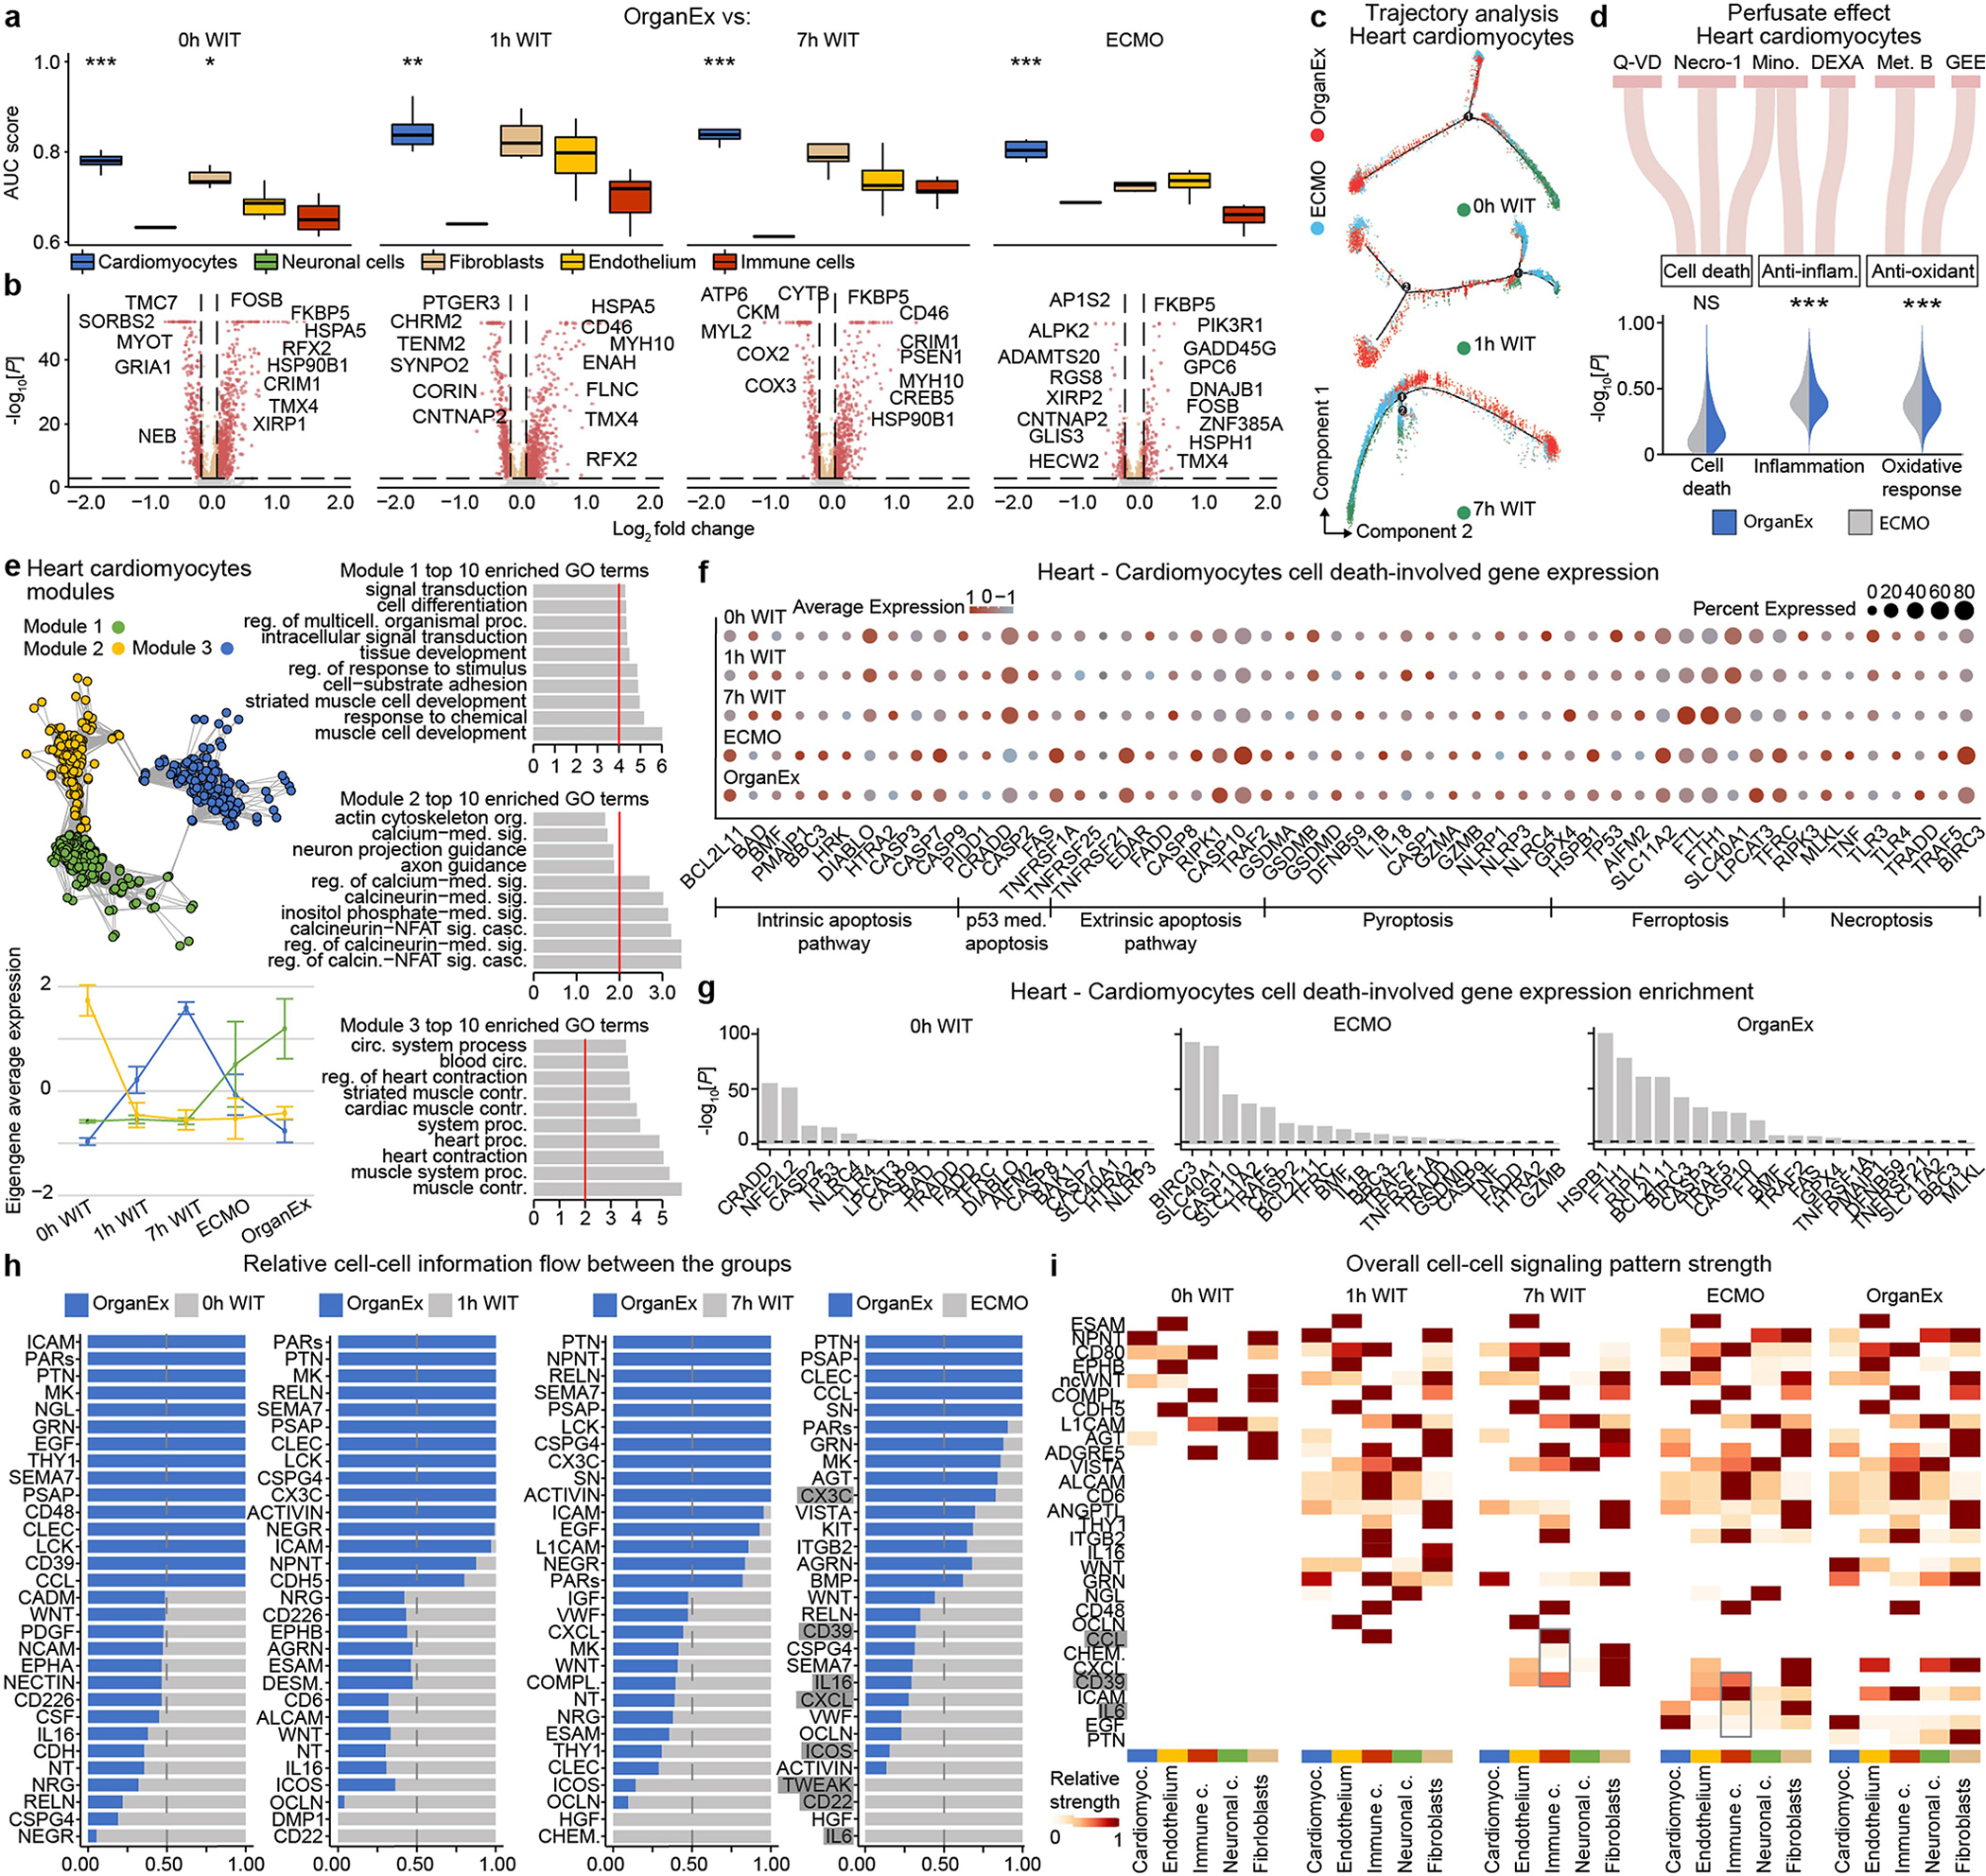
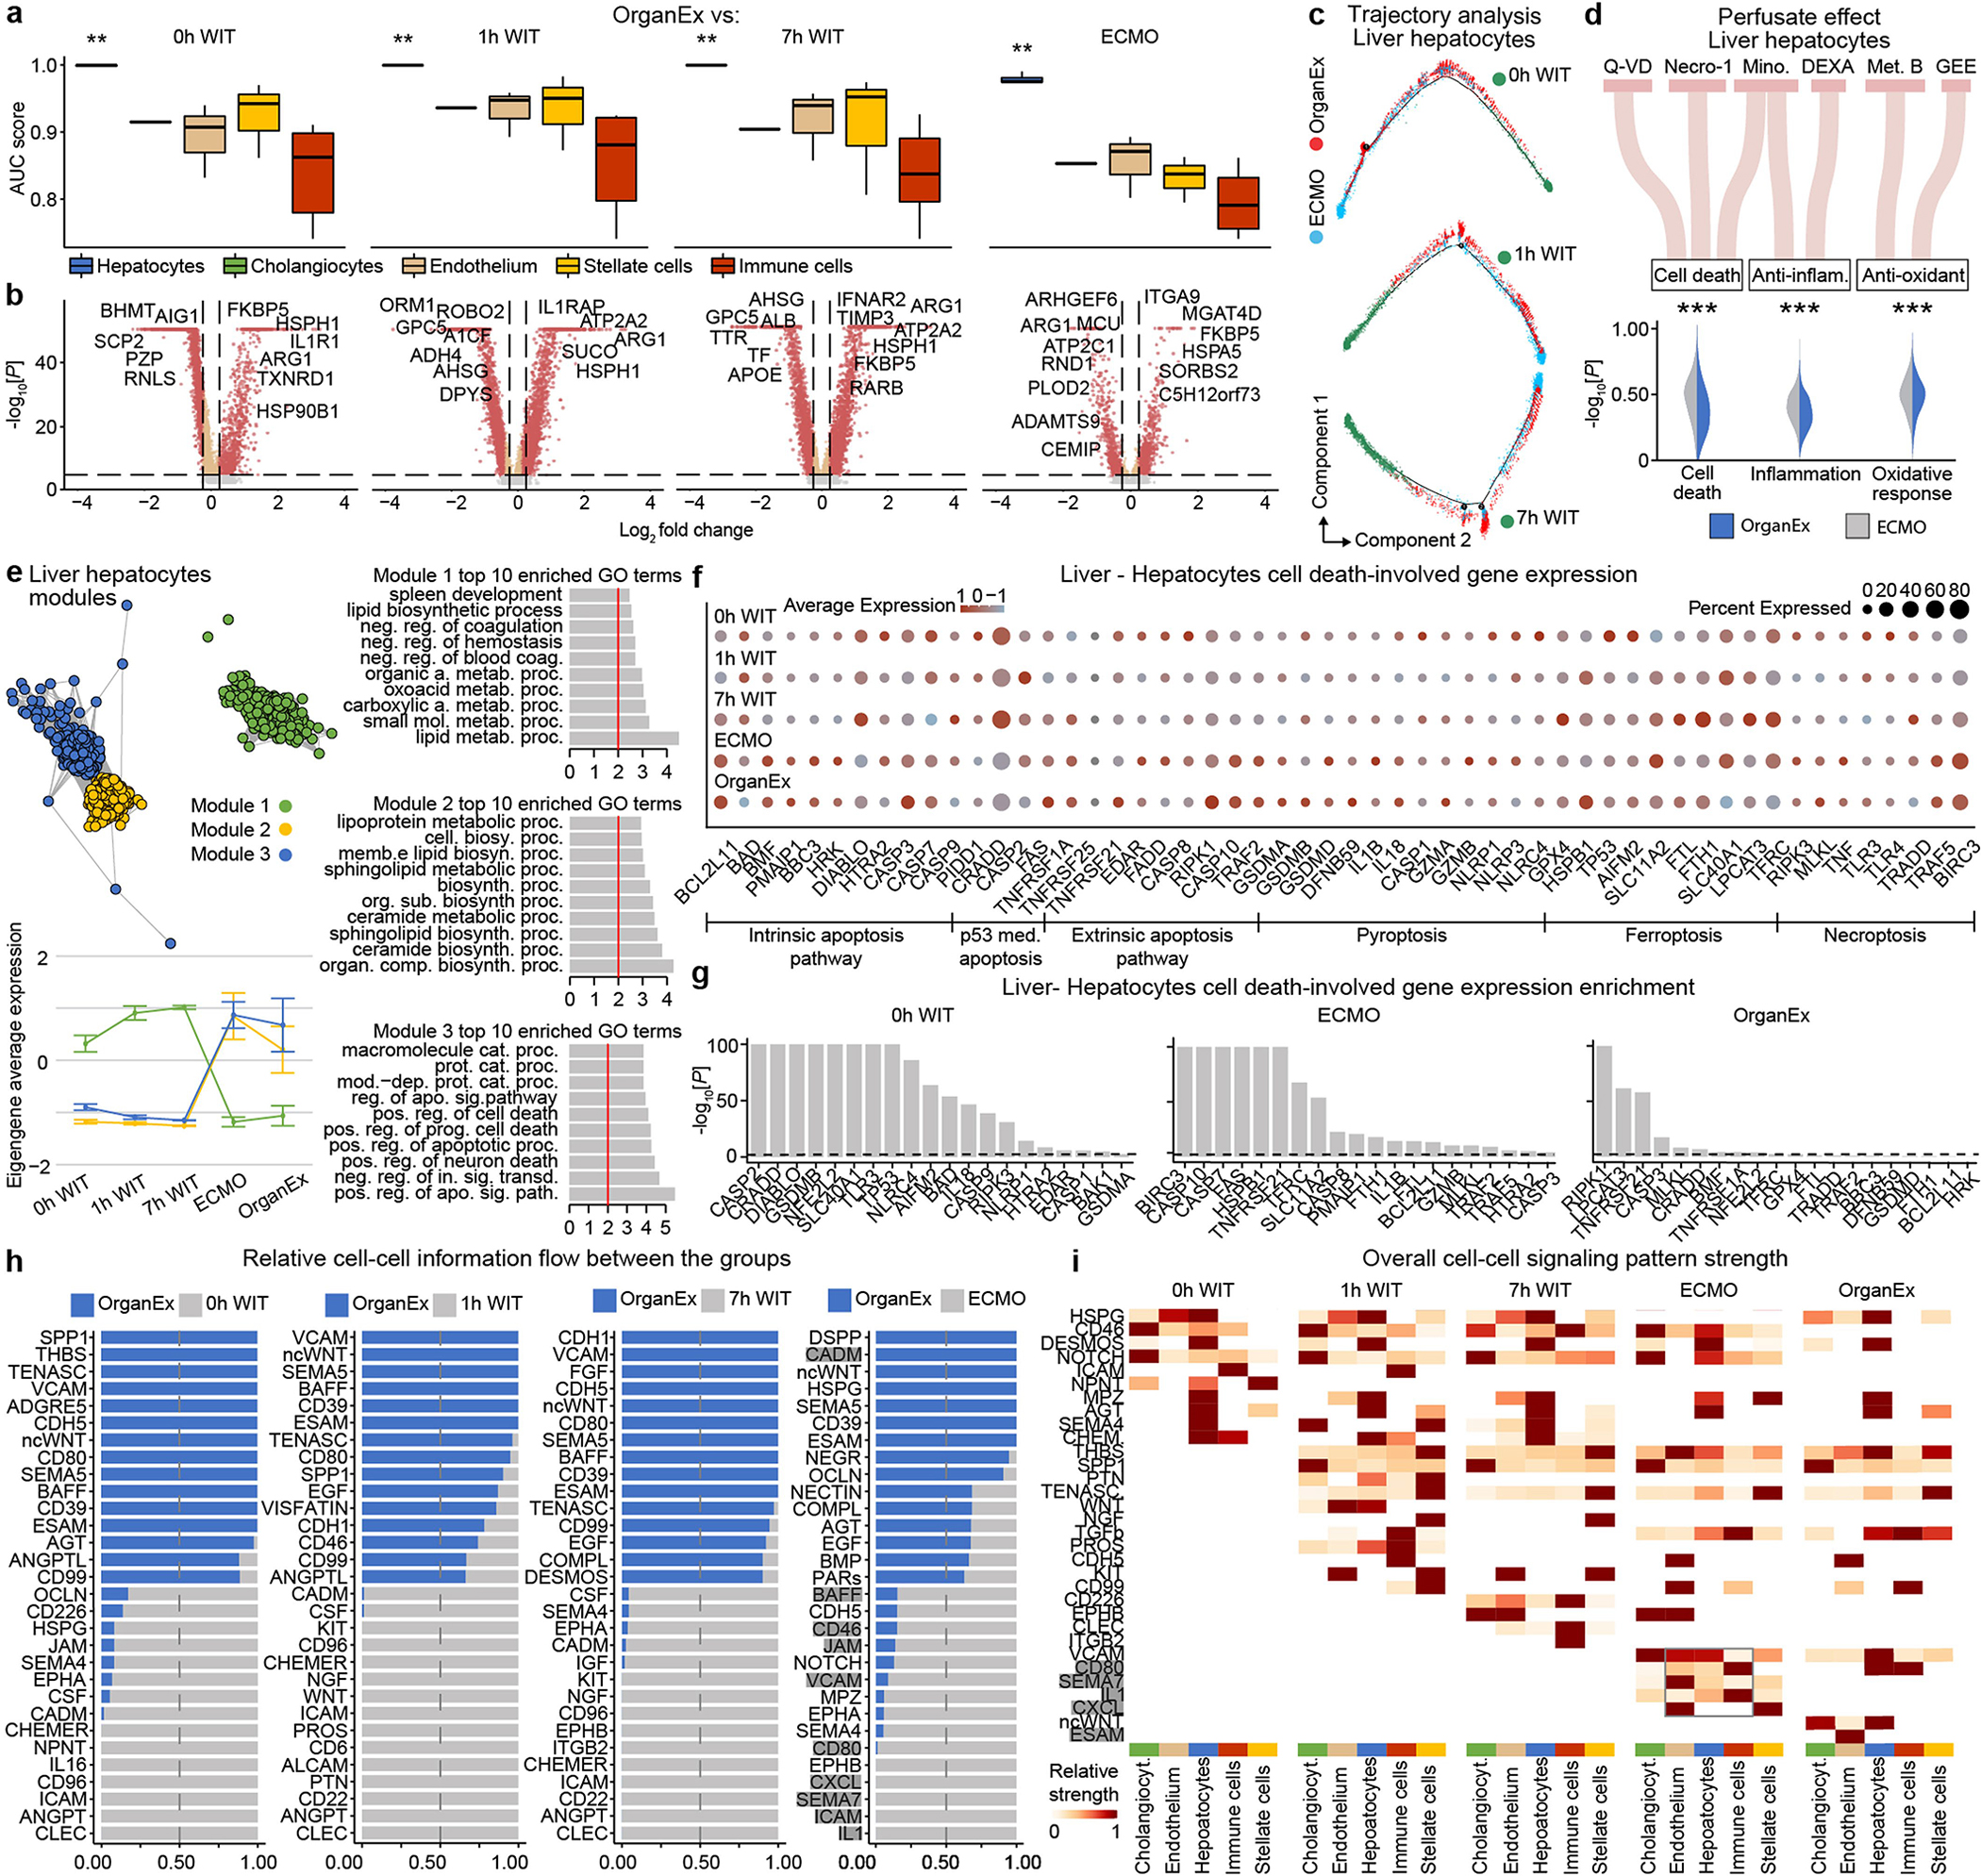
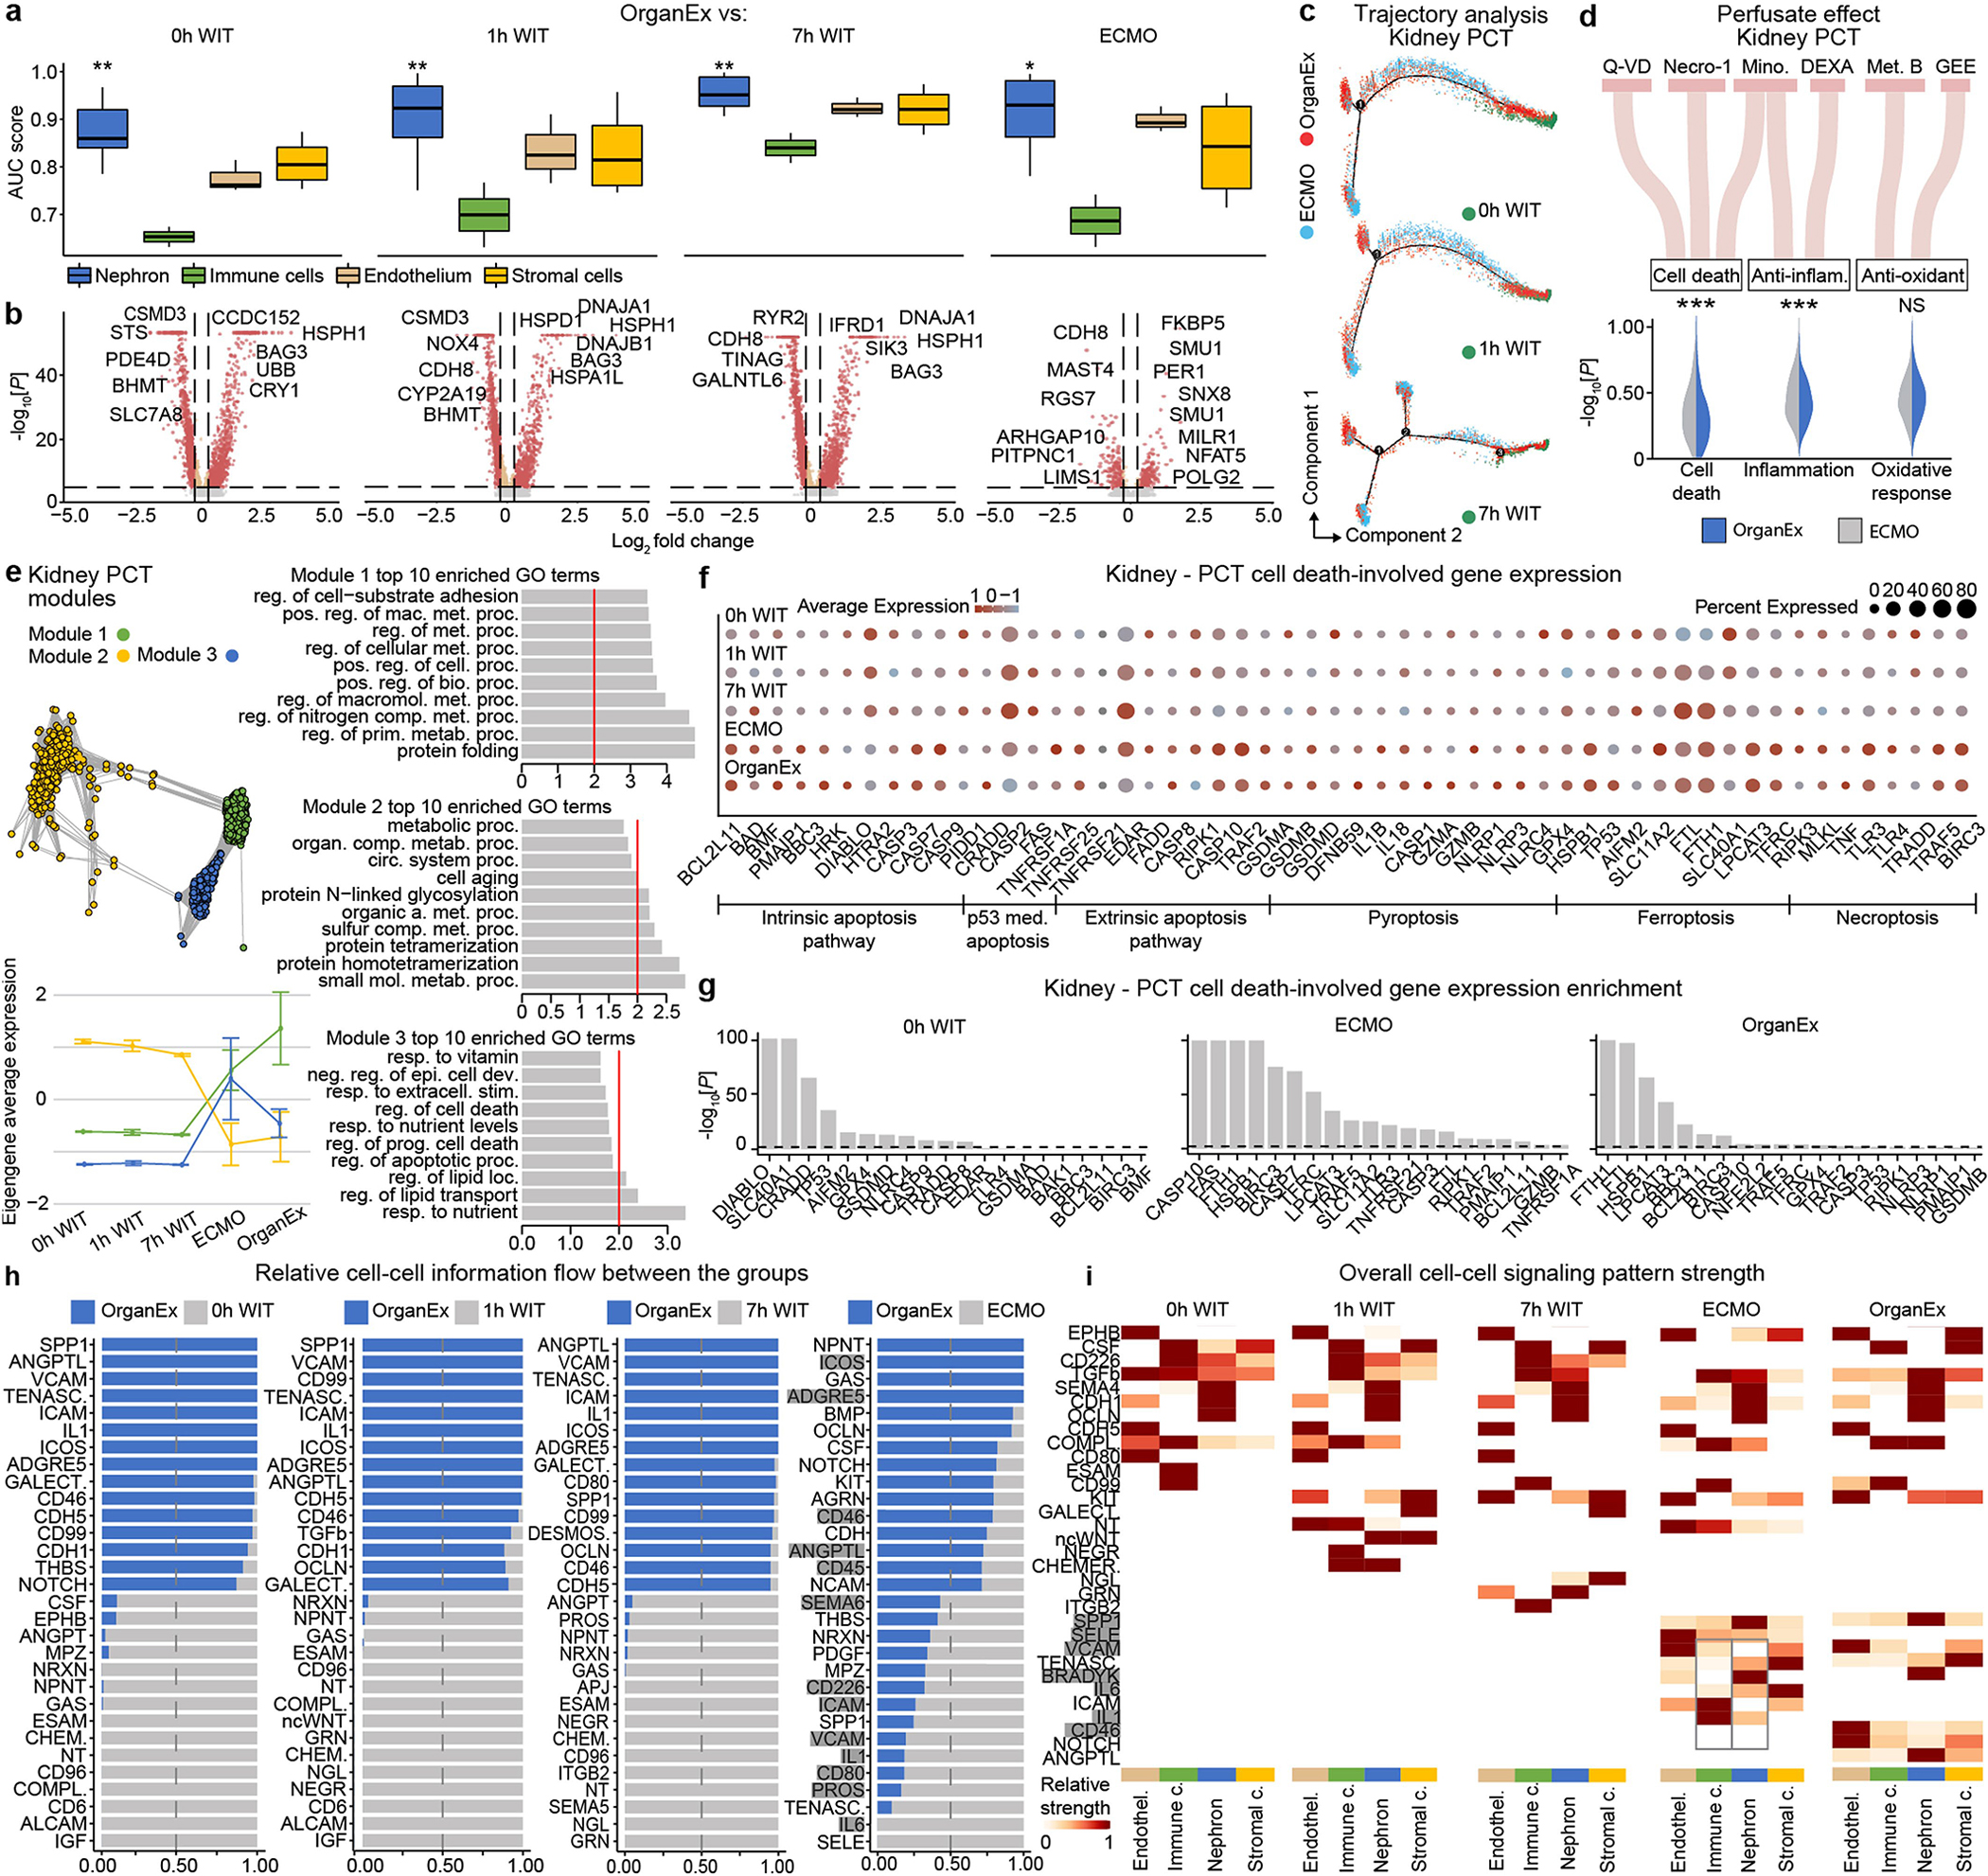
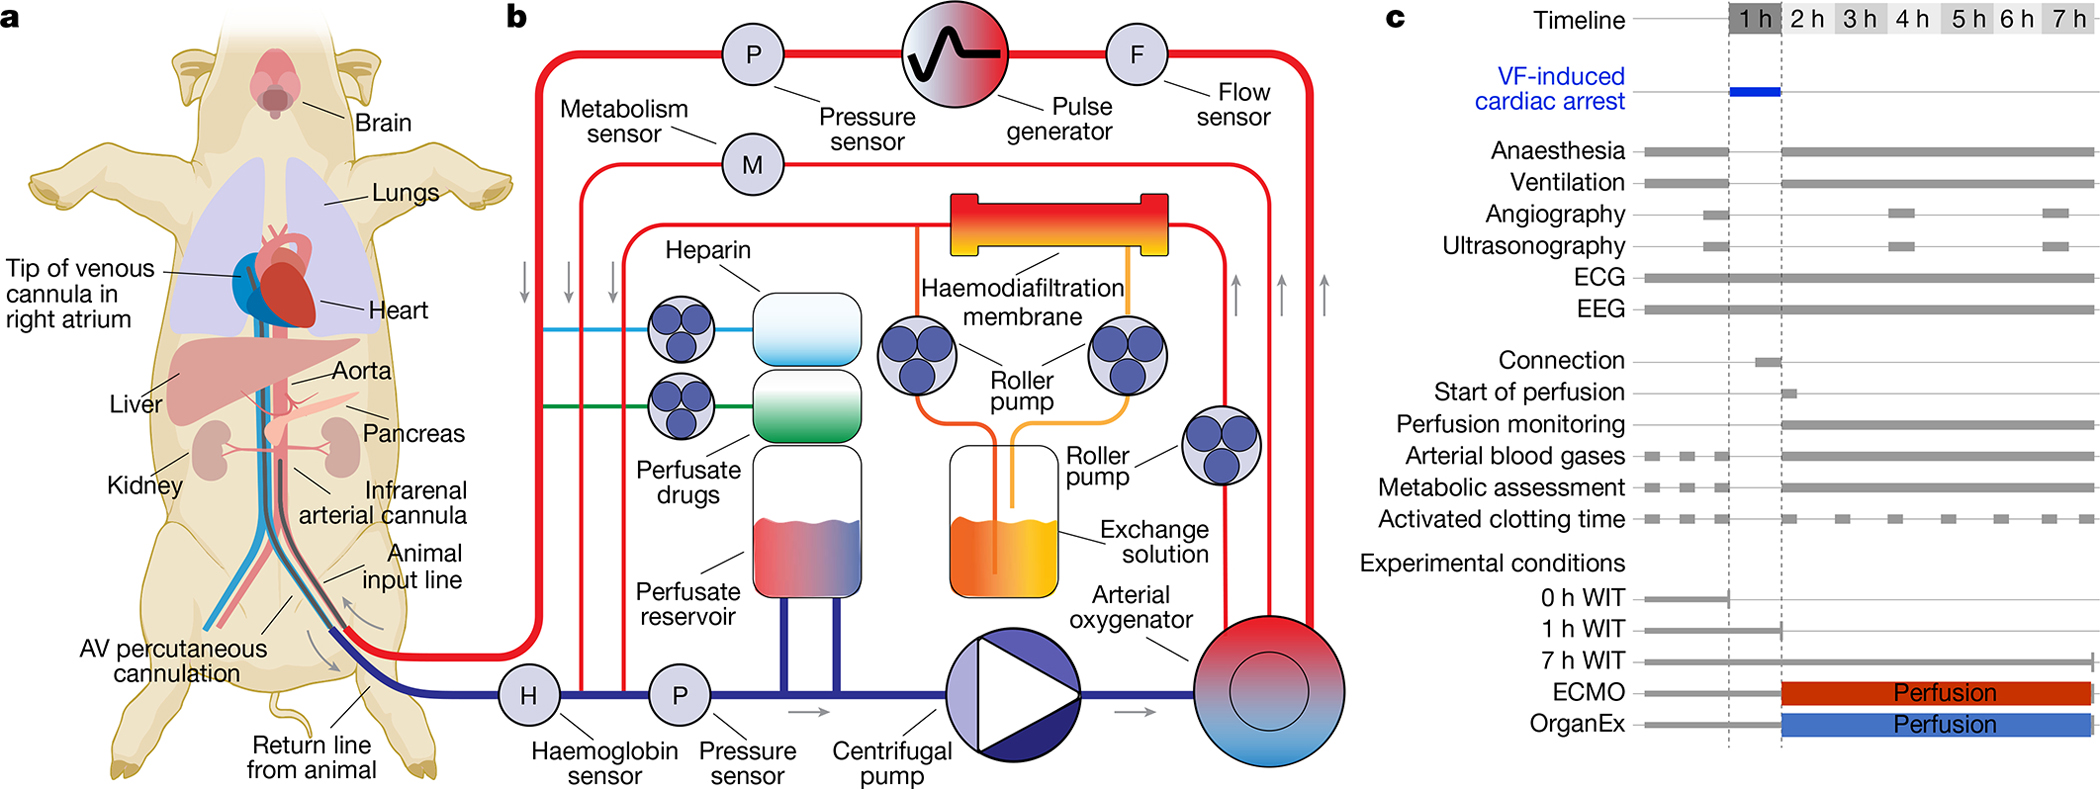
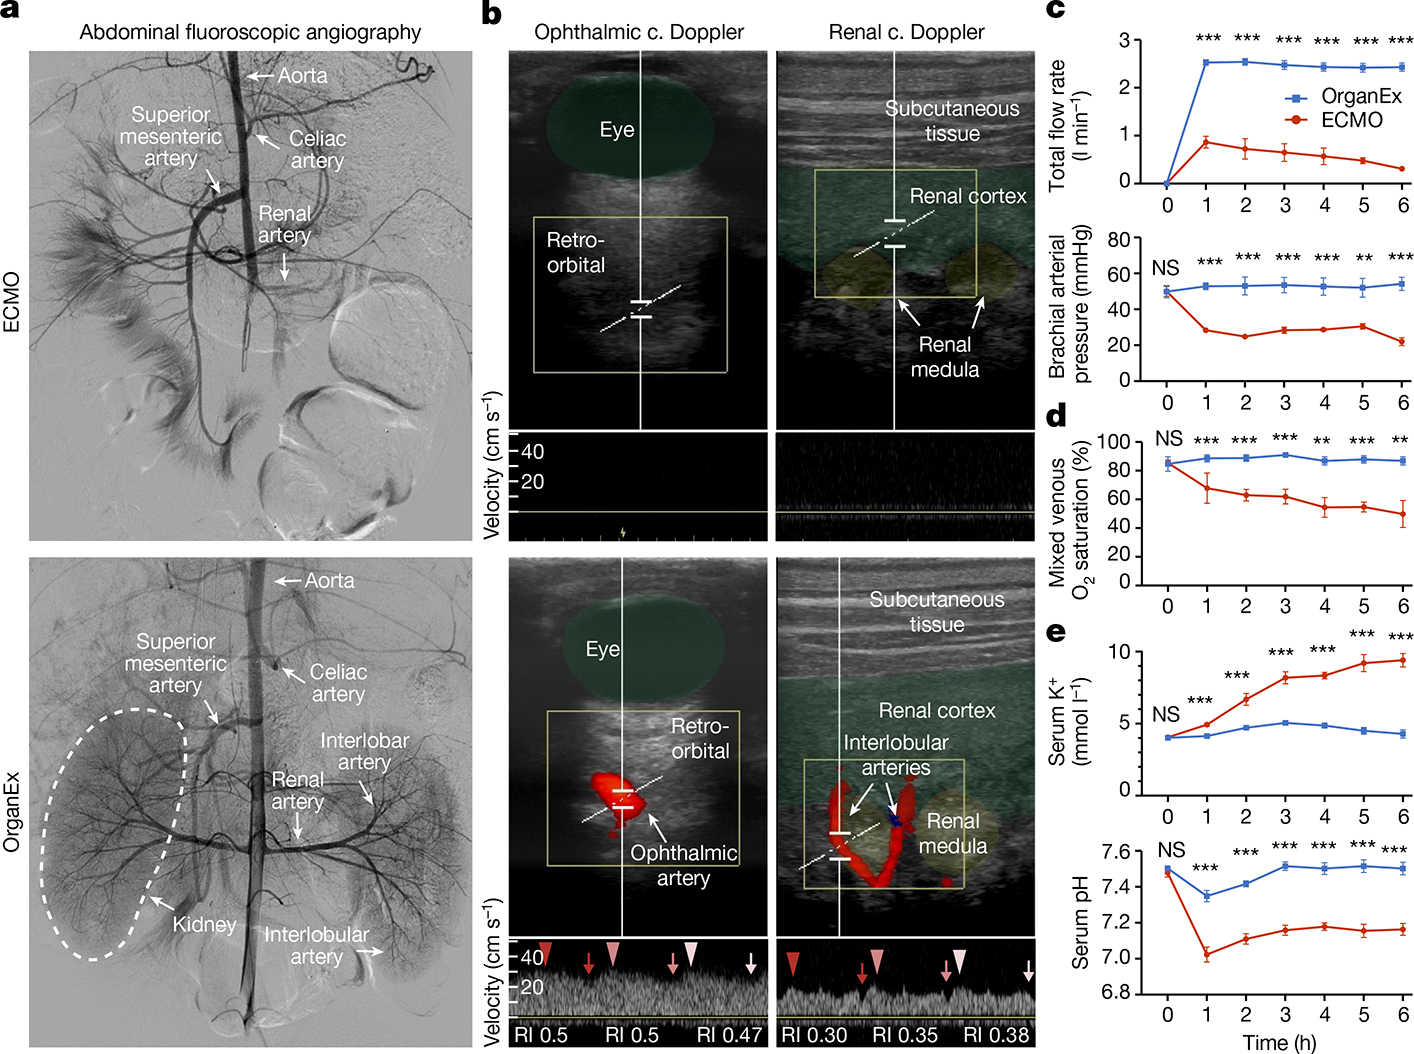
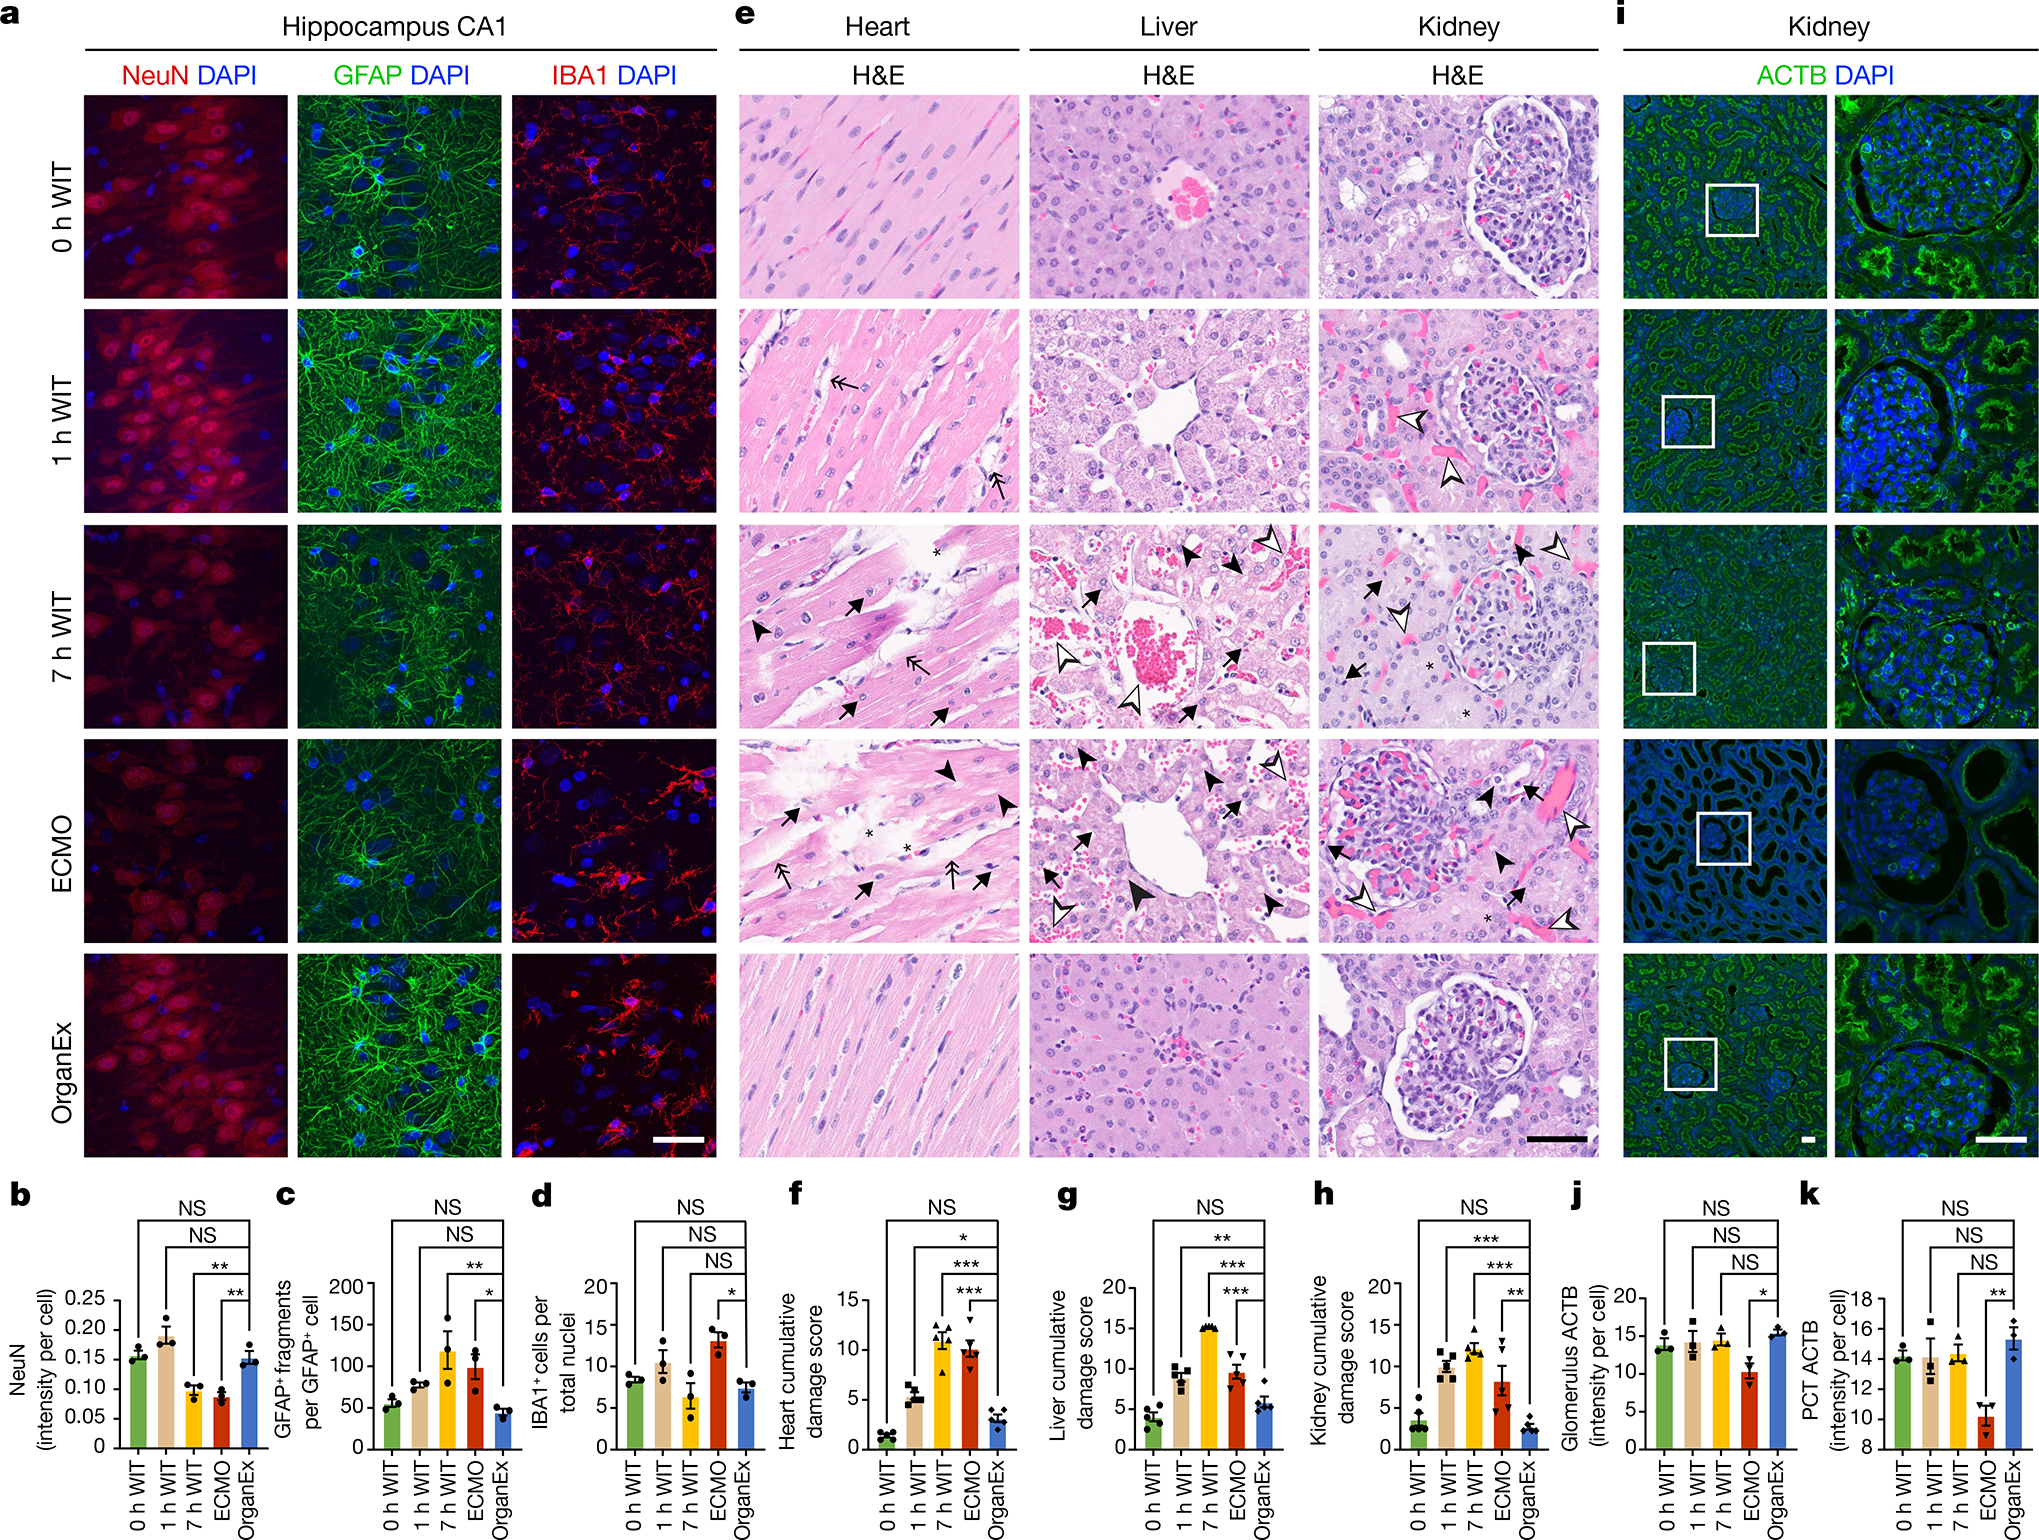
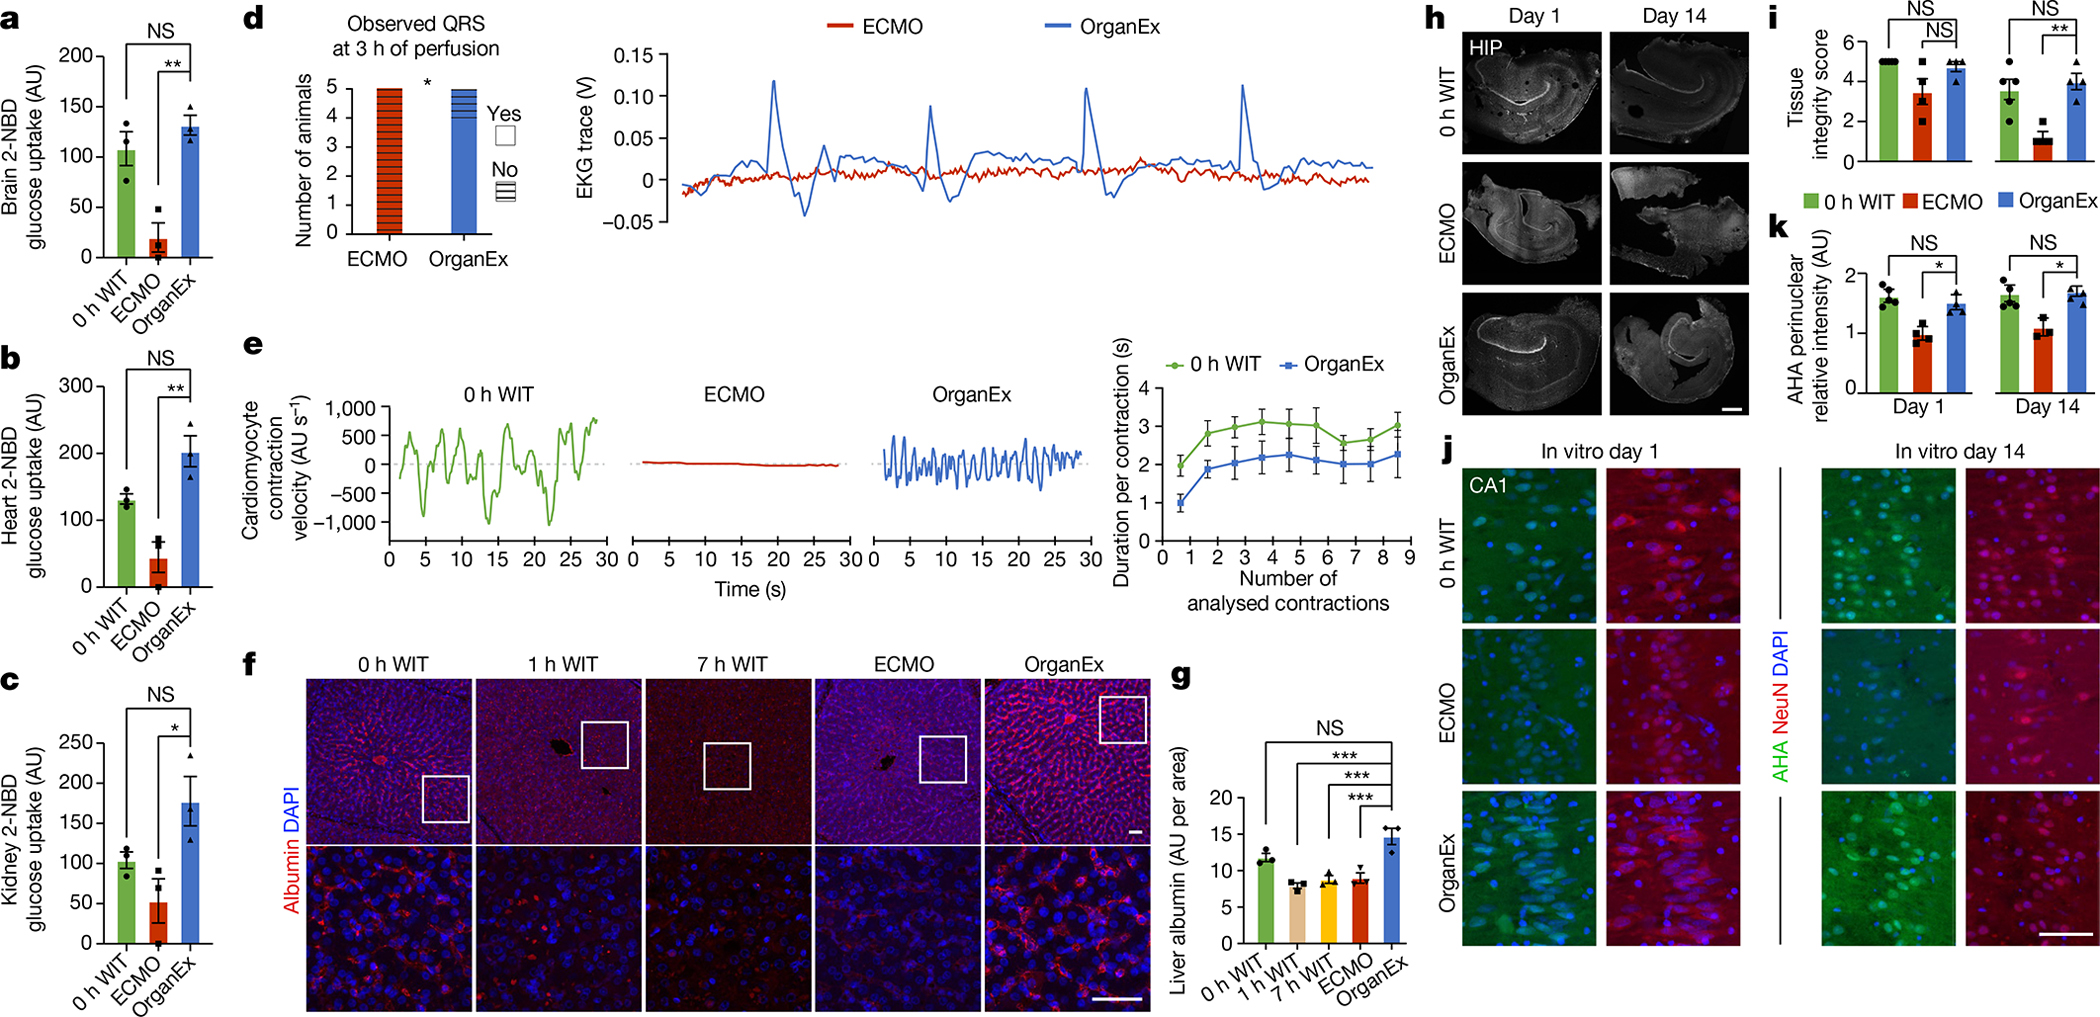
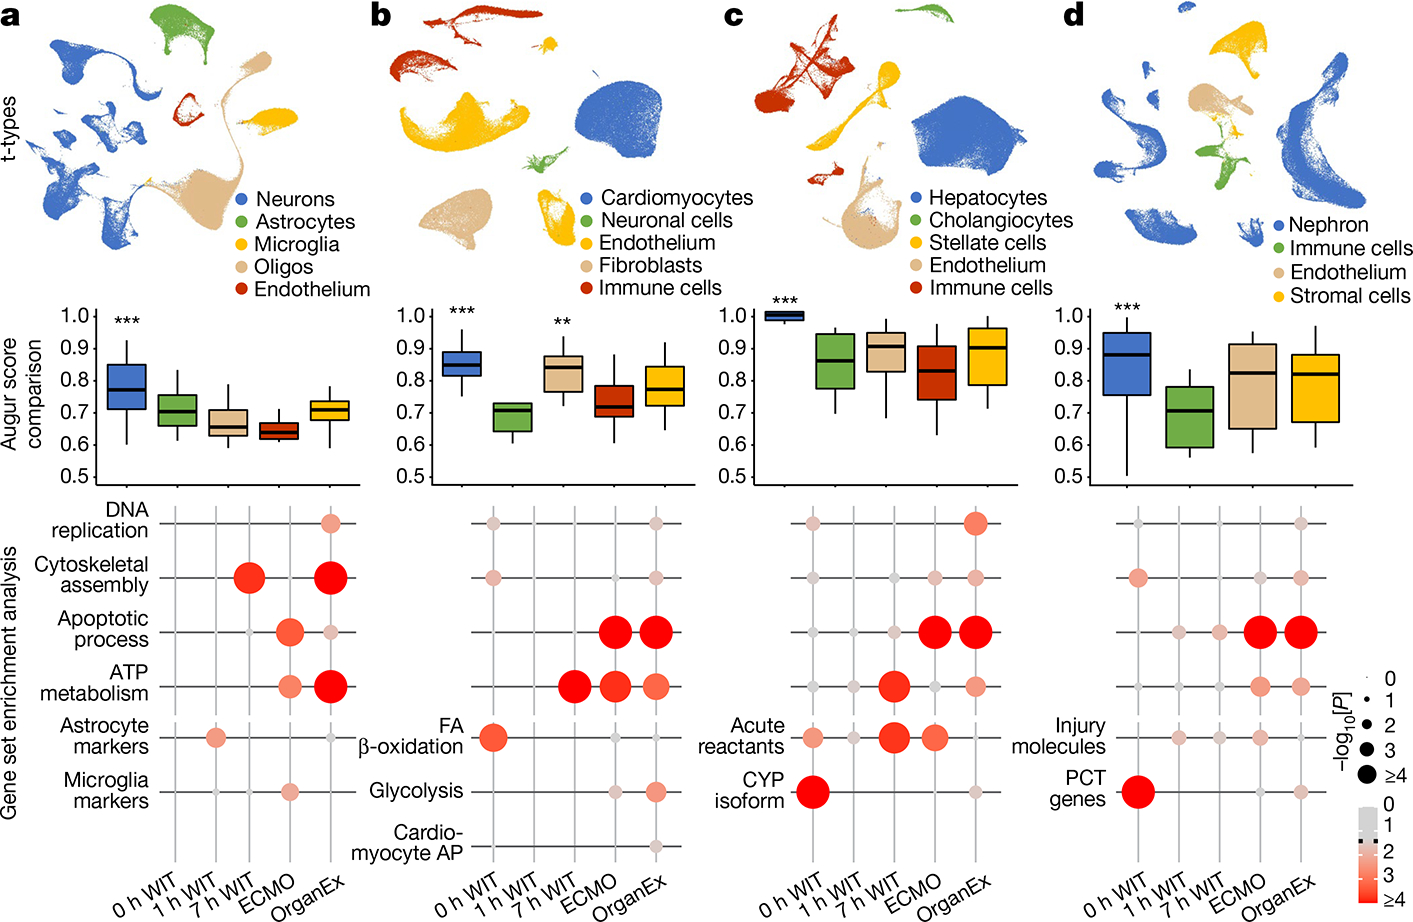
After cessation of blood flow or similar ischaemic exposures, deleterious molecular cascades commence in mammalian cells, eventually leading to their death1,2. Yet with targeted interventions, these processes can be mitigated or reversed, even minutes or hours post mortem, as also reported in the isolated porcine brain using BrainEx technology3. To date, translating single-organ interventions to intact, whole-body applications remains hampered by circulatory and multisystem physiological challenges. Here we describe OrganEx, an adaptation of the BrainEx extracorporeal pulsatile-perfusion system and cytoprotective perfusate for porcine whole-body settings. After 1 h of warm ischaemia, OrganEx application preserved tissue integrity, decreased cell death and restored selected molecular and cellular processes across multiple vital organs. Commensurately, single-nucleus transcriptomic analysis revealed organ- and cell-type-specific gene expression patterns that are reflective of specific molecular and cellular repair processes. Our analysis comprises a comprehensive resource of cell-type-specific changes during defined ischaemic intervals and perfusion interventions spanning multiple organs, and it reveals an underappreciated potential for cellular recovery after prolonged whole-body warm ischaemia in a large mammal.


Conflict of interest statement

Competing interests D.A., Z.V. and N.S. have disclosed these findings to the Yale Office of Cooperative Research, which has filed a patent to ensure broad use of the technology. All protocols, methods, perfusate formulations and components of the OrganEx technology remain freely available for academic and non-profit research. Although the Hemopure product was provided in accordance with a material transfer agreement between HbO2 Therapeutics and Yale University through N.S., the Company had no influence on the study design or interpretation of the results. No author has a financial stake in, or receives compensation from, HbO2 Therapeutics.

Figures

Extended Data Fig. 1 |
Extended Data Fig. 1 |. Analysis of circulation and blood/perfusate properties after 1h of warm ischaemia and perfusion interventions.
a, Representative fluoroscopy images of autologous blood flow (ECMO intervention, up) or a mixture of autologous blood and the perfusate (OrganEx intervention, below) in the head captured after 3 and 6 h respectively of perfusion, showing robust restoration of the circulation in the OrganEx group. A contrast catheter was placed in the left common carotid artery (CCA), except in the ECMO group at 6 h timepoint where contrast catheter could not be advanced beyond aortic arch in to the left CCA due to pronounced vasoconstriction, thus resulting in bilateral CCA filling. n = 6. b, Representative colour Doppler images of the CCA demonstrating robust flow in OrganEx group. Ultrasound waveform analysis demonstrated that OrganEx produced pulsatile, biphasic flow pattern (lower panel). SCM, sternocleidomastoid muscle; RI, resistive index. n = 6. c, Longitudinal change in arterial and venous cannula pressures throughout the perfusion demonstrating robust perfusion in OrganEx group. d, Time-dependent changes in oxygen delivery and consumption demonstrating increased oxygen delivery and stable oxygen consumption over the perfusion period in OrganEx group. n = 6. e, Presence of classical signs of death (rigor and livor mortis) in ECMO as compared to OrganEx group at the experimental endpoint. Data presented are mean ± s.e.m. Two-tailed unpaired t-test was performed. For more detailed information on statistics and reproducibility, see methods. *P < 0.05, **P < 0.01, ***P < 0.001.
Extended Data Fig. 2 |
Extended Data Fig. 2 |. Nissl staining and immunohistochemical analysis of the hippocampal CA1 region and the prefrontal cortex (PFC).
a, Representative images of Nissl staining of the CA1 (up) and PFC (below). b, c, Quantification of the number of cells per standardized area (b) and percentage of ellipsoid cells per area (c) in the CA1 between the experimental groups. d, e, Quantification of the number of cells per standardized area (d) and percentage of ellipsoid cells per area (e) in the PFC between the experimental groups. n = 3. f, h, Representative confocal images of immunofluorescent staining for neurons (NeuN), astrocytes (GFAP), and microglia (IBA1) counterstained with DAPI nuclear stain in CA1 (f) and PFC (h). g, Quantification of GFAP immunoreactivity in hippocampal CA1 region depicting comparable immunoreactivity between OrganEx and 0h WIT group, with a significant increase compared to the other groups. i, j, k, l, Quantification of NeuN immunolabeling intensity (i), number of GFAP+ fragments (j), and number of GFAP+ cells (k) depict similar trends between the groups as seen in the CA1. Microglia number (l) shows comparable results between OrganEx and 0h WIT with different dynamics seen in the ECMO group. n = 3. Scale bars, 50 μm. Data presented are mean ± s.e.m. One-way ANOVA with post-hoc Dunnett’s adjustments was performed. For more detailed information on statistics and reproducibility, see methods. *P < 0.05, **P < 0.01, ***P < 0.001.
Extended Data Fig. 3 |
Extended Data Fig. 3 |. Representative images of H&E staining across assessed peripheral organs and kidney periodic acid-Schiff (PAS) staining and immunolabeling for HACVR1 and Ki-67.
a, Representative images of the H&E staining in heart, kidney, liver, lungs, and pancreas. Arrows point to nuclear damage, asterisks point to disrupted tissue integrity, empty arrowheads point to haemorrhage, full arrowheads point to cell vacuolization, double arrows point to tissue oedema. b, c, H&E histopathological scores in lungs (b) and pancreas (c). d, Representative images of PAS staining of the kidney. Arrows point to disrupted brush border, full arrowheads point to the presence of casts, asterisks point to tubular dilation, double arrows point to the Bowman space dilation. e, Kidney PAS histopathological damage score. n = 5. f, h, Representative confocal images of immunofluorescent staining for HAVCR1 and Ki-67 in kidney, respectively. g, Quantification of HAVCR1 immunolabeling signal intensity. i, j, Quantification of the kidney Ki-67 positive staining. HACVR1 and Ki-67 immunolabeling quantification results follow a similar pattern seen with other organs with comparable results between 0h WIT and OrganEx group and significant decrease in the 7h WIT and ECMO groups. n = 3. Scale bars,100 μm. Data presented are mean ± s.e.m. One-way ANOVA with post-hoc Dunnett’s adjustments was performed. For more detailed information on statistics and reproducibility, see methods. *P < 0.05, **P < 0.01.
Extended Data Fig. 4 |
Extended Data Fig. 4 |. Analysis of cell death across experimental conditions and organs.
a, f, k, n, Representative confocal images of immunofluorescent staining for activated caspase 3 (actCASP3) and TUNEL assay in heart, liver, kidney, pancreas and brain. b-e, Quantification of actCASP3 immunolabeling signal intensity in heart (b), liver (c), kidney (d), and pancreas (e). n = 3. g-j, Normalized total intensity of TUNEL signal in heart (g), liver (h), kidney (i), and pancreas (j). n = 3. l, m, Percentage of actCASP3 positively stained nuclei in the CA1 (l) and PFC (m). n = 5. o, p, Normalized total intensity of TUNEL signal in CA1 (o) and PFC (p). n = 5. Scale bars, 50 μm. Data presented are mean ± s.e.m. One-way ANOVA with post-hoc Dunnett’s adjustments was performed. For more detailed information on statistics and reproducibility, see methods. *P < 0.05, **P < 0.01, ***P < 0.001.
Extended Data Fig. 5 |
Extended Data Fig. 5 |. Evaluation of different cell death pathways by immunohistochemical staining for important molecules in pyroptosis (IL-1B), necroptosis (RIPK3) and ferroptosis (GPX4) across the experimental conditions.
a, f, k, Representative confocal images of immunofluorescent staining for pyroptosis marker IL-1B, necroptosis marker RIPK3, and ferroptosis marker GPX4, each co-stained with DAPI nuclear stain in CA1, heart, liver, and kidney. b-e, Quantification of IL-1B immunolabeling signal intensity in CA1 (b), heart (c), liver (d), and kidney (e). n = 3. g-j, Quantification of RIPK3 positive intranuclear co-staining in CA1 (g), and immunolabeling signal intensity heart (h), liver (i), kidney (j). n = 3. l-o, Quantification of GPX4 immunolabeling signal intensity in CA1 (l), heart (m), liver (n), and kidney (o). n = 3. Scale bars, 50 μm left and right panels. Data presented are mean ± s.e.m. One-way ANOVA with post-hoc Dunnett’s adjustments was performed. For more detailed information on statistics and reproducibility, see methods. *P < 0.05, **P < 0.01, ***P < 0.001. IN, intranuclear.
Extended Data Fig. 6 |
Extended Data Fig. 6 |. EEG setup and recordings, click-iT chemistry and immunohistochemical analysis of factor V and troponin I.
a, Placement of EEG electrodes on the porcine scalp. b, Representative snapshot of the EEG recordings after administration of anaesthesia and before the induction of cardiac arrest by ventricular fibrillation. c, Representative snapshot of the EEG recordings immediately following the ventricular fibrillation. d, Representative snapshot of the EEG during ECMO intervention at around 2h of perfusion protocol. e, Representative snapshot of the EEG during OrganEx intervention at around 2h of perfusion protocol, showing a light pulsatile artefact. f, g, Representative snapshot of the EEG recordings following contrast injection at 3h in ECMO and OrganEx animals, respectively. OrganEx EEG snapshot is consistent with a possible muscle-movement artefact. GND, ground electrode; REF, reference electrode. h, i, Representative confocal images of AHA through Click-iT chemistry in newly synthesized proteins with DAPI nuclear stain in the long-term organotypic hippocampal slice culture in CA3 (h) and DG (i) subregions. j, k, Relative intensity of nascent protein around nuclei in hippocampal CA3 (j) and DG (k) region showing comparable protein synthesis between OrganEx and 0h WIT up to 14 days in culture. n = 3–5. l, Representative confocal images of immunofluorescent staining for troponin I in the heart. m, Quantification of troponin I immunolabeling signal intensity in heart. A decreased trend in immunolabeling intensity was observed with ischaemia time and a significant decrease in immunolabeling intensity in ECMO compared to the OrganEx group. n = 3. n, Representative confocal images of immunofluorescent staining for factor V in liver. o, Quantification of factor V immunolabeling signal intensity in liver follows a similar pattern seen with other organs with comparable results between 0h WIT, 1h WIT, and OrganEx group and a significant decrease in 7h WIT and ECMO groups. n = 3. Scale bars, 50 μm. Data presented are mean ± s.e.m. For more detailed information on statistics and reproducibility, see methods. *P < 0.05, **P < 0.01. AU, arbitrary units.
Extended Data Fig. 7 |
Extended Data Fig. 7 |. Quality control of snRNA-seq data in healthy and varying ischaemic conditions in the hippocampus, heart, liver, and kidney.
Through transcriptomic integration and iterative clustering, we generated a taxonomy of t-types in healthy organs and brain, heart, liver, and kidney that experienced ischaemia (1h WIT, 7h WIT, ECMO and OrganEx), representing presumptive major cell types across organs of interest. These major t-types were further subdivided into high-resolution subclusters that were transcriptomically comparable to publicly available human single-cell datasets and that were marked by distinct expression profiles (c-f). a, Bar plot showing the number of cells/nuclei across organs and biological replicates. b, Violin plot showing the distribution of the number of unique molecular identifiers – UMIs (upper panel) and genes (lower panel) detected across all biological replicates. c-f, respective analyses of snRNA-seq in the hippocampus (c), heart (d), liver (e), and kidney (f). The left upper corner depicts detailed UMAP layout showing all t-types in the respective organs. The right side depicts the expression of top t-type markers. The left lower corner depicts transcriptomic correlation between the t-type taxonomy defined in this study and that of previous human and mouse datasets. c., cells; LSECs, liver sinusoidal endothelial cells; end., endothelium; prog., progenitor; perit., peritubular; TAL, thick ascending limb; dend., dendritic; CNT, connecting tubule.
Extended Data Fig. 8 |
Extended Data Fig. 8 |. Single-nucleus transcriptome analysis in healthy and varying ischaemic conditions in the hippocampus, heart, liver, and kidney.
a-d, From left to right: UMAP layout showing major t-types; UMAP layout, coloured by Augur cell type prioritization (AUC) between 0h WIT compared to 1h (up) and 7h WIT (down); statistical comparison of Augur AUC scores between 0h WIT and 1h (up) and 7h (down) of WIT; Volcano plot showing top DEGs in major annotated t-types between 0h and 1h WIT (up), or 0h and 7h WIT (down); GO terms associated with the genes up and downregulated in detected nuclei between 0h and 1h WIT (up), or 0h and 7h WIT (down) with their nominal P-value in respective major annotated t-types.
Extended Data Fig. 9 |
Extended Data Fig. 9 |. Hippocampal single-nucleus transcriptome analysis comparing OrganEx to other experimental conditions.
a, AUC scores of the Augur cell type prioritization between OrganEx and other groups. b, Volcano plot showing DEGs in hippocampal neurons between OrganEx and 0h WIT, 1h WIT, 7h WIT, and ECMO. c, Trajectories of hippocampal neurons. Colour indicates different experimental groups. d, Sankey plot showing perfusate components and violin plots showing their effects on hippocampal neurons between the OrganEx and ECMO groups. e, Hierarchical clustering of the top DEGs across experimental groups and derived functional gene modules (upper left). Eigengene average expression trends exhibit distinct trends between ECMO and OrganEx groups (lower left) of modules whose enriched GO terms are predominantly related to cellular function (right) (Supplementary Table 5). f, Expression of the genes involved in cell-death pathways in neurons. g, Gene expression enrichment of the genes involved in cell-death pathways in neurons. h, Stacked bar plot showing relative information flow for each signalling pa pathway across experimental group pairs. Significant signalling pathways were ranked based on differences in the overall information flow within the inferred networks between OrganEx and 0h WIT, 1h WIT, 7h WIT, and ECMO. Genes important in inflammation are highlighted grey. i, Overall signalling patterns across all experimental conditions. Genes important in inflammation are highlighted grey. Necro-1, necrostatin-1; Mino, minocycline; DEXA, dexamethasone; Met. B, methylene blue; GEE, Glutathione Ethyl Ester. *P < 0.05, **P < 0.01, ***P < 0.001, NS: not significant.
Extended Data Fig. 10 |
Extended Data Fig. 10 |. Heart single-nucleus transcriptome analysis comparing OrganEx to other experimental conditions.
a, AUC scores of the Augur cell type prioritization between OrganEx and other groups. b, Volcano plot showing the DEGs in cardiomyocytes between OrganEx and 0h WIT, 1h WIT, 7h WIT, and ECMO. c, Trajectories of heart cardiomyocytes. Colour indicates different experimental groups. d, Sankey plot showing perfusate components and violin plots showing their effects on cardiomyocytes between the OrganEx and ECMO groups. e, Hierarchical clustering of the top DEGs across experimental groups and derived functional gene modules (upper left). Eigengene average expression trends exhibit distinct trends between ECMO and OrganEx groups (lower left) of modules whose enriched GO terms are predominantly related to cellular function (right) (Supplementary Table 5). f, Expression of the genes involved in cell-death pathways in cardiomyocytes. g, Gene expression enrichment of the genes involved in cell-death pathways in cardiomyocytes. h, Stacked bar plot showing relative information flow for each signalling pathway across experimental group pairs. Significant signalling pathways were ranked based on differences in the overall information flow within the inferred networks between OrganEx and 0h WIT, 1h WIT, 7h WIT, and ECMO. Genes important in inflammation are highlighted grey. i, Overall signalling patterns across all experimental conditions. Genes important in inflammation are highlighted grey. Necro-1, necrostatin-1; Mino, minocycline; DEXA, dexamethasone; Met. B, methylene blue; GEE, Glutathione Ethyl Ester. *P < 0.05, **P < 0.01, ***P < 0.001, NS: not significant.
Extended Data Fig. 11 |
Extended Data Fig. 11 |. Liver single-nucleus transcriptome analysis comparing OrganEx to other experimental conditions.
a, AUC scores of the Augur cell type prioritization between OrganEx and other groups. b, Volcano plot showing DEGs in hepatocytes between OrganEx and 0h WIT, 1h WIT, 7h WIT, and ECMO. c, Trajectories of liver hepatocytes. Colour indicates different experimental groups. d, Sankey plot showing perfusate components and violin plots showing their effects on hepatocytes between the OrganEx and ECMO. e, Hierarchical clustering of the top DEGs across experimental groups and derived functional gene modules (upper left). Eigengene average expression trends exhibit distinct trends between ECMO and OrganEx groups (lower left) of modules whose enriched GO terms are predominantly related to cellular function or cell death (right) (Supplementary Table 5). f, Expression of the genes involved in cell-death pathways in hepatocytes. g, Gene expression enrichment of the genes involved in cell-death pathways in hepatocytes. h, Stacked bar plot showing relative information flow for each signalling pathway across experimental group pairs. Significant signalling pathways were ranked based on differences in the overall information flow within the inferred networks between OrganEx and 0h WIT, 1h WIT, 7h WIT, and ECMO. Genes important in inflammation are highlighted grey. i, Overall signalling patterns across all experimental conditions. Genes important in inflammation are highlighted grey. Necro-1, necrostatin-1; Mino, minocycline; DEXA, dexamethasone; Met. B, methylene blue; GEE, Glutathione Ethyl Ester. DEXA, dexamethasone; Met. B, methylene blue; GEE, Glutathione Ethyl Ester. *P < 0.05, **P < 0.01, ***P < 0.001, NS: not significant.
Extended Data Fig. 12 |
Extended Data Fig. 12 |. Kidney single-nucleus transcriptome analysis comparing OrganEx to other experimental conditions.
a, AUC scores of the Augur cell type prioritization between OrganEx and other groups. b, Volcano plot showing DEGs in PCT between OrganEx and 0h WIT, 1h WIT, 7h WIT, and ECMO. c, Trajectories of kidney PCTs. Colour indicates pseudotime progression and different cell states, respectively. d, Sankey plot showing perfusate components and violin plots showing their effects on PCT between the OrganEx and ECMO groups. e, Hierarchical clustering of the top DEGs across experimental groups and derived functional gene modules (upper left). Eigengene average expression trends exhibit distinct trends between ECMO and OrganEx groups (lower left) of modules whose enriched GO terms are predominantly related to cellular function or cell death (right) (Supplementary Table 5). f, Expression of the genes involved in cell-death pathways in PCT. g, Gene expression enrichment of the genes involved in cell-death pathways in PCT. h, Stacked bar plot showing relative information flow for each signalling pathway across experimental group pairs. Significant signalling pathways were ranked based on differences in the overall information flow within the inferred networks between OrganEx and 0h WIT, 1h WIT, 7h WIT, and ECMO. Genes important in inflammation are highlighted grey. i, Overall signalling patterns across all experimental conditions. Genes important in inflammation are highlighted grey. PCT, proximal convoluted tubules; DCT, distal convoluted tubules; Necro-1, necrostatin-1; Mino, minocycline; DEXA, dexamethasone; Met. B, methylene blue; GEE, Glutathione Ethyl Ester. *P < 0.05, **P < 0.01, ***P < 0.001, NS: not significant.
Fig. 1 |
Fig. 1 |. Overview of the OrganEx technology and the experimental workflow.
a, Connection of the porcine body to the OrganEx perfusion system (or ECMO, not shown) through cannulation of the femoral artery and vein. b, Simplified schematic of the OrganEx perfusion device. The system is equipped with a centrifugal pump, pulse generator, haemodiafiltration, gas infusion, drug-delivery systems and sensors to measure metabolic and circulation parameters. c, Schematic of the experimental workflow and conditions. VF, ventricular fibrillation.
Fig. 2 |
Fig. 2 |. Circulation and blood/perfusate properties during the perfusion protocols.
a,b, Representative images of abdominal fluoroscopy (a; n = 9) and ophthalmic and renal ultrasound (b; n = 6) after 3 h of perfusion. ECMO is shown at the top and OrganEx is shown at the bottom. c., colour; RI, resistive index. ce, Changes in the total flow rate and brachial arterial pressure (c), the percentage of venous O2 saturation (d) and K+ concentration and pH in the serum (e) throughout the perfusion protocols. n = 6. For ce, data are mean ± s.e.m. Statistical analysis was performed using unpaired two-tailed t-tests; **P < 0.01, ***P < 0.001; NS, not significant. Further detailed information on statistics and reproducibility are provided in the Methods.
Fig. 3 |
Fig. 3 |. Analysis of tissue integrity across experimental conditions and organs.
a, Representative confocal images of immunofluorescence staining for neurons (NeuN), astrocytes (GFAP) and microglia (IBA1) counterstained with DAPI nuclear stain in the hippocampal CA1 region. bd, Quantification of NeuN immunoreactivity intensity (b), the number of GFAP fragments (c) and the microglia number (d) in the CA1. n = 3. e, Representative images of H&E staining in the heart, liver and kidneys. fh, Evaluation of histopathological criteria, including nuclear pyknosis (arrow), tissue integrity (asterisk), haemorrhage/congestion (empty arrowhead), cell vacuolization (full arrowhead) and tissue oedema (double arrow) in the heart (f), liver (g) and kidneys (h). n = 5. ik, Representative confocal images of immunofluorescence staining for ACTB in the kidneys (i) and its quantification in the glomerulus (j) and proximal convoluted tubule (PCT) (k). n = 3. Scale bars, 40 μm. For bd, fh, j and k, data are mean ± s.e.m. Statistical analysis was performed using one-way analysis of variance (ANOVA) with post hoc Dunnett adjustment; *P < 0.05, **P < 0.01, ***P < 0.001. Further detailed information on statistics and reproducibility are provided in the Methods.
Fig. 4
Fig. 4. Functional characterization and metabolic activity of selected organs.
| ac, Measurement of 2-NBDG uptake in the brain (a), heart (b) and kidney (c). n = 3. d, Observed QRS complexes in ECMO- and OrganEx-treated animals 3 h into the perfusion period (left). Statistical analysis was performed using χ2 tests. Right, representative EKG trances in the OrganEx and ECMO groups 3 h into the perfusion period. e, Measurement of cardiomyocyte contraction velocity in acute heart slices in the 0 h WIT, OrganEx and ECMO groups (left), and cardiomyocyte contraction duration (right). n = 5. f, Representative confocal images of immunolabelling for albumin in the liver. Scale bars, 50 μm. g, Measurement of normalized immunolabelling signal intensity of albumin in the liver demonstrating similar expression between the OrganEx and 0 h WIT groups. n = 3. h, Representative images of organotypic hippocampal slices after 1 and 14 days in culture. Scale bar, 500 μm. i, Quantification of hippocampal slice integrity. n = 4–5. j, Representative confocal images of newly synthesized proteins (AHA, Click-iT Chemistry) with DAPI counterstaining in the long-term organotypic hippocampal slice culture. Scale bar, 100 μm. k, Quantification of AHA relative intensity in the CA1. n = 3–5. For ac, g, i and k, data are mean ± s.e.m. Statistical analysis was performed using one-way ANOVA with post hoc Dunnett adjustment; *P < 0.05, **P < 0.01, ***P < 0.001. AU, arbitrary units. HIP, hippocampus.
Fig. 5 |
Fig. 5 |. Organ- and cell-type-specific transcriptomic changes assessed by snRNA-seq across various warm ischaemia intervals and different perfusion interventions.
ad, Uniform manifold approximation and projection (UMAP) layout showing major t-types in the hippocampus (a), heart (b), liver (c) and kidneys (d) (top). Middle, comparison of averaged Augur area under the curve (AUC) scores across the t-types indicating which cell type underwent the most transcriptomic changes. Bottom, P values of gene set enrichment of gene sets that are important in cellular recovery and specific cellular functions in major respective t-types. **P < 0.01, ***P < 0.001. FA, fatty acid.

Comment in

References

    1. Lee P, Chandel NS & Simon MC Cellular adaptation to hypoxia through hypoxia inducible factors and beyond. Nat. Rev. Mol. Cell Biol. 21, 268–283 (2020). - PMC - PubMed
    1. Daniele SG et al. Brain vulnerability and viability after ischaemia. Nat. Rev. Neurosci. 22, 553–572 (2021). - PubMed
    1. Vrselja Z et al. Restoration of brain circulation and cellular functions hours post-mortem. Nature 568, 336–343 (2019). - PMC - PubMed
    1. Hsia CC, Schmitz A, Lambertz M, Perry SF & Maina JN Evolution of air breathing: oxygen homeostasis and the transitions from water to land and sky. Compr. Physiol. 3, 849–915 (2013). - PMC - PubMed
    1. Eltzschig HK & Eckle T Ischemia and reperfusion-from mechanism to translation. Nat. Med. 17, 1391–1401 (2011). - PMC - PubMed