. 2022 Aug;608(7922):421-428.
doi: 10.1038/s41586-022-05030-3. Epub 2022 Aug 3.

Brown-fat-mediated tumour suppression by cold-altered global metabolism

Affiliations

Brown-fat-mediated tumour suppression by cold-altered global metabolism

Takahiro Seki et al. Nature. 2022 Aug.

Abstract

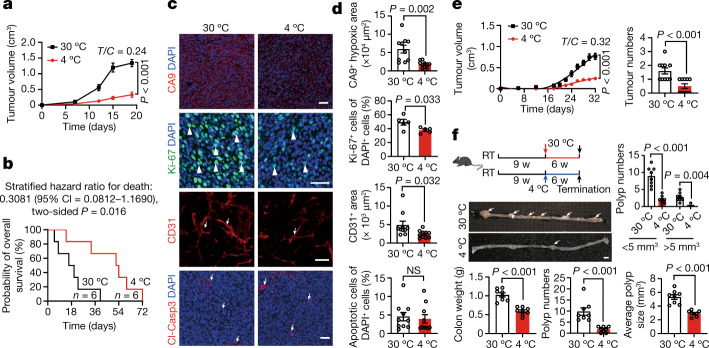
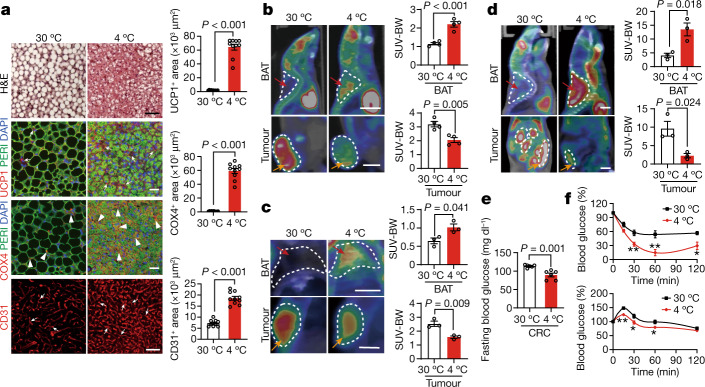
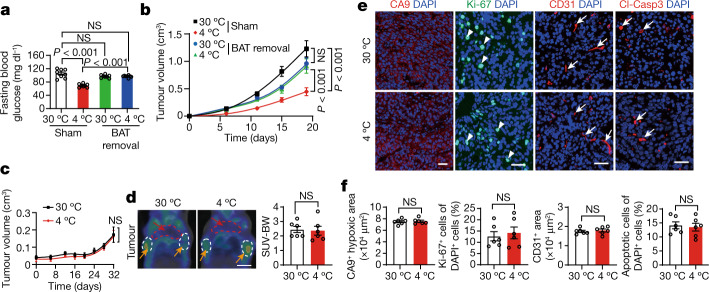
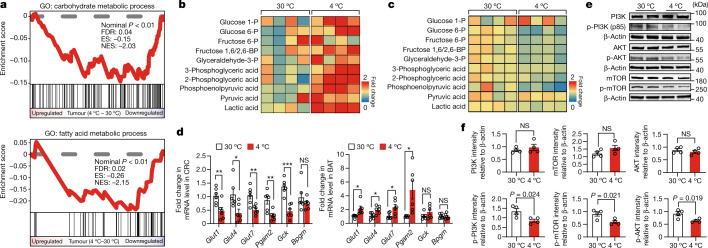
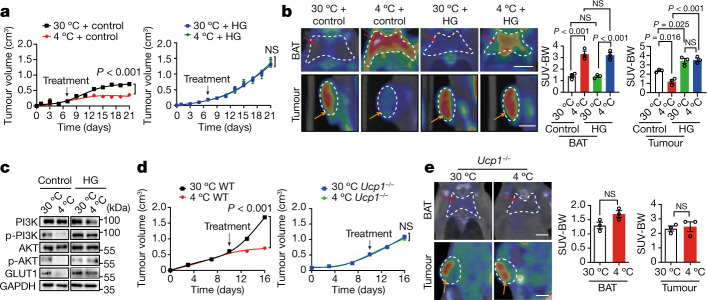
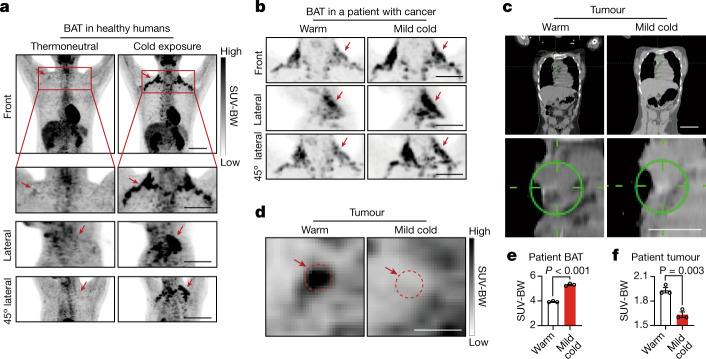
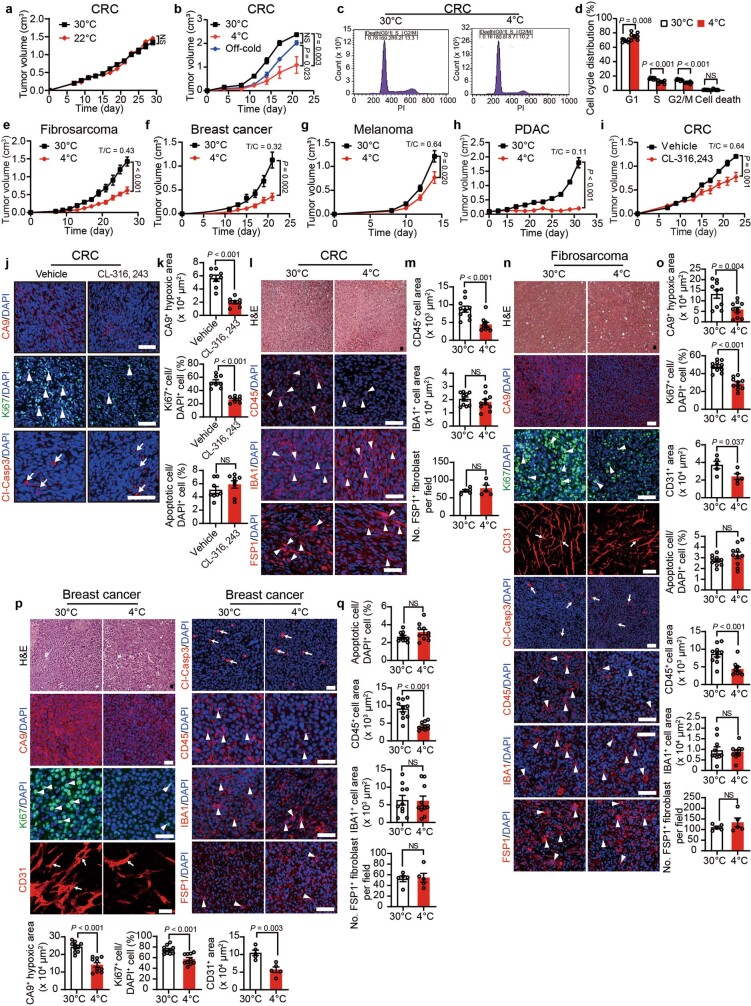
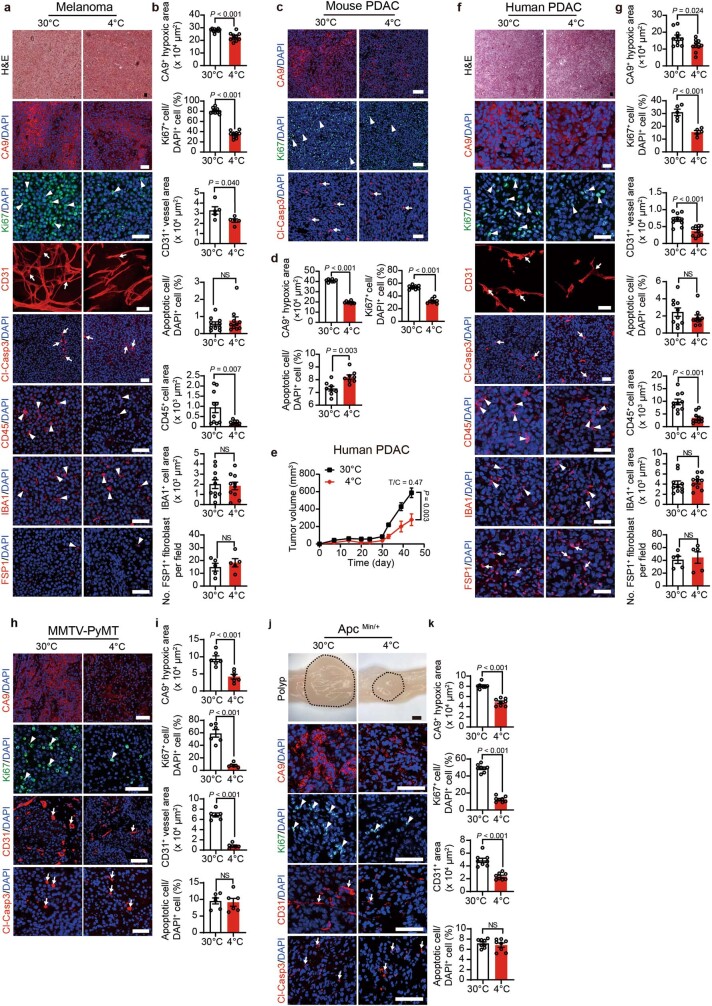
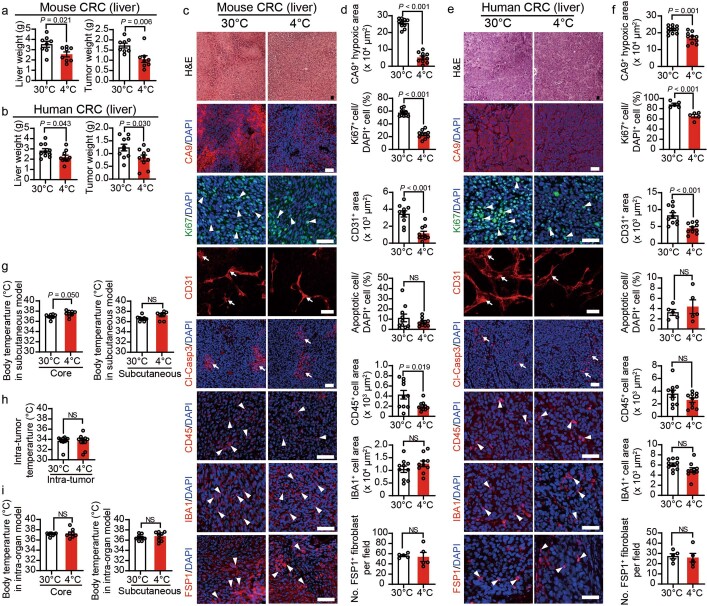
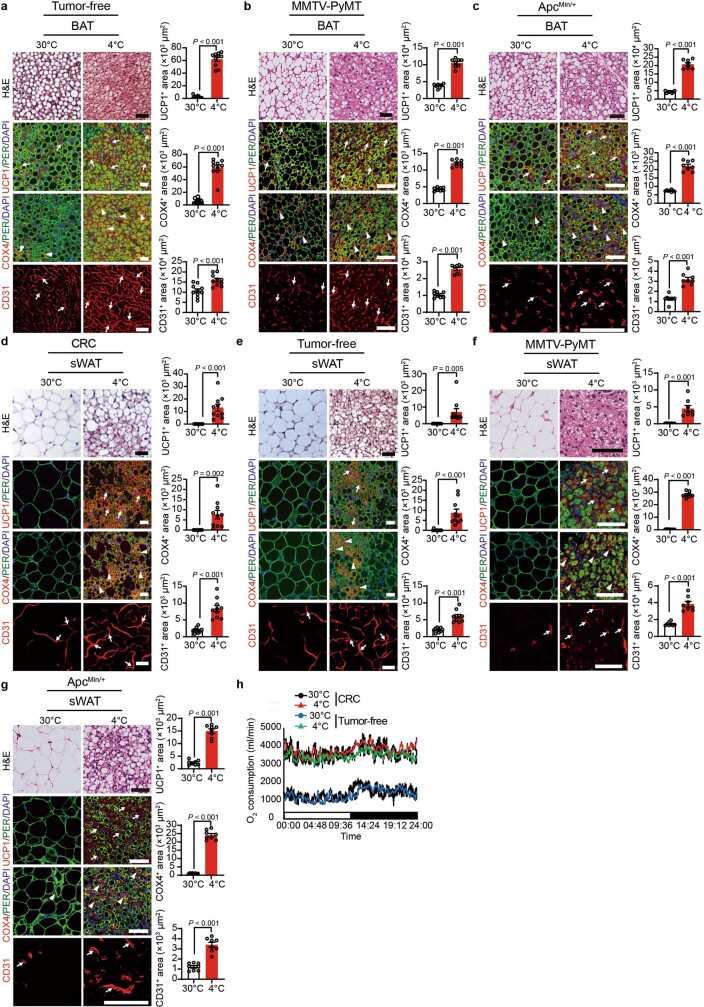
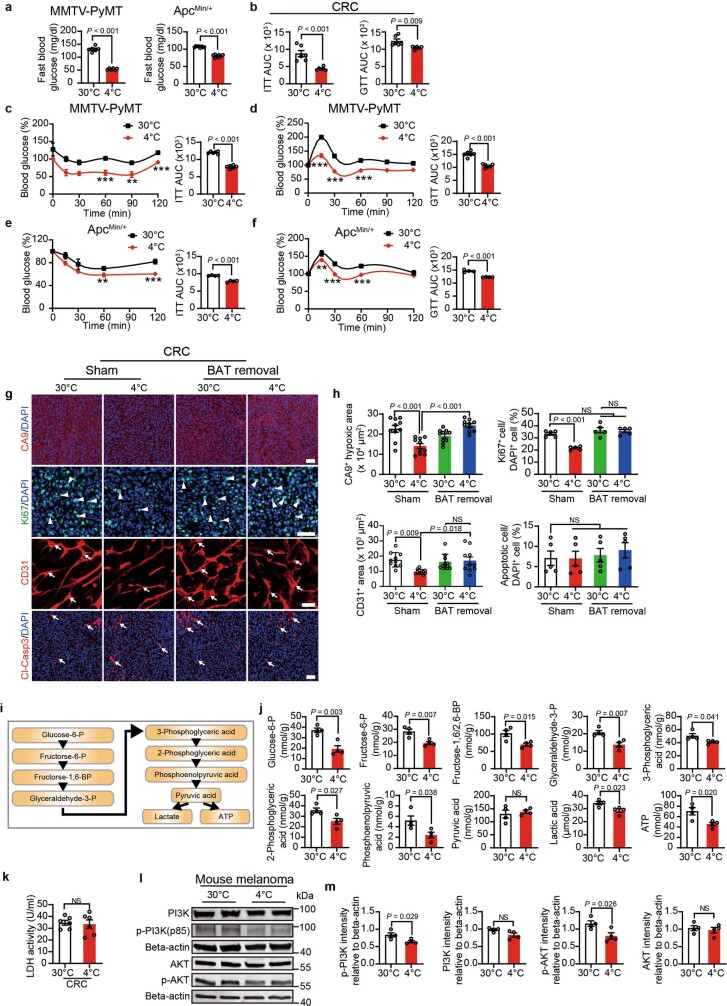
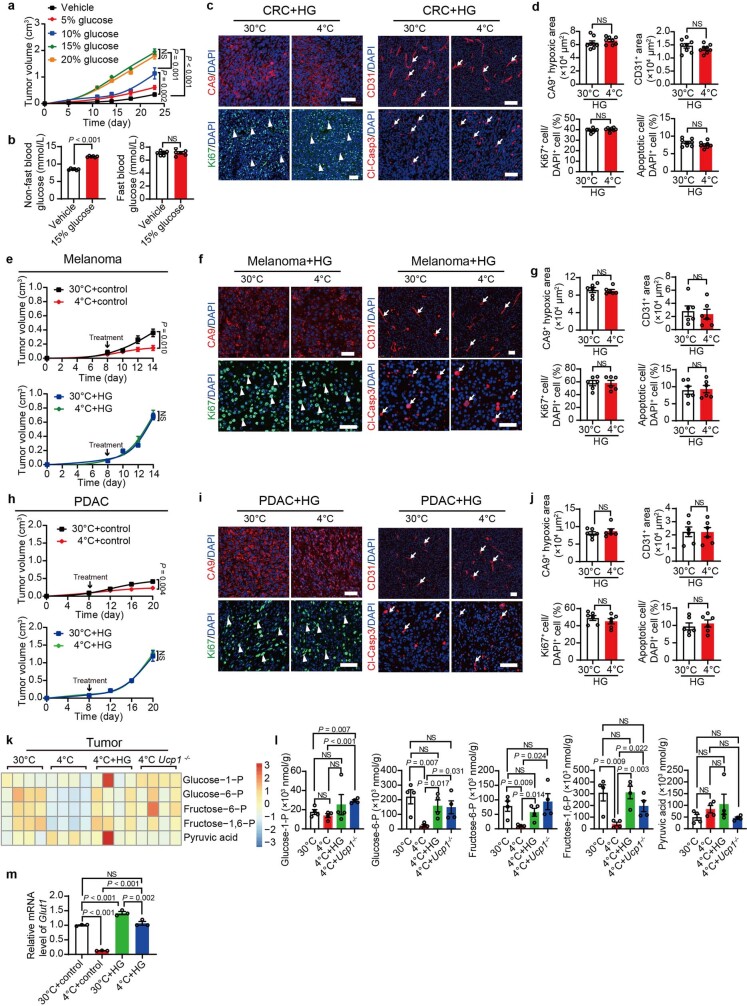
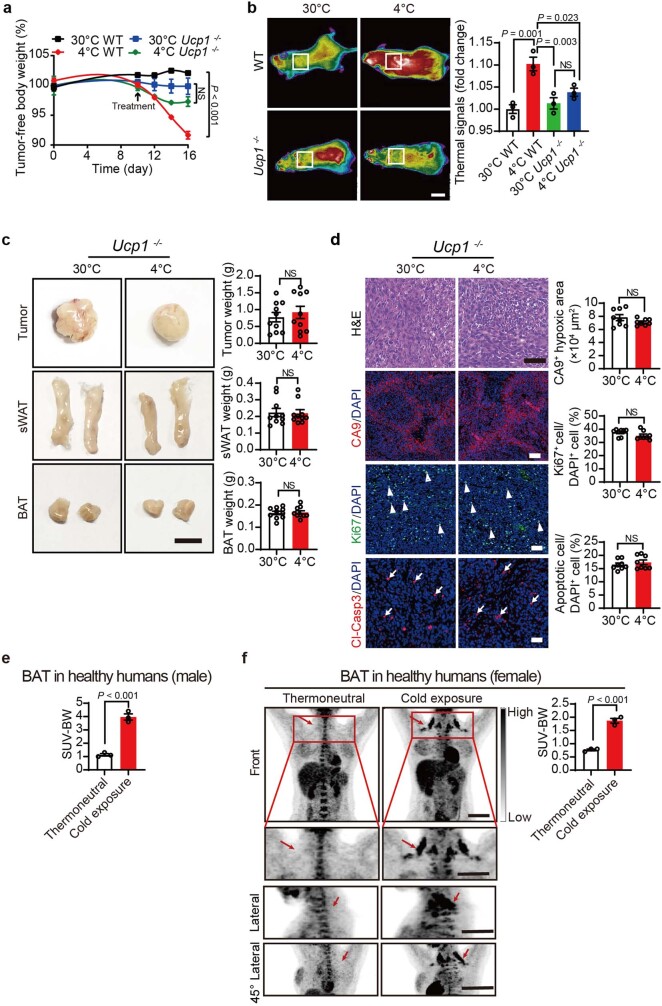
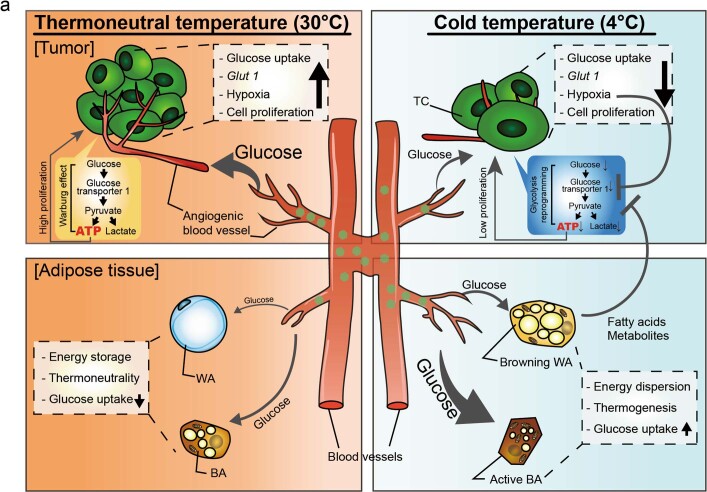
Glucose uptake is essential for cancer glycolysis and is involved in non-shivering thermogenesis of adipose tissues1-6. Most cancers use glycolysis to harness energy for their infinite growth, invasion and metastasis2,7,8. Activation of thermogenic metabolism in brown adipose tissue (BAT) by cold and drugs instigates blood glucose uptake in adipocytes4,5,9. However, the functional effects of the global metabolic changes associated with BAT activation on tumour growth are unclear. Here we show that exposure of tumour-bearing mice to cold conditions markedly inhibits the growth of various types of solid tumours, including clinically untreatable cancers such as pancreatic cancers. Mechanistically, cold-induced BAT activation substantially decreases blood glucose and impedes the glycolysis-based metabolism in cancer cells. The removal of BAT and feeding on a high-glucose diet under cold exposure restore tumour growth, and genetic deletion of Ucp1-the key mediator for BAT-thermogenesis-ablates the cold-triggered anticancer effect. In a pilot human study, mild cold exposure activates a substantial amount of BAT in both healthy humans and a patient with cancer with mitigated glucose uptake in the tumour tissue. These findings provide a previously undescribed concept and paradigm for cancer therapy that uses a simple and effective approach. We anticipate that cold exposure and activation of BAT through any other approach, such as drugs and devices either alone or in combination with other anticancer therapeutics, will provide a general approach for the effective treatment of various cancers.


Conflict of interest statement

The authors declare no competing interests.

Figures

Fig. 1
Fig. 1. Cold exposure suppresses xenograft and genetic spontaneous tumour growth, prolongs the overall survival of tumour-bearing mice and alters the TME.
a, Tumour growth of mouse CRC under 30 °C and 4 °C conditions. n = 8 mice per group. T/C = ratio of tumour growth in the treated group versus control group. b, Overall survival of CRC-tumour-bearing mice. n = 6 mice per group. c, Immunofluorescence staining of CRC tumours for CA9+ hypoxic area, Ki-67+ proliferating cells, CD31+ microvessels and cleaved caspase 3 (Cl-Casp3)+ apoptotic cells. The arrows and arrowheads indicate the respective positive signals. Tumour tissues were counterstained with 4′,6-diamidino-2-phenylindole (DAPI). Scale bars, 50 μm. d, Quantitative analysis of the positive signals shown in c. n = 5 or 10 random fields per group. e, Tumour growth rates and tumour incidences of spontaneous breast cancer in the MMTV-PyMT model under the 30 °C and 4 °C conditions. n = 10 mice per group. f, Experimental schematic, intestinal adenoma morphology, colon weights, polyp numbers, average polyp sizes and polyp size distribution in the Apcmin/+ model under the 30 °C and 4 °C conditions. n = 8 mice per group. The arrows indicate polyps. Scale bar, 5 mm. RT, room temperature; w, weeks. For a and d–f, data are mean ± s.e.m. For a and df, statistical analysis was performed using two-sided unpaired t-tests. NS, not significant. Source data
Fig. 2
Fig. 2. Adipose activation and glucose uptake in adipose tissues and tumours.
a, Histological and immunofluorescence staining of BAT for UCP1, perilipin, COX4 and CD31, followed by counterstaining with DAPI (blue) in CRC-tumour-bearing mice under the 30 °C and 4 °C conditions. The arrows and arrowheads indicate positive signals. Positive signals were randomly quantified. n = 10 random fields per group. Scale bars, 50 μm. bd, Representative PET–CT images of BATs and tumours and quantification of standardized uptake values (SUV) normalized to body weight (SUV-BW) of mice bearing mouse CRC tumours of similar tumour size (b), MMTV-PyMT mice with similar tumour size (c) and ApcMin/+ mice with similar age (d) under the 30 °C and 4 °C conditions. n = 4 (b) and n = 3 (c and d) mice per group. BATs and tumours are indicated by the red and orange arrows, respectively. For bd, scale bars, 5 mm. e, Fasting blood glucose concentrations of CRC-tumour-bearing mice under the 30 °C and 4 °C conditions. n = 6 mice per group. f, Insulin-tolerance test (top) and glucose-tolerance test (bottom) of CRC-tumour-bearing mice under the 30 °C and 4 °C conditions. n = 6 mice per group. For af, data are mean ± s.e.m. Statistical analysis was performed using two-sided unpaired t-tests (af). *P < 0.05, **P < 0.01. Exact P values are provided in the Source Data.Source Data Source data
Fig. 3
Fig. 3. Removal of BAT ablates cold-triggered tumour suppression.
a, Blood glucose levels of CRC-tumour-bearing mice after sham and BAT removal under 30 °C or 4 °C. n = 8 mice per group. b, CRC tumour growth rates in sham and BAT-removed mice under 30 °C or 4 °C conditions. n = 10 mice per group. c, Tumour growth curves of BAT-removed MMTV-PyMT mice under 30 °C and 4 °C conditions. n = 6 mice per group. d, Representative PET–CT images and quantification of SUV-BW of BAT-removed MMTV-PyMT mice under 30 °C or 4 °C conditions. n = 6 mice per group. Scale bar, 5 mm. e, Immunofluorescence staining of tumours grown in BAT-removed MMTV-PyMT mice with CA9+ hypoxic area, Ki-67+ proliferating cells, CD31+ microvessels and Cl-Casp3+ apoptotic cells. The arrows and arrowheads indicate the respective positive signals. Tumour tissues were counterstained with DAPI (blue). Scale bars, 50 μm. f, Quantification of positive signals of the markers presented in e. n = 6 random fields per group. For ad and f, data are mean ± s.e.m. Statistical analysis was performed using one-way analysis of variance (ANOVA) followed by Tukey multiple-comparison test (a and b) and two-sided unpaired t-tests (c, d and f). Source data
Fig. 4
Fig. 4. Metabolomic analysis of glycolysis and detection of PI3K signalling.
a, GSEA comparing the expression of carbohydrate metabolic process (top) and fatty acid metabolic process (bottom) of CRC samples exposed to 30 °C and 4 °C. n = 3 and 2 biological samples per group, respectively. b,c, Metabolomic heat-map analysis of glycolysis-related metabolites of BAT (b) and tumours (c) of CRC-tumour-bearing mice under 30 °C and 4 °C conditions. Each column represents a biological sample. n = 4 biological samples per group. d, Quantitative PCR (qPCR) analysis of Glut genes and glycolysis-related genes in CRC tumour tissues. n = 6 samples per group. e,f, Immunoblot analysis (e) and quantification (f) of non-phosphorylated and phosphorylated PI3K, AKT and mTOR in CRC tumours exposed to 30 °C and 4 °C. n = 4 biological samples per group. β-Actin was used for standardizing total protein loading levels. For d and f, data are mean ± s.e.m. Statistical analysis was performed using Wald tests (a) or two-sided unpaired t-tests (d and f); *P < 0.05, **P < 0.01, ***P < 0.001. Exact P values are provided in the Source Data.Source Data Source data
Fig. 5
Fig. 5. High-glucose feeding and UCP1 deficiency abrogate cold-induced tumour suppression.
a, Tumour growth rates of CRC-tumour-bearing mice treated with control vehicle (left) or 15% glucose (right) under 30 °C and 4 °C. n = 5 mice per group. b, Representative PET–CT images and quantification of SUV-BW of tumour-bearing mice with equal tumour size treated with vehicle or 15% glucose under 30 °C and 4 °C. n = 3 mice per group. Scale bars, 5 mm. c, Western blotting detection of non-phosphorylated and phosphorylated PI3K, AKT and GLUT1 of CRC treated with vehicle or 15% glucose under 30 °C or 4 °C. GAPDH was used for standardizing total protein loading levels. d, Tumour growth rates of CRC implanted in WT (left) and Ucp1−/− (right) mice under 30 °C and 4 °C conditions. n = 5 mice per group. e, PET–CT images of 18F-FDG uptake in the BAT and tumours of Ucp1−/− CRC-tumour-bearing mice under 30 °C and 4 °C conditions. Red arrows indicate BAT and orange arrows indicate tumours. Quantification of SUV-BW values of BAT and tumours. n = 3 mice per group. Scale bars, 5 mm. For a, b, d and e, data are mean ± s.e.m. Statistical analysis was performed using one-way ANOVA followed by Tukey multiple-comparison tests (b) or two-sided unpaired t-tests (a, d and e). HG, high glucose (15% glucose). Source data
Fig. 6
Fig. 6. Activation of BAT by exposure to mild cold in healthy individuals and a patient with cancer.
a, Representative PET images of 18F-FDG uptake in healthy male volunteers under thermoneutral (28 °C) and cold exposure (16 °C) conditions for 2 weeks. n = 3 individuals. Scale bars, 100 mm. b, Representative PET images of 18F-FDG uptake in the bilateral areas of supraclavicular, cervical and parasternal regions in a patient with Hodgkin’s lymphoma under warm and mild cold conditions. Scale bars, 100 mm. c, Representative images by CT scanning in the tumour region under warm conditions and exposure to mild cold. Scale bars, 100 mm (top) and 50 mm (bottom). d, PET images of 18F-FDG uptake of the tumour region under warm and mild cold conditions. Scale bars, 50 mm. Arrows indicate respective positive signals. e, Quantification of SUV-BW positive signals shown in b. n = 3 separate scans. f, Quantification of SUV-BW positive signals shown in d. n = 3 separate scans. For e and f, data are mean ± s.e.m. Statistical analysis was performed using two-sided unpaired t-tests (e and f). Source data
Extended Data Fig. 1
Extended Data Fig. 1. Reversible tumour suppression by off-cold and changes of tumour microenvironment by cold exposure.
a, b, Tumour growth of CRC under 30 °C and 22 °C (a), under 30 °C, 4 °C, and 4 °C for 11 days followed by switching to 30 °C for 10 days (b) (n = 8 mice per group in a and 5 mice per group in b). c, d, Representative FACS and quantification of CRC tumour cells under 30 °C and 4 °C for cell cycle analysis (n = 7 tumours per group). eh, Tumour growth of murine fibrosarcoma (e), murine breast cancer (f), murine melanoma (g), and murine pancreatic ductal adenocarcinoma (PDAC) (h) under 30 °C and 4 °C (n = 8 mice per group in e, g, h and 6 mice per group in f). i, Tumour growth of vehicle- and CL-316,243-treated CRC under 30 °C and 4 °C (n = 6 mice per group). j, k, Immunofluorescence staining and quantifications of CA9+ hypoxic area, Ki-67+ proliferating cells, Cl-Casp3+ apoptotic cells. Arrows and arrowheads point to positive signals. Tumour tissues were counterstained with DAPI (blue). lq, Immunofluorescence staining and quantifications of morphology (H&E), CA9+ hypoxic area, Ki-67+ proliferating cells, CD31+ microvessels, Cl-Casp3+ apoptotic cells, CD45+ inflammatory myeloid cells, IBA1+ pan-macrophages, and FSP1+ fibroblasts in CRC, fibrosarcoma, and breast cancer under 30 °C and 4 °C (n = 5 or 10 random fields per group). Arrows and arrowheads point to positive signals. All scale bars, 50 μm. Data presented as mean ± s.e.m. Statistical analysis was performed using one-way ANOVA followed by Tukey's multiple comparisons test (b), or two-sided unpaired t-test (a, d, ei, k, m, o, q). NS, not significant. Source data
Extended Data Fig. 2
Extended Data Fig. 2. Changes of the tumour microenvironment by cold in various tumour models.
ag, Immunofluorescence staining and quantifications of morphology (H&E), CA9+ hypoxic area, Ki-67+ proliferating cells, CD31+ microvessels, Cl-Casp3+ apoptotic cells, CD45+ inflammatory myeloid cells, IBA1+ pan-macrophages, and FSP1+ fibroblasts in melanoma (a, b), mouse PDAC (c, d), and human PDAC (f, g) under 30 °C and 4 °C (n = 5, 8, or 10 random fields per group). Arrows and arrowheads point to positive signals. Tumour growth of human PDAC (e) under 30 °C and 4 °C (n = 8 mice per group). hk, Immunofluorescence staining and quantifications of CA9+ hypoxic area, Ki-67+ proliferating cells, CD31+ microvessels, and Cl-Casp3+ apoptotic cells in MMTV-PyMT tumours (h, i), and ApcMin/+ polyps (j, k) under 30 °C and 4 °C (n = 6 or 8 random fields per group). Arrows and arrowheads point to positive signals. Scale bars in the upper panel of j, 1 mm. All other scale bars, 50 μm. Data presented as mean ± s.e.m. Statistical analysis was performed using two-sided unpaired t-test (b, d, e, g, i, k). NS, not significant. Source data
Extended Data Fig. 3
Extended Data Fig. 3. Cold exposure inhibits tumour growth in a liver tumour model.
a, Total liver (left) and tumour (right) weights of liver murine CRC tumour-bearing mice under 30 °C and 4 °C (n = 8 mice per group). b, Total liver (left) and tumour (right) weights of liver human CRC tumour-bearing immunodeficient mice under 30 °C and 4 °C (n = 10 mice per group). c-f, Immunofluorescence staining and quantifications of morphology (H&E), CA9+ hypoxic area, Ki-67+ proliferating cells, CD31+ microvessels, Cl-Casp3+ apoptotic cells, CD45+ inflammatory myeloid cells, IBA1+ pan-macrophages, and FSP1+ fibroblasts in liver murine CRC (c, d) and liver human CRC (e, f) under 30 °C and 4 °C (n = 5 or 10 random fields per group). Arrows and arrowheads point to positive signals. g, Core and subcutaneous body temperatures of murine CRC subcutaneous tumour-bearing mice under 30 °C and 4 °C (n = 8 mice per group). h, Intra-tumoral temperature of subcutaneous murine CRC tumours under 30 °C and 4 °C (n = 10 tumours per group). i, Core (left) and subcutaneous (right) body temperature of murine CRC tumour-bearing mice in the intra-liver implantation model under 30 °C or 4 °C (n = 8 mice per group). All scale bars, 50 μm. Data presented as mean ± s.e.m. Statistical analysis was performed using two-sided unpaired t-test (a, b, d, f, gi). NS, not significant. Source data
Extended Data Fig. 4
Extended Data Fig. 4. Browning of adipose tissues by cold in xenograft and genetically spontaneous tumour models.
ac, Histological and immunofluorescence staining of BAT in tumour-free mice (a), MMTV-PyMT tumour-bearing mice (b), and ApcMin/+ mice (c) under 30 °C and 4 °C with H&E, UCP1, perilipin, COX4, and CD31, followed by counterstaining with DAPI (blue). Positive signals were randomly quantified (n = 8 or 10 random fields per group). Arrows and arrowheads point to positive signals. dg, Histological and immunofluorescence staining of sWAT in CRC tumour-bearing mice (d), tumour-free mice (e), MMTV-PyMT tumour-bearing mice (f), and ApcMin/+ mice (g) under 30 °C and 4 °C with H&E, UCP1, perilipin, COX4, and CD31, followed by counterstaining with DAPI (blue). Positive signals were randomly quantified (n = 8 or 10 random fields per group). Arrows and arrowheads point to positive signals. h, Whole-body metabolism of CRC tumour-bearing and tumour-free mice under 30 °C and 4 °C (n = 3 mice per group). All scale bars, 50 μm. Data presented as mean ± s.e.m. Statistical analysis was performed using two-sided unpaired t-test (ag). Source data
Extended Data Fig. 5
Extended Data Fig. 5. Removal of BAT ablates tumour microenvironmental changes and the mitigation of PI3K activation in cold-exposed tumours.
a, Fasting blood glucose concentrations of MMTV-PyMT tumour-bearing mice and ApcMin/+ mice under 30 °C and 4 °C (n = 6 mice per group). bf, Insulin tolerance test and glucose tolerance test of CRC tumour-bearing mice (b), MMTV-PyMT tumour-bearing mice (c, d) and ApcMin/+ mice (e, f) under 30 °C and 4 °C (n = 6 mice per group in b-d and 4 mice per group in e, f). g, h, Immunofluorescence staining and quantifications of CA9+ hypoxic area, Ki-67+ proliferating cells, CD31+ microvessels, and Cl-Casp3+ apoptotic cells in sham-operated or BAT-removed CRC tumour-bearing mice under 30 °C and 4 °C (n = 5 or 10 random fields per group). Arrows and arrowheads point to positive signals. i, Schematic representation of the glycolysis pathway. j, Amounts of the glycolytic metabolites of CRC tumours under 30 °C and 4 °C (n = 4 biological samples per group). k, Quantification of LDH activity in CRC tumours under 30 °C and 4 °C (n = 6 tumours per group). l, m, Immunoblot analysis (l) and quantification (m) of non-phosphorylated and phosphorylated PI3K (p-PI3K) and AKT and phosphorylated AKT (p-AKT) in melanoma. Beta-actin was used for standardizing total protein loading levels (n = 4 biological samples per group). All scale bars, 50 μm. Data presented as mean ± s.e.m. Statistical analysis was performed using one-way ANOVA followed by Tukey’s multiple comparison tests (h) or two-sided unpaired t-test (af, j, k, m). NS, not significant; **P < 0.01; ***P < 0.001 (exact P values are presented in the source data). Source data
Extended Data Fig. 6
Extended Data Fig. 6. The impacts of high glucose feeding in glycolytic metabolism and tumour microenvironment.
a, Tumour growth in subcutaneous murine CRC-bearing mice fed with various doses of glucose (n = 6 mice per group). b, Blood glucose levels of fasting (left) and non-fasting (right) mice receiving vehicle and 15% glucose solution (n = 6 mice per group). c-j, Immunofluorescence staining and quantifications of CA9+ hypoxic area, Ki-67+ proliferating cells, CD31+ microvessels, and Cl-Casp3+ apoptotic cells in HG-treated CRC (c, d), HG-treated melanoma (f, g), and HG-treated PDAC (i, j) under 30 °C and 4 °C (n = 6 or 8 random fields per group). Arrows and arrowheads point to positive signals. Tumour growth rates of vehicle-fed and 15% glucose-treated melanoma (e) or PDAC (h) under 30 °C or 4 °C (n = 5 mice per group). k, Metabolomic heatmap analysis of glycolysis-related metabolites of vehicle- and HG-treated CRC tumours grown in WT or Ucp1−/− under 30 °C or 4 °C. l, Measurements of the amounts of glycolytic metabolites (n = 4 biological samples per group). m, qPCR analysis of Glut1 of vehicle- and HG-treated CRC under 30 °C or 4 °C (n = 3 samples per group). All scale bars, 50 μm. Data presented as mean ± s.e.m. Statistical analysis was performed using one-way ANOVA followed by Tukey multiple tests (a, m) or two-sided unpaired t-test (b, d, e, g, h, j, l). HG, high glucose (15% glucose); NS, not significant. Source data
Extended Data Fig. 7
Extended Data Fig. 7. The impacts of UCP1 deletion in tumour microenvironment and the activation of BAT in healthy humans.
a, Tumour-free bodyweights of CRC tumour-bearing WT and Ucp1−/− mice under 30 °C and 4 °C (n = 6 mice per group). b, Images of infrared thermography from anaesthetized WT and Ucp1−/− mice under 30 °C and 4 °C. Box points to BAT approximate location. Scale bar, 1 cm. Quantification of interscapular thermal signals of WT and Ucp1−/− mice under 30 °C and 4 °C (n = 3 mice per group). c, Morphology and weight of CRC tumours, sWAT, and BAT of tumour-bearing Ucp1−/− mice under 30 °C or 4 °C (n = 10 samples per group). Scale bar, 0.5 cm. d, Histological staining, immunofluorescence staining, and quantifications of CA9+ hypoxic area, Ki-67+ proliferating cells, and Cl-Casp3+ apoptotic cells in CRC tumour-bearing Ucp1−/− mice under 30 °C and 4 °C (n = 8 random fields per group). Arrows and arrowheads point to positive signals. Scale bars, 50 μm. e, Quantification of 18F-FDG uptake in healthy male volunteers under thermoneutral (28 °C) and mild cold (16 °C) exposure for 2 weeks (n = 3 individuals). f, Representative PET images of 18F-FDG uptake by PET in healthy female volunteers under thermoneutral (28 °C) and mild cold (16 °C) exposure for 2 weeks. Scale bars, 100 mm. Quantification of SUV-BW positive signals presented in panel f (n = 3 individuals). Data presented as mean ± s.e.m. Statistical analysis was performed using one-way ANOVA followed by Tukey multiple tests (a, b) or two-sided unpaired t-test (c-f). NS, not significant. Source data
Extended Data Fig. 8
Extended Data Fig. 8. Schematic diagram of mechanisms underlying tumour suppression by cold exposure.
Under the thermoneutral temperature, cancer cells mainly acquire their energy through glycolysis, that is, the Warburg effect. Angiogenic vessels in tumours provide sufficient glucose for tumour consumption. Both WAT adipocytes (WAs) and BAT adipocytes (BAs) remain metabolically inert without significant glucose uptake and thermogenic activity. Glycolysis-generated ATP molecules and other metabolites support tumour cell proliferation at high rates. Under cold exposure, both sWAT and BAT undergo a browning process that markedly increases glucose uptake and thermogenesis. Owing to the elevated glucose uptake in activated BAT and sWAT, glucose uptake in tumours is significantly reduced. Consequently, tumour growth under cold exposure is inhibited through several possible mechanisms: 1) reduced glucose supply in tumours due to glucose redistribution in activated BAT and WAT; 2) mitigation of tumour hypoxia. Owing to limited glycolysis, acidosis and tumour hypoxia are reduced. Additionally, slow tumour growth also alleviates tumour hypoxia. Mitigation of tumour hypoxia by cold exposure also reduces expression levels of GLUTs, which are limiting factors for glucose uptake; and 3) plausible inhibition of glycolysis by lipid metabolites.

Comment in

References

    1. Vander Heiden MG, Cantley LC, Thompson CB. Understanding the Warburg effect: the metabolic requirements of cell proliferation. Science. 2009;324:1029–1033. doi: 10.1126/science.1160809. - DOI - PMC - PubMed
    1. Gatenby RA, Gillies RJ. Why do cancers have high aerobic glycolysis. Nat. Rev. Cancer. 2004;4:891–899. doi: 10.1038/nrc1478. - DOI - PubMed
    1. Zhang Y, et al. Maintenance of antiangiogenic and antitumor effects by orally active low-dose capecitabine for long-term cancer therapy. Proc. Natl Acad. Sci. USA. 2017;114:E5226–E5235. - PMC - PubMed
    1. Cannon B, Nedergaard J. Brown adipose tissue: function and physiological significance. Physiol. Rev. 2004;84:277–359. doi: 10.1152/physrev.00015.2003. - DOI - PubMed
    1. Seaton TB, Welle S, Campbell RG. Thermogenesis in brown adipose tissue. N. Engl. J. Med. 1985;312:1062–1063. doi: 10.1056/NEJM198504183121617. - DOI - PubMed