. 2022 Aug;608(7922):353-359.
doi: 10.1038/s41586-022-05035-y. Epub 2022 Aug 3.

Transcriptome variation in human tissues revealed by long-read sequencing

Affiliations

Transcriptome variation in human tissues revealed by long-read sequencing

Dafni A Glinos et al. Nature. 2022 Aug.

Abstract

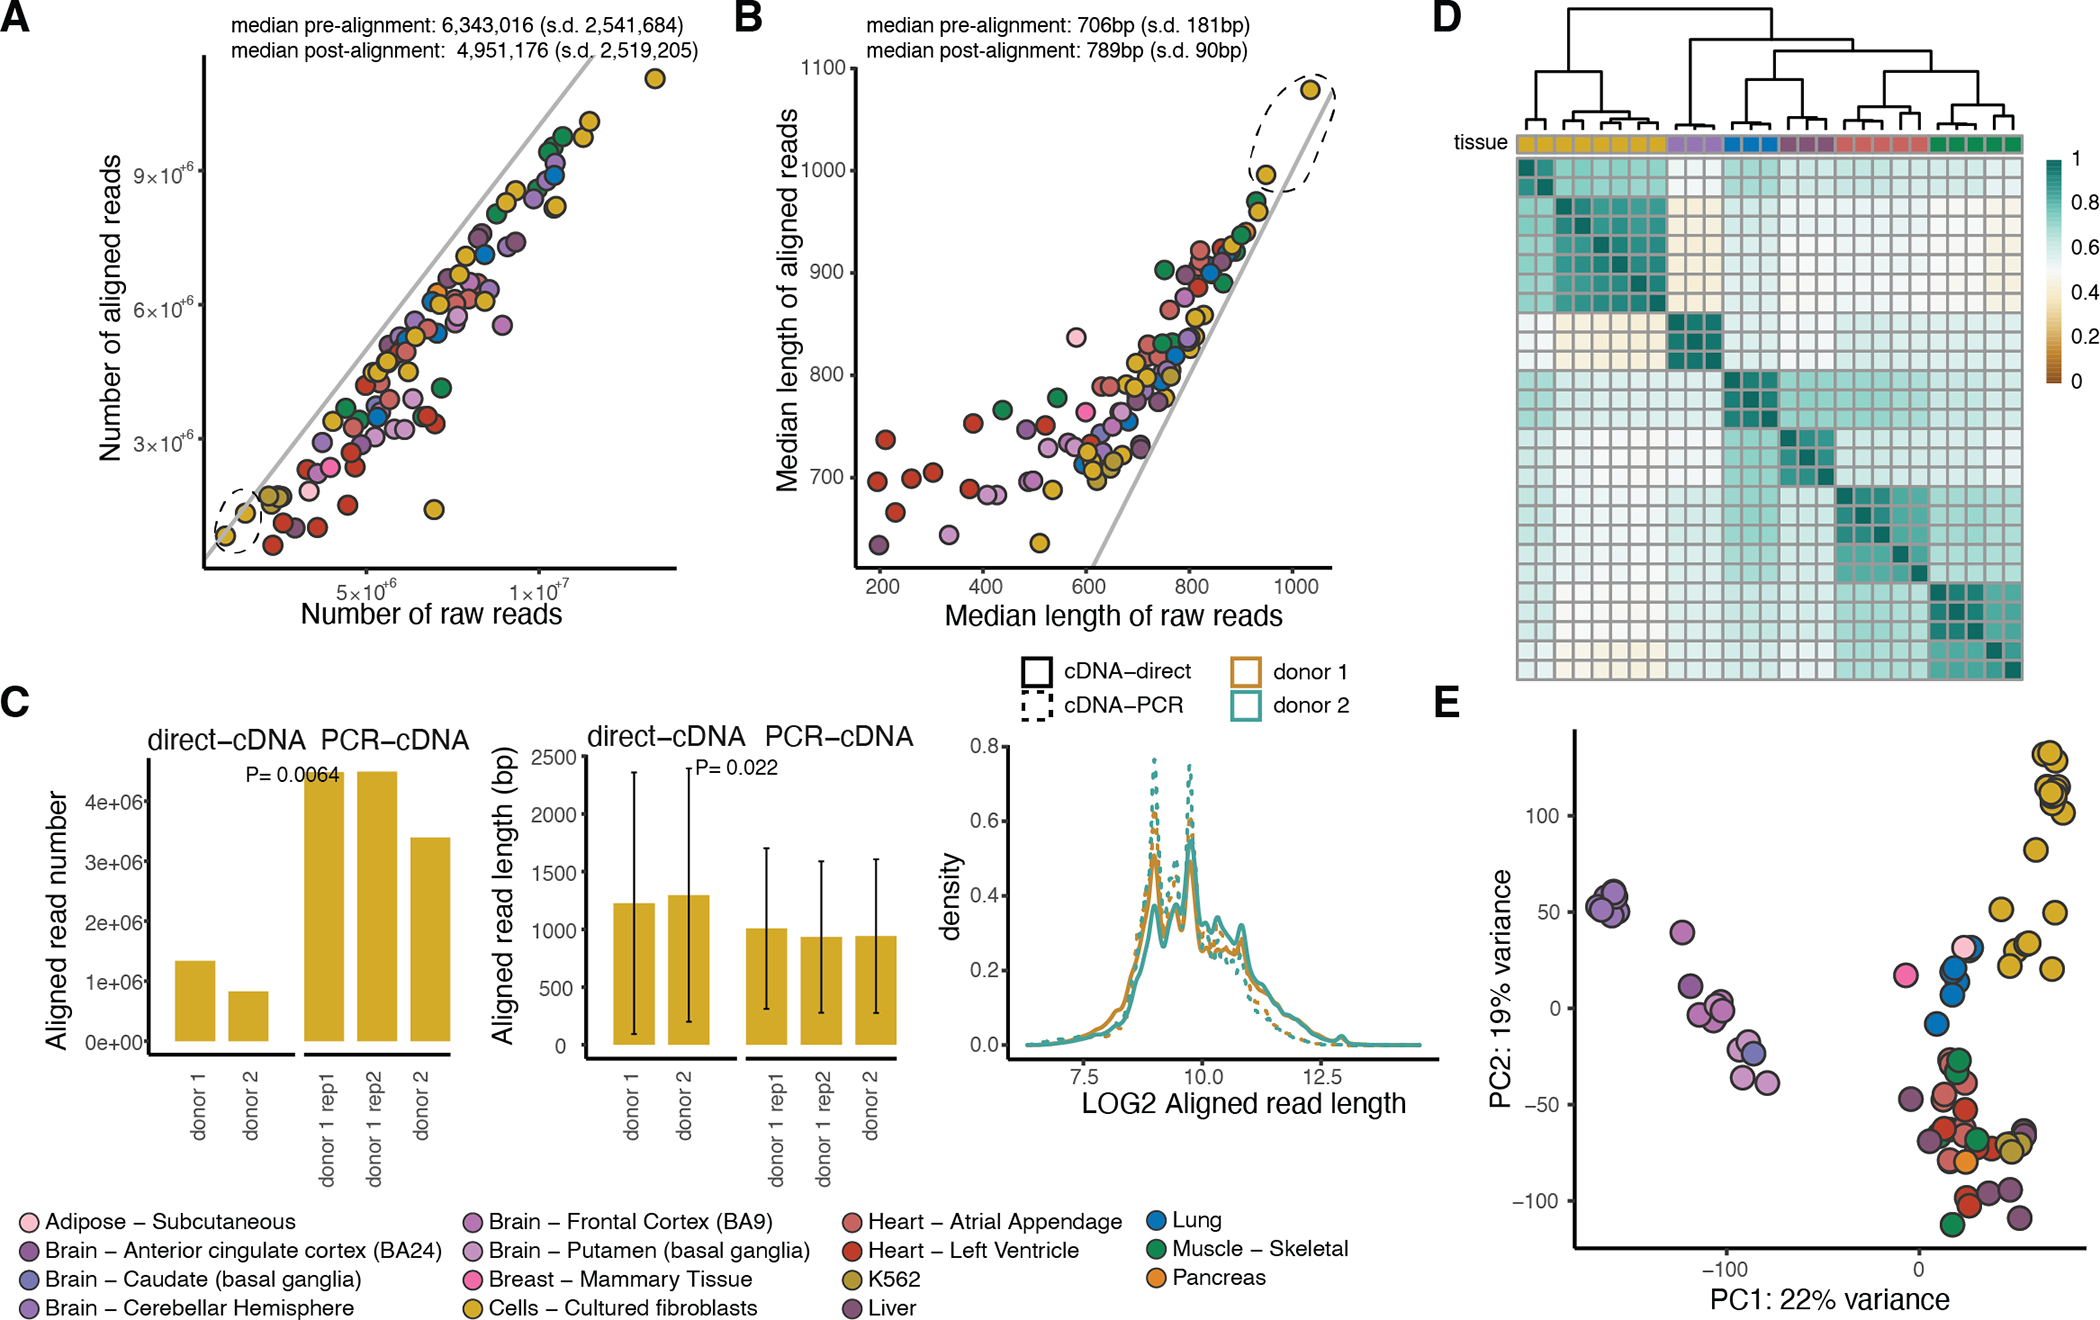
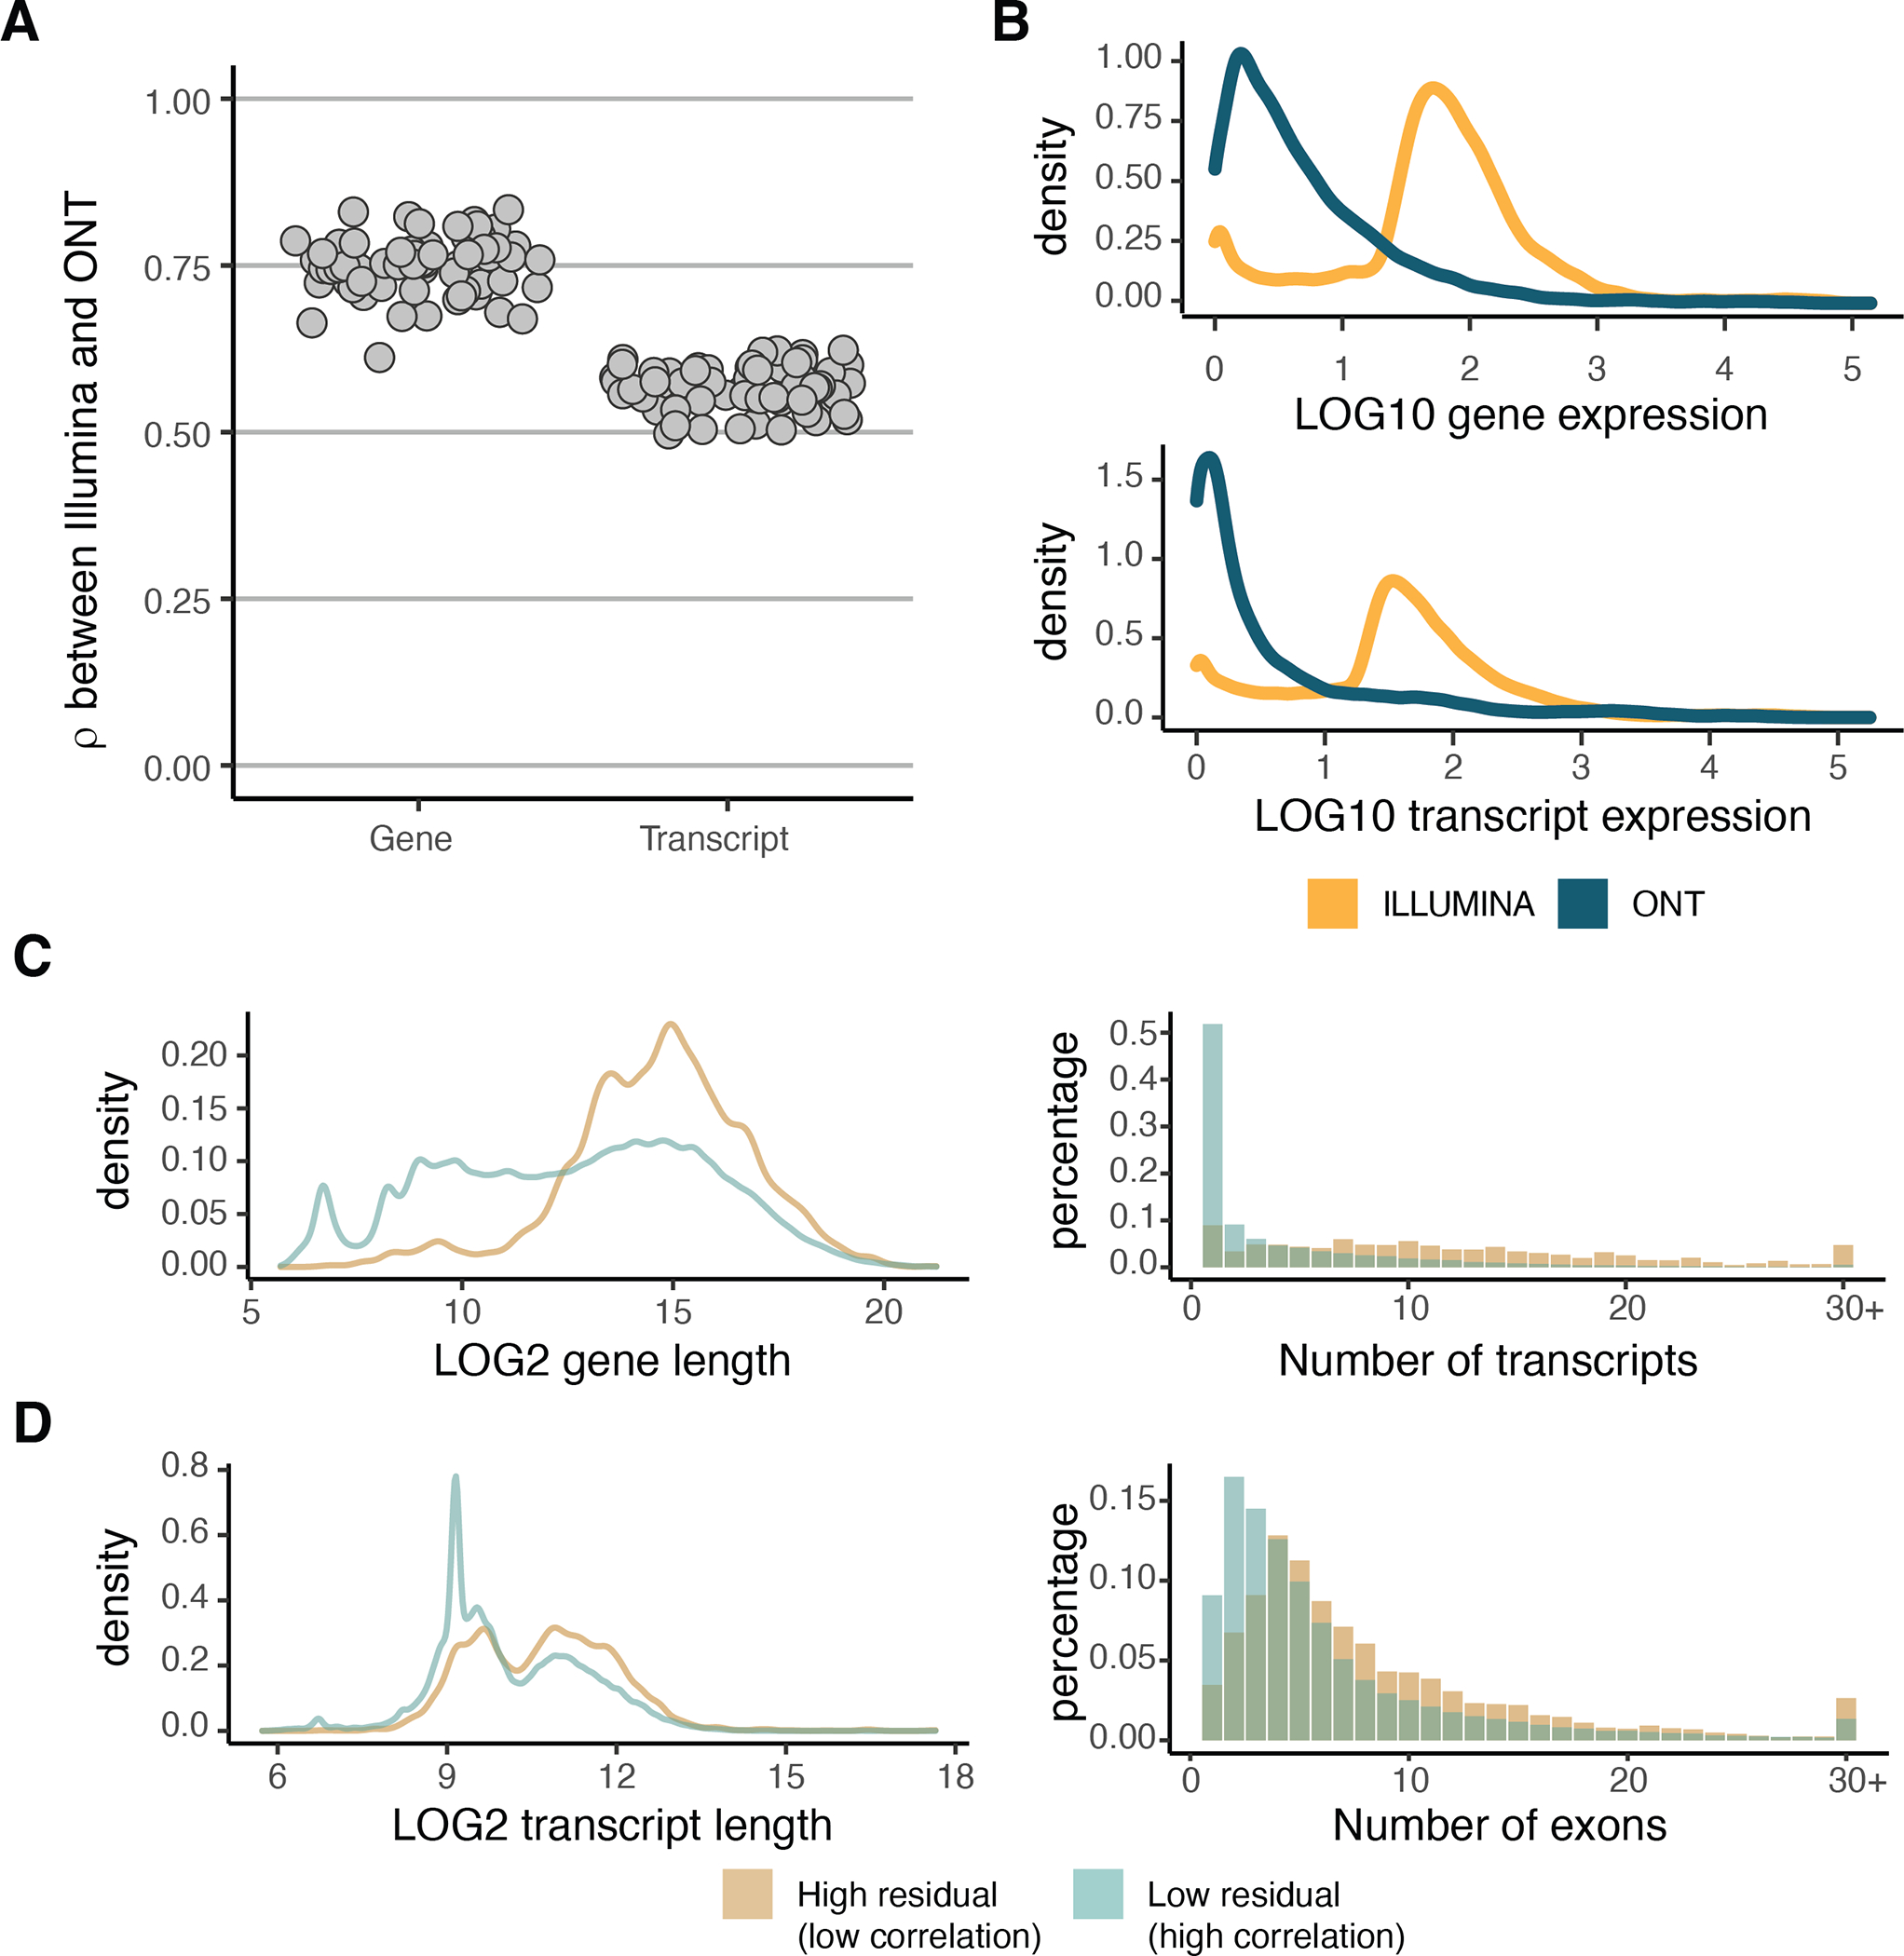
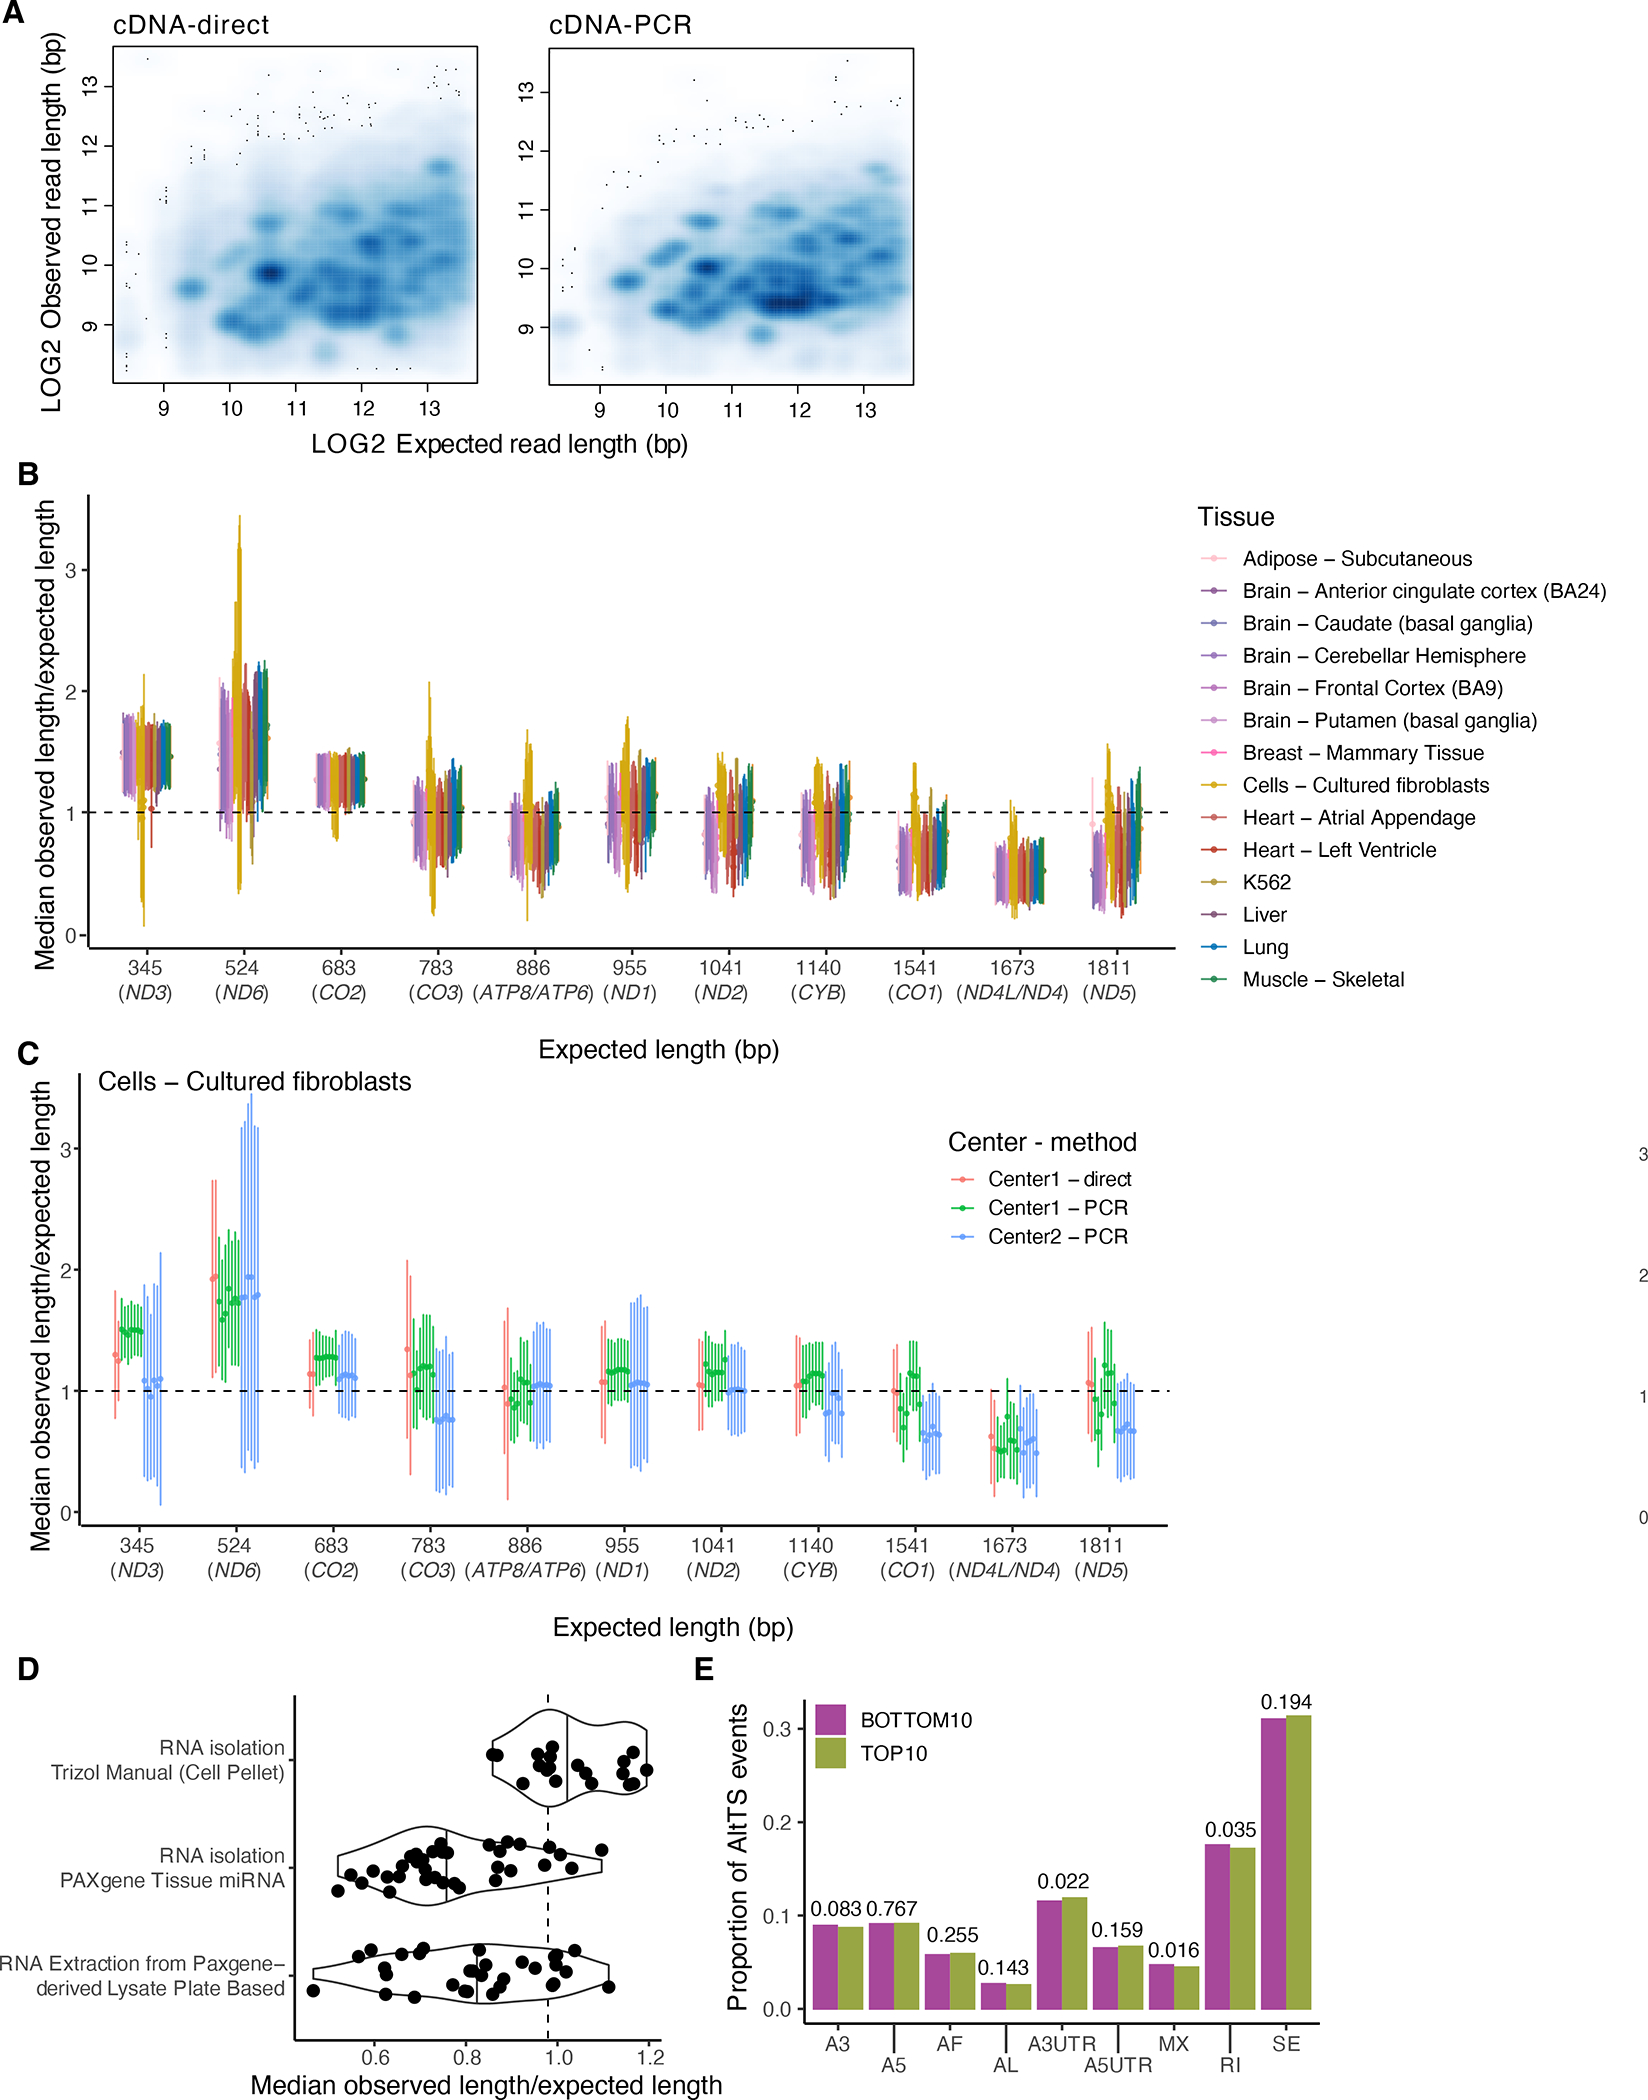
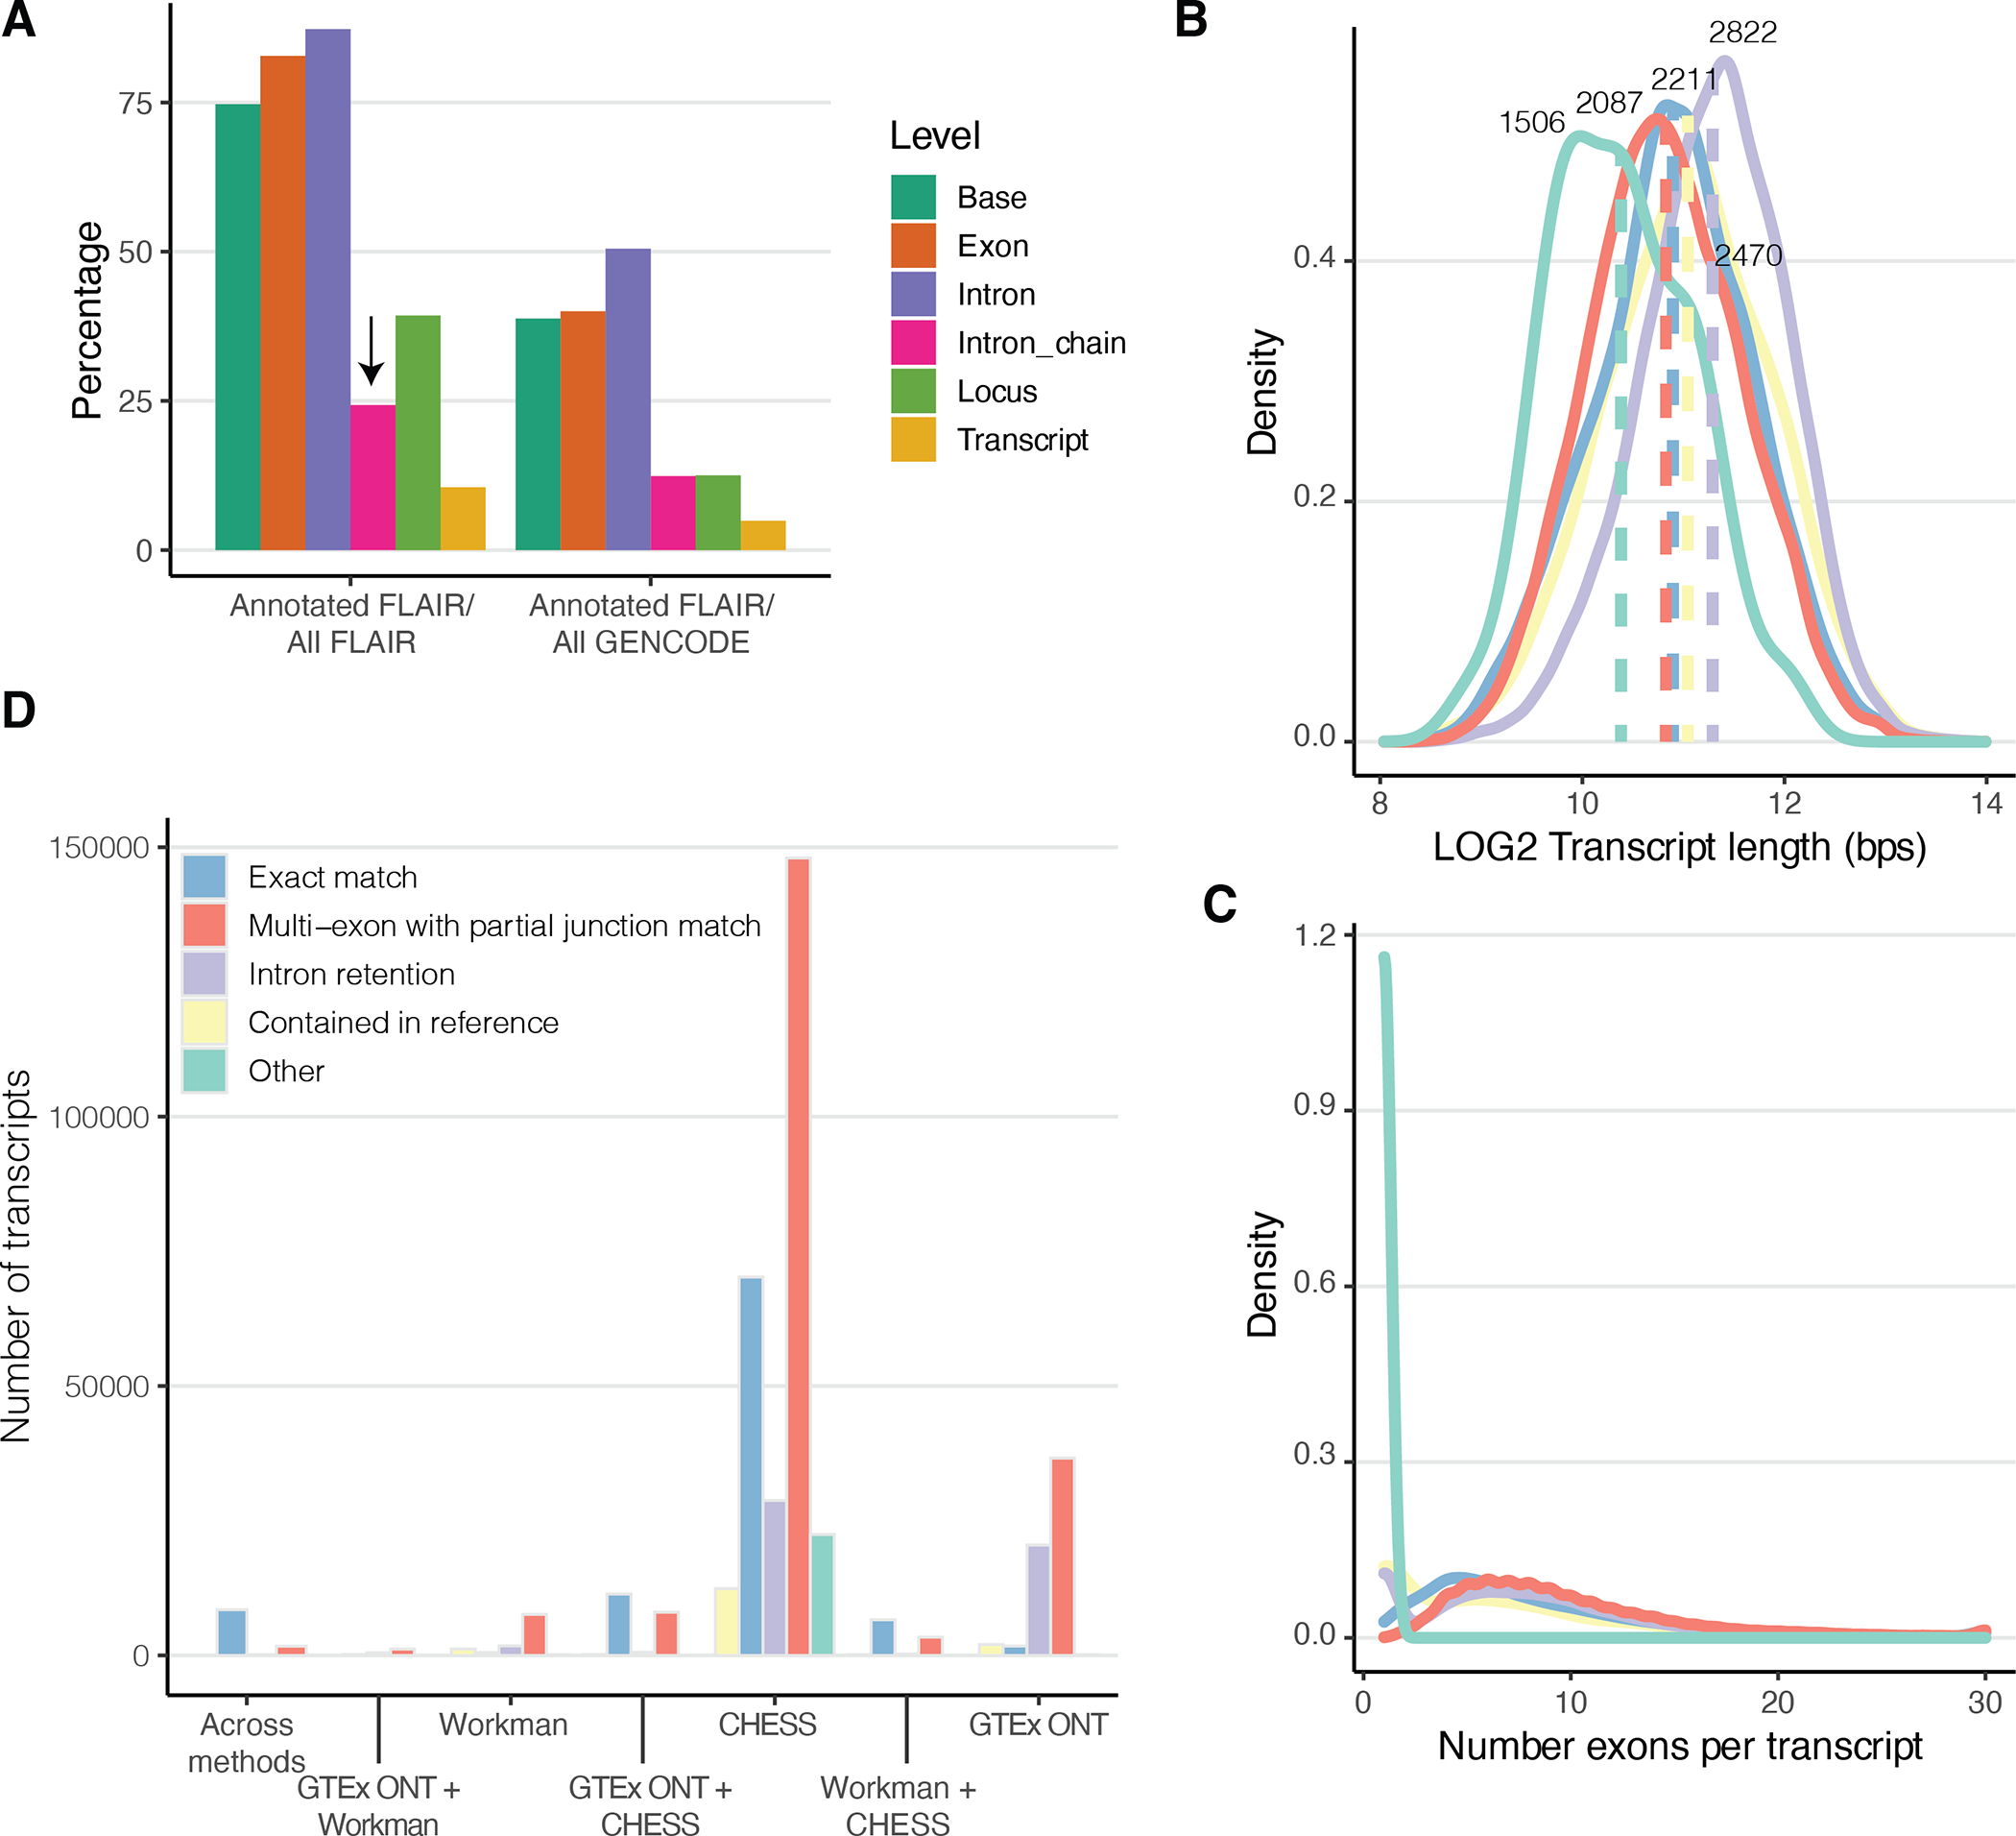
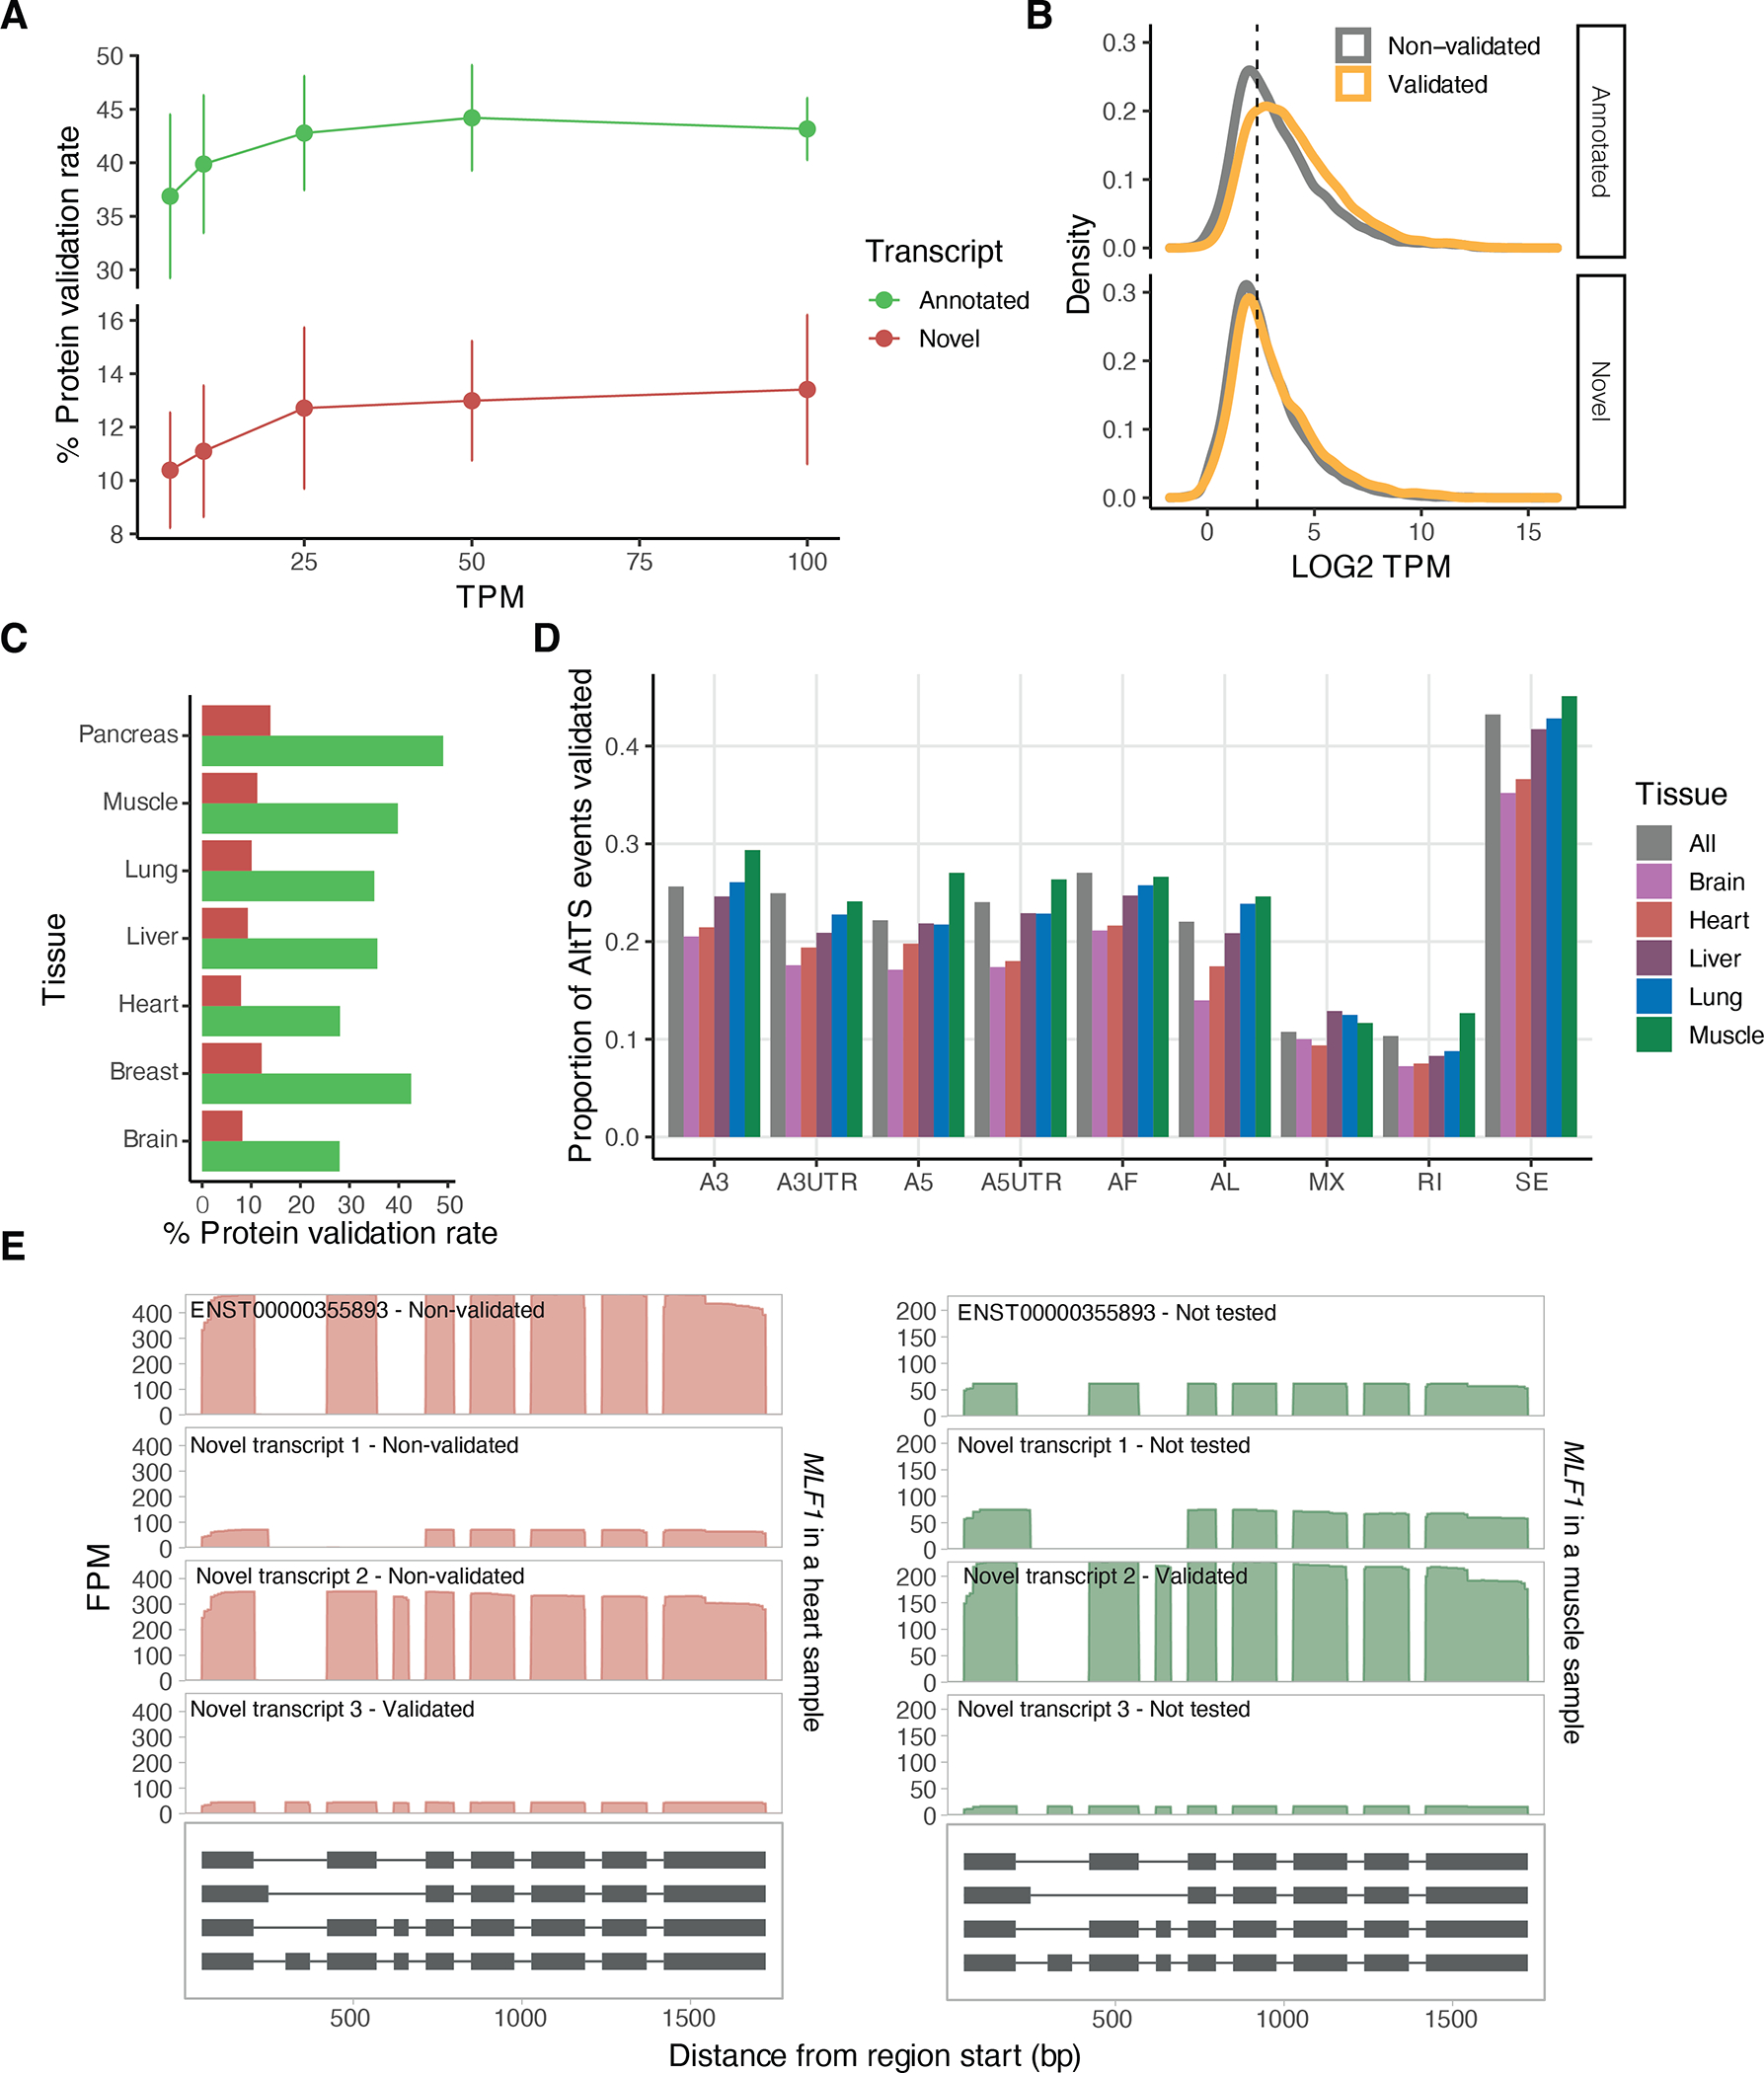
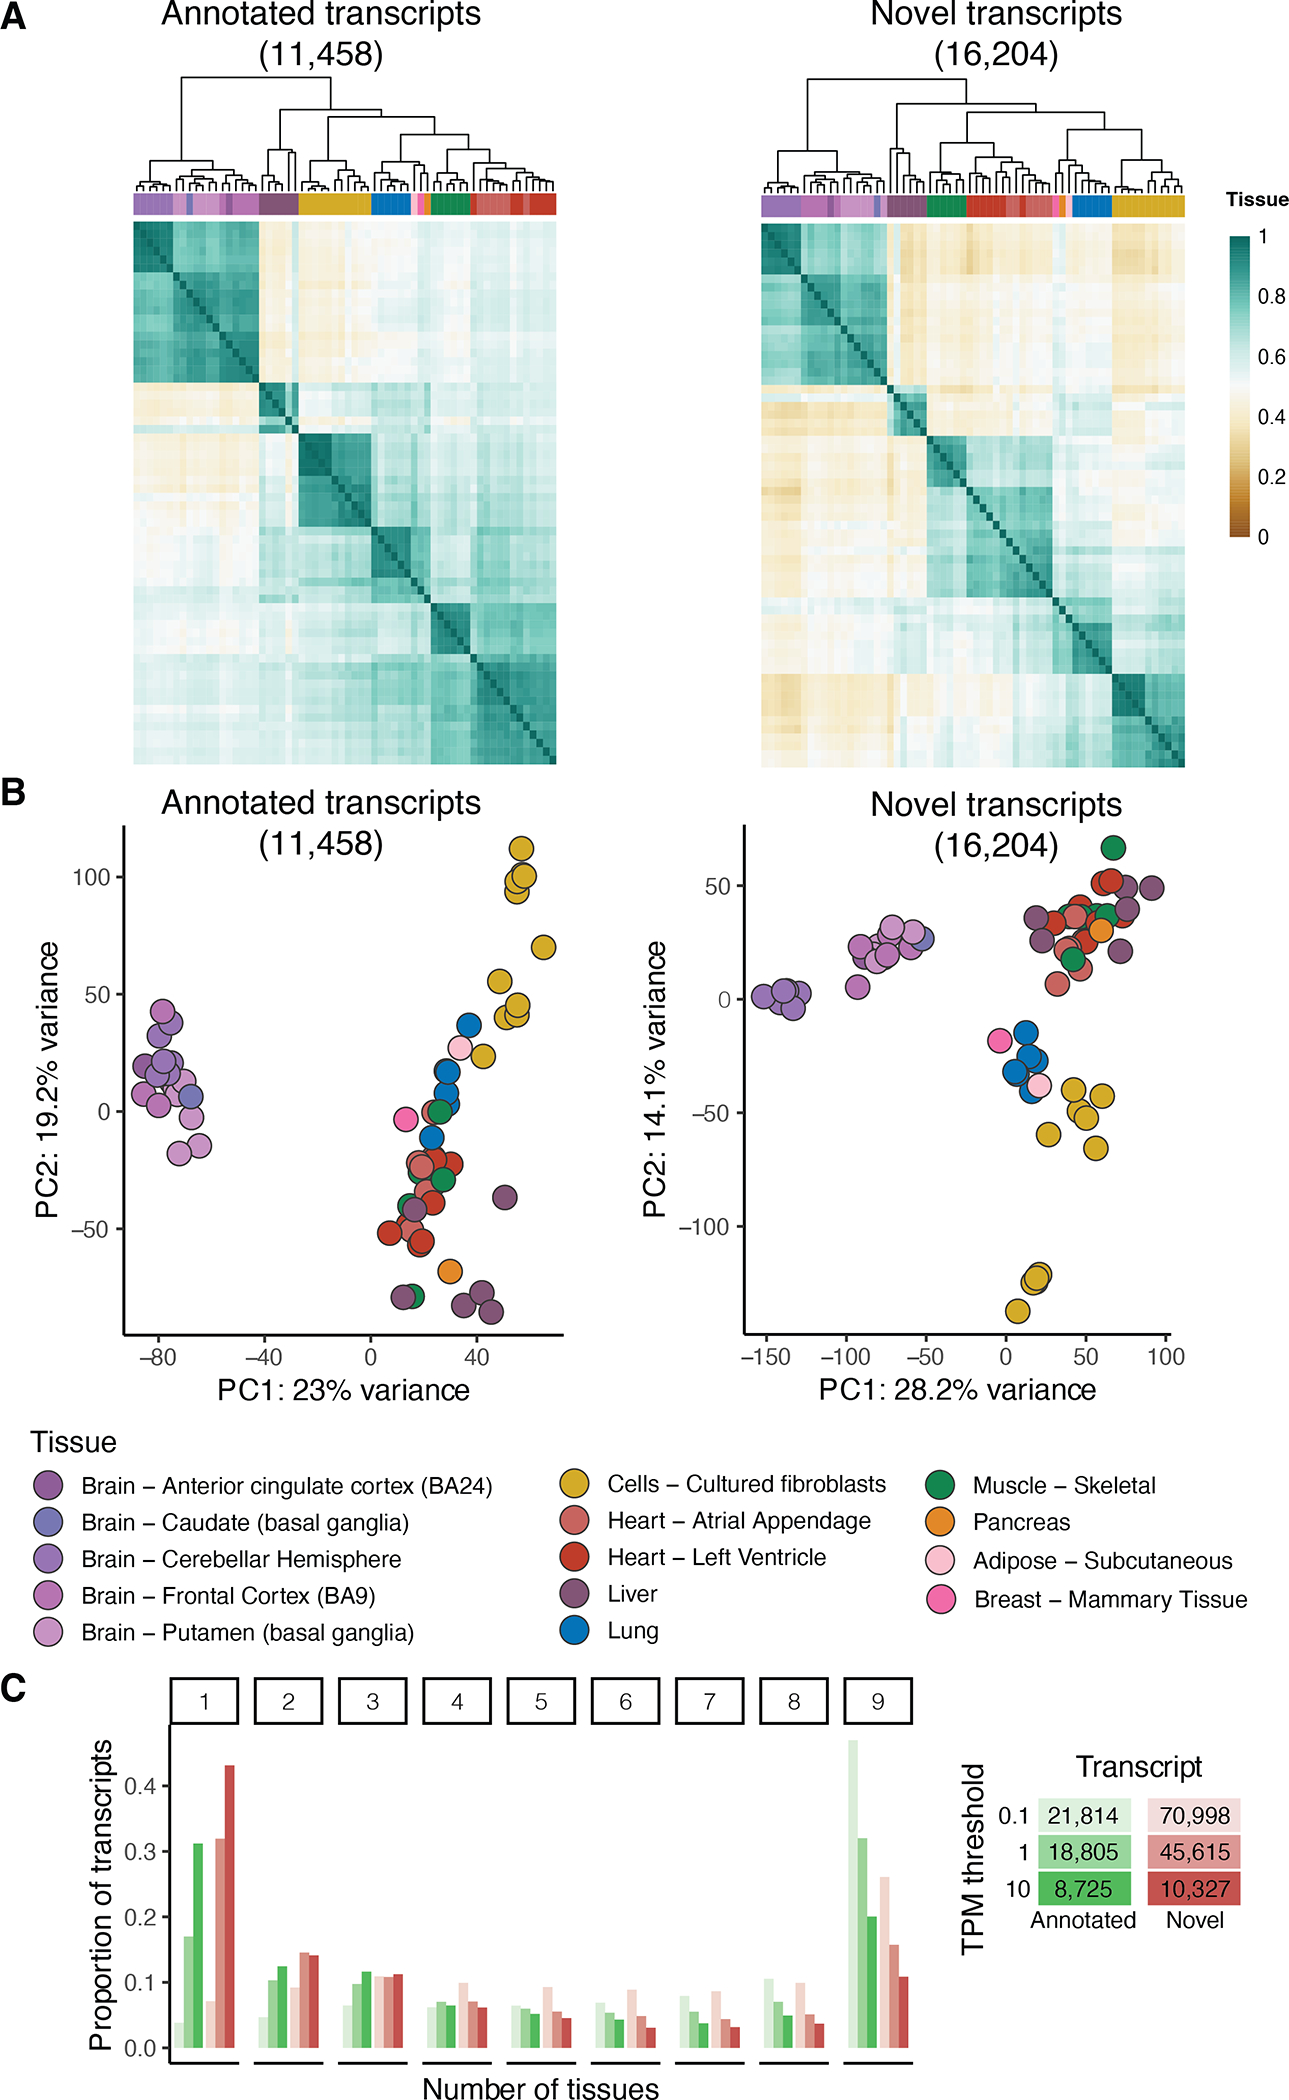
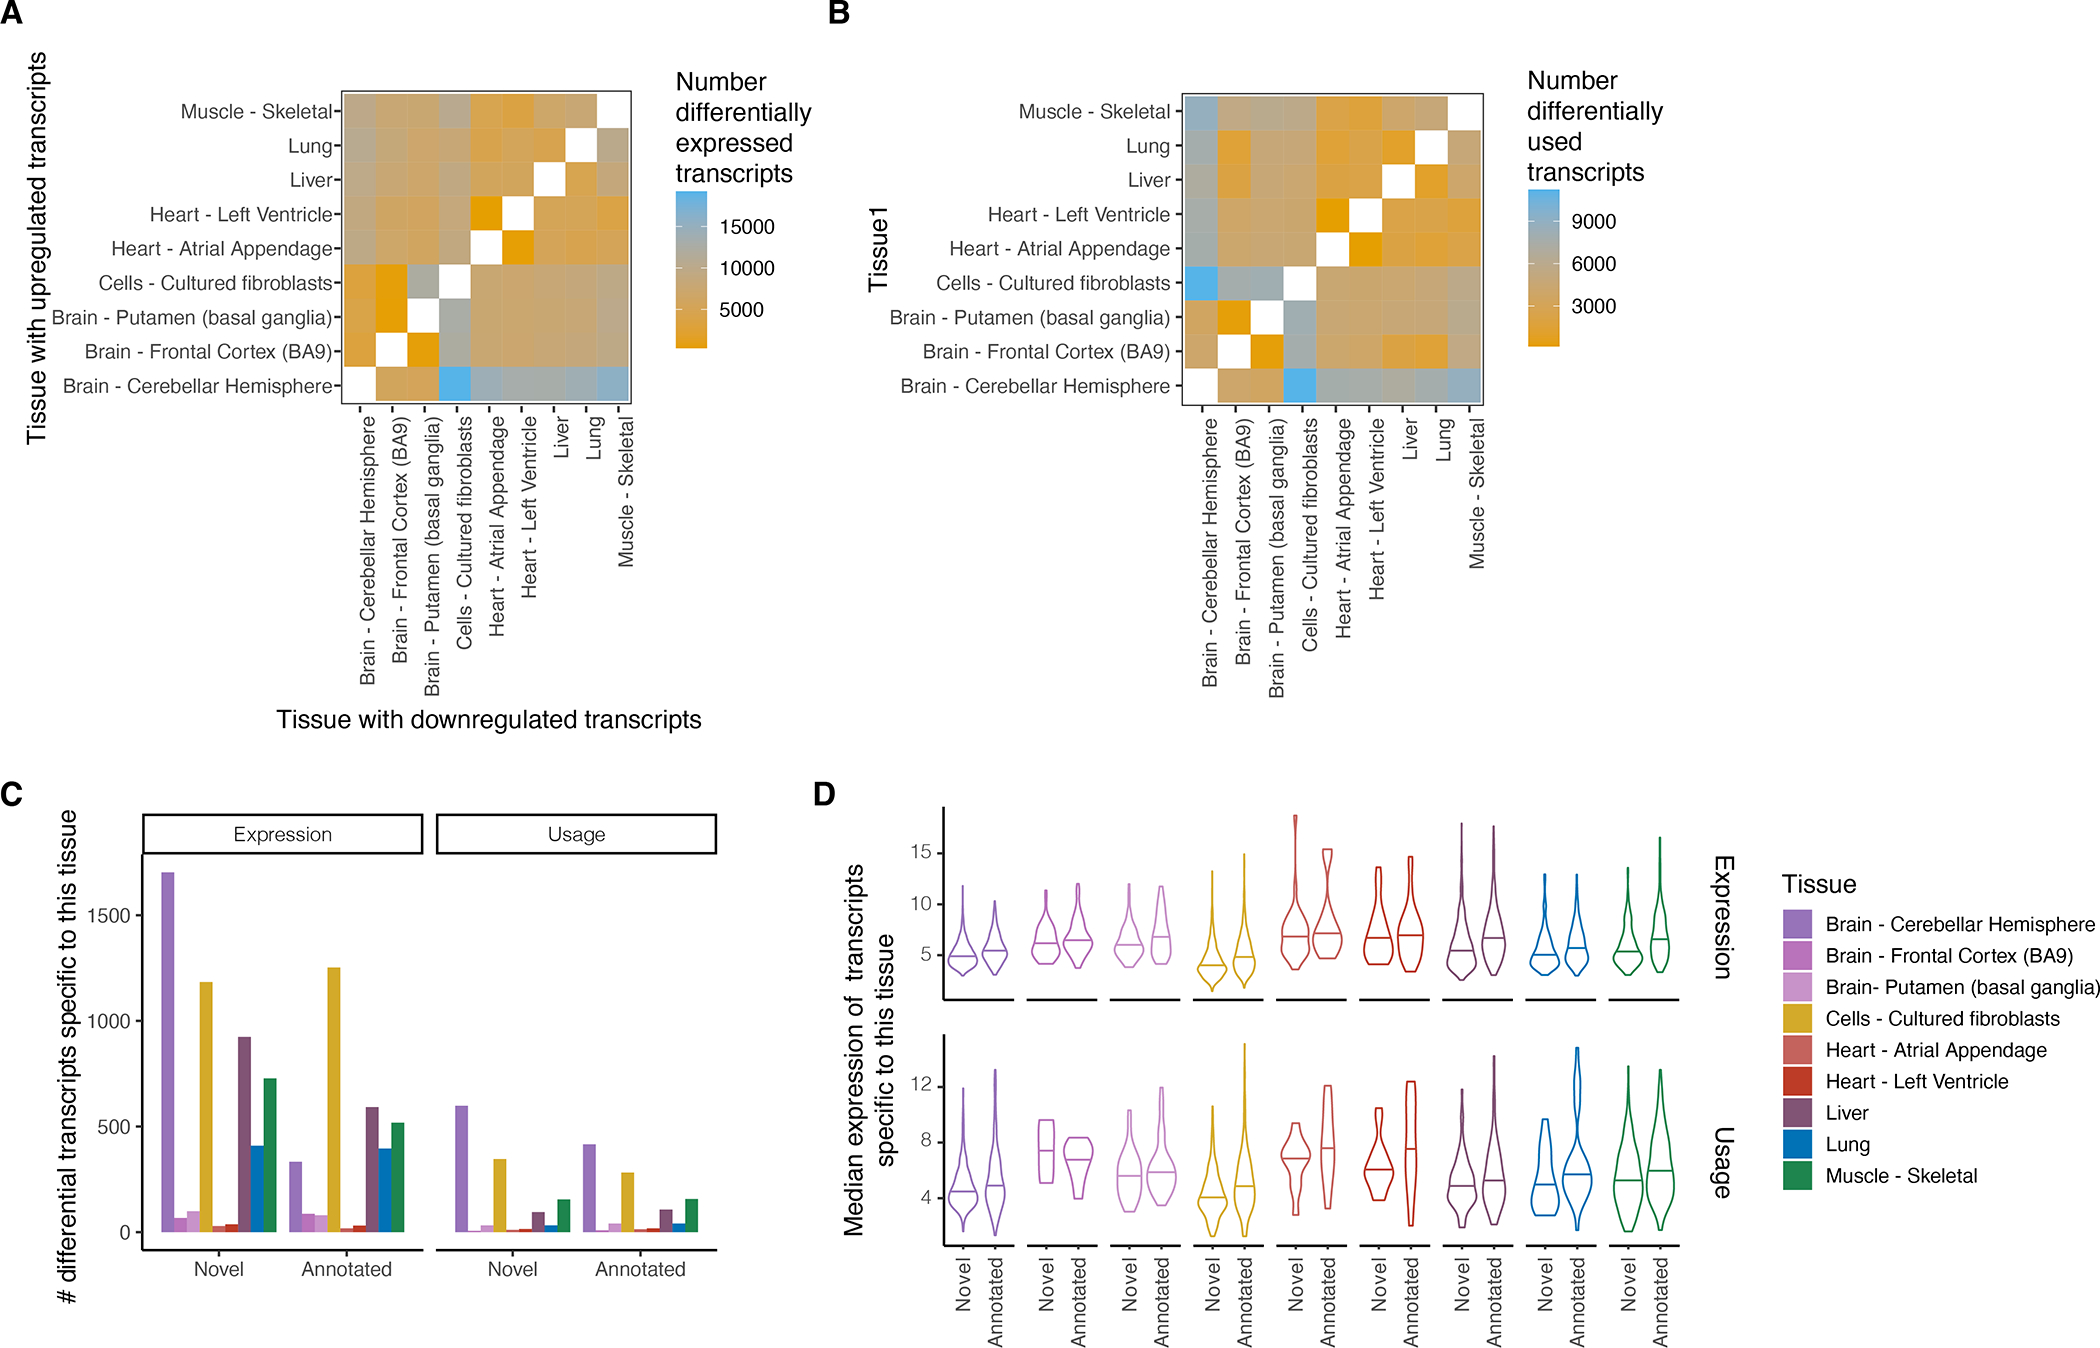
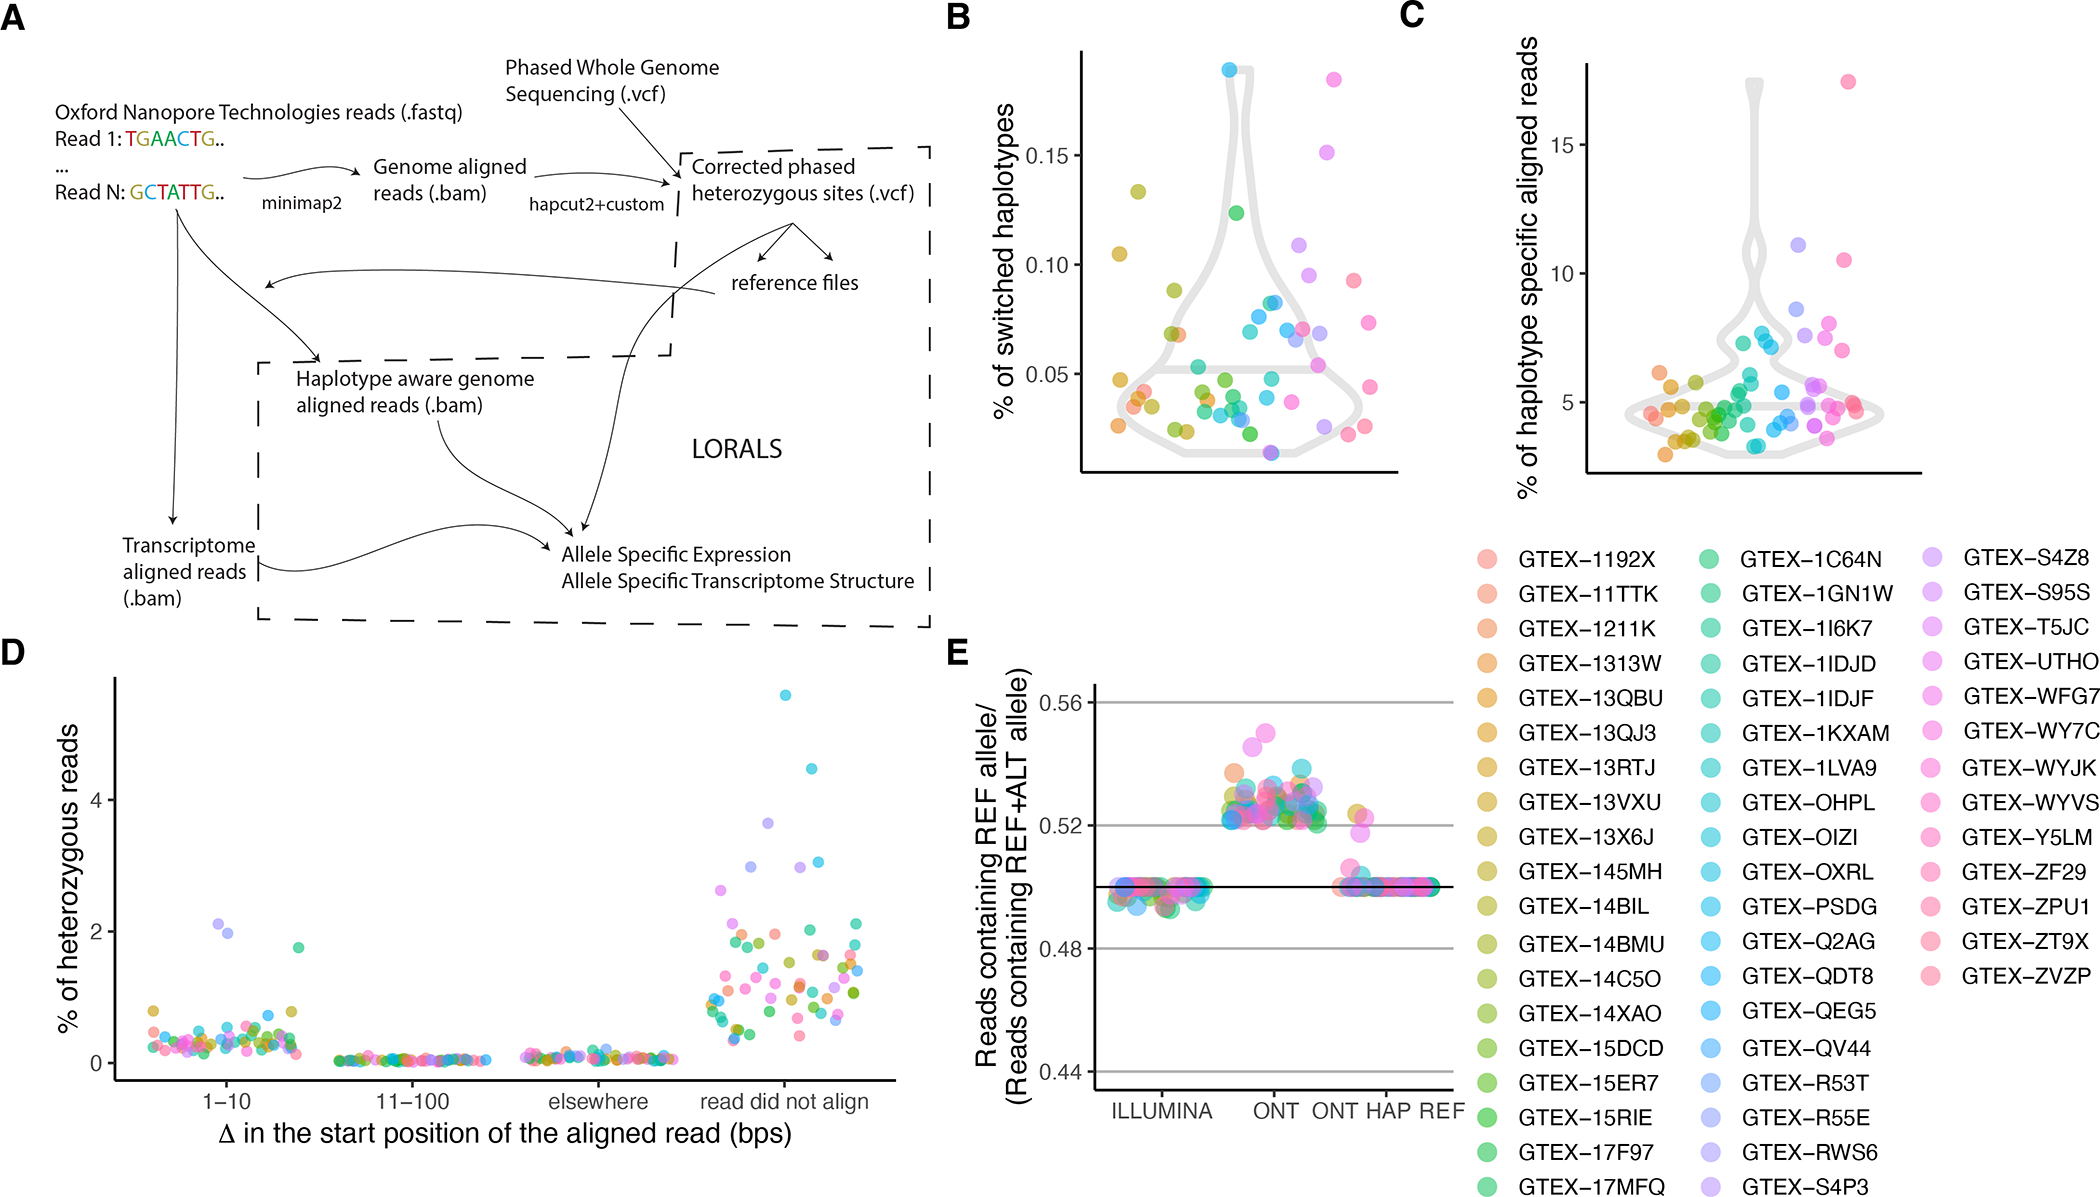
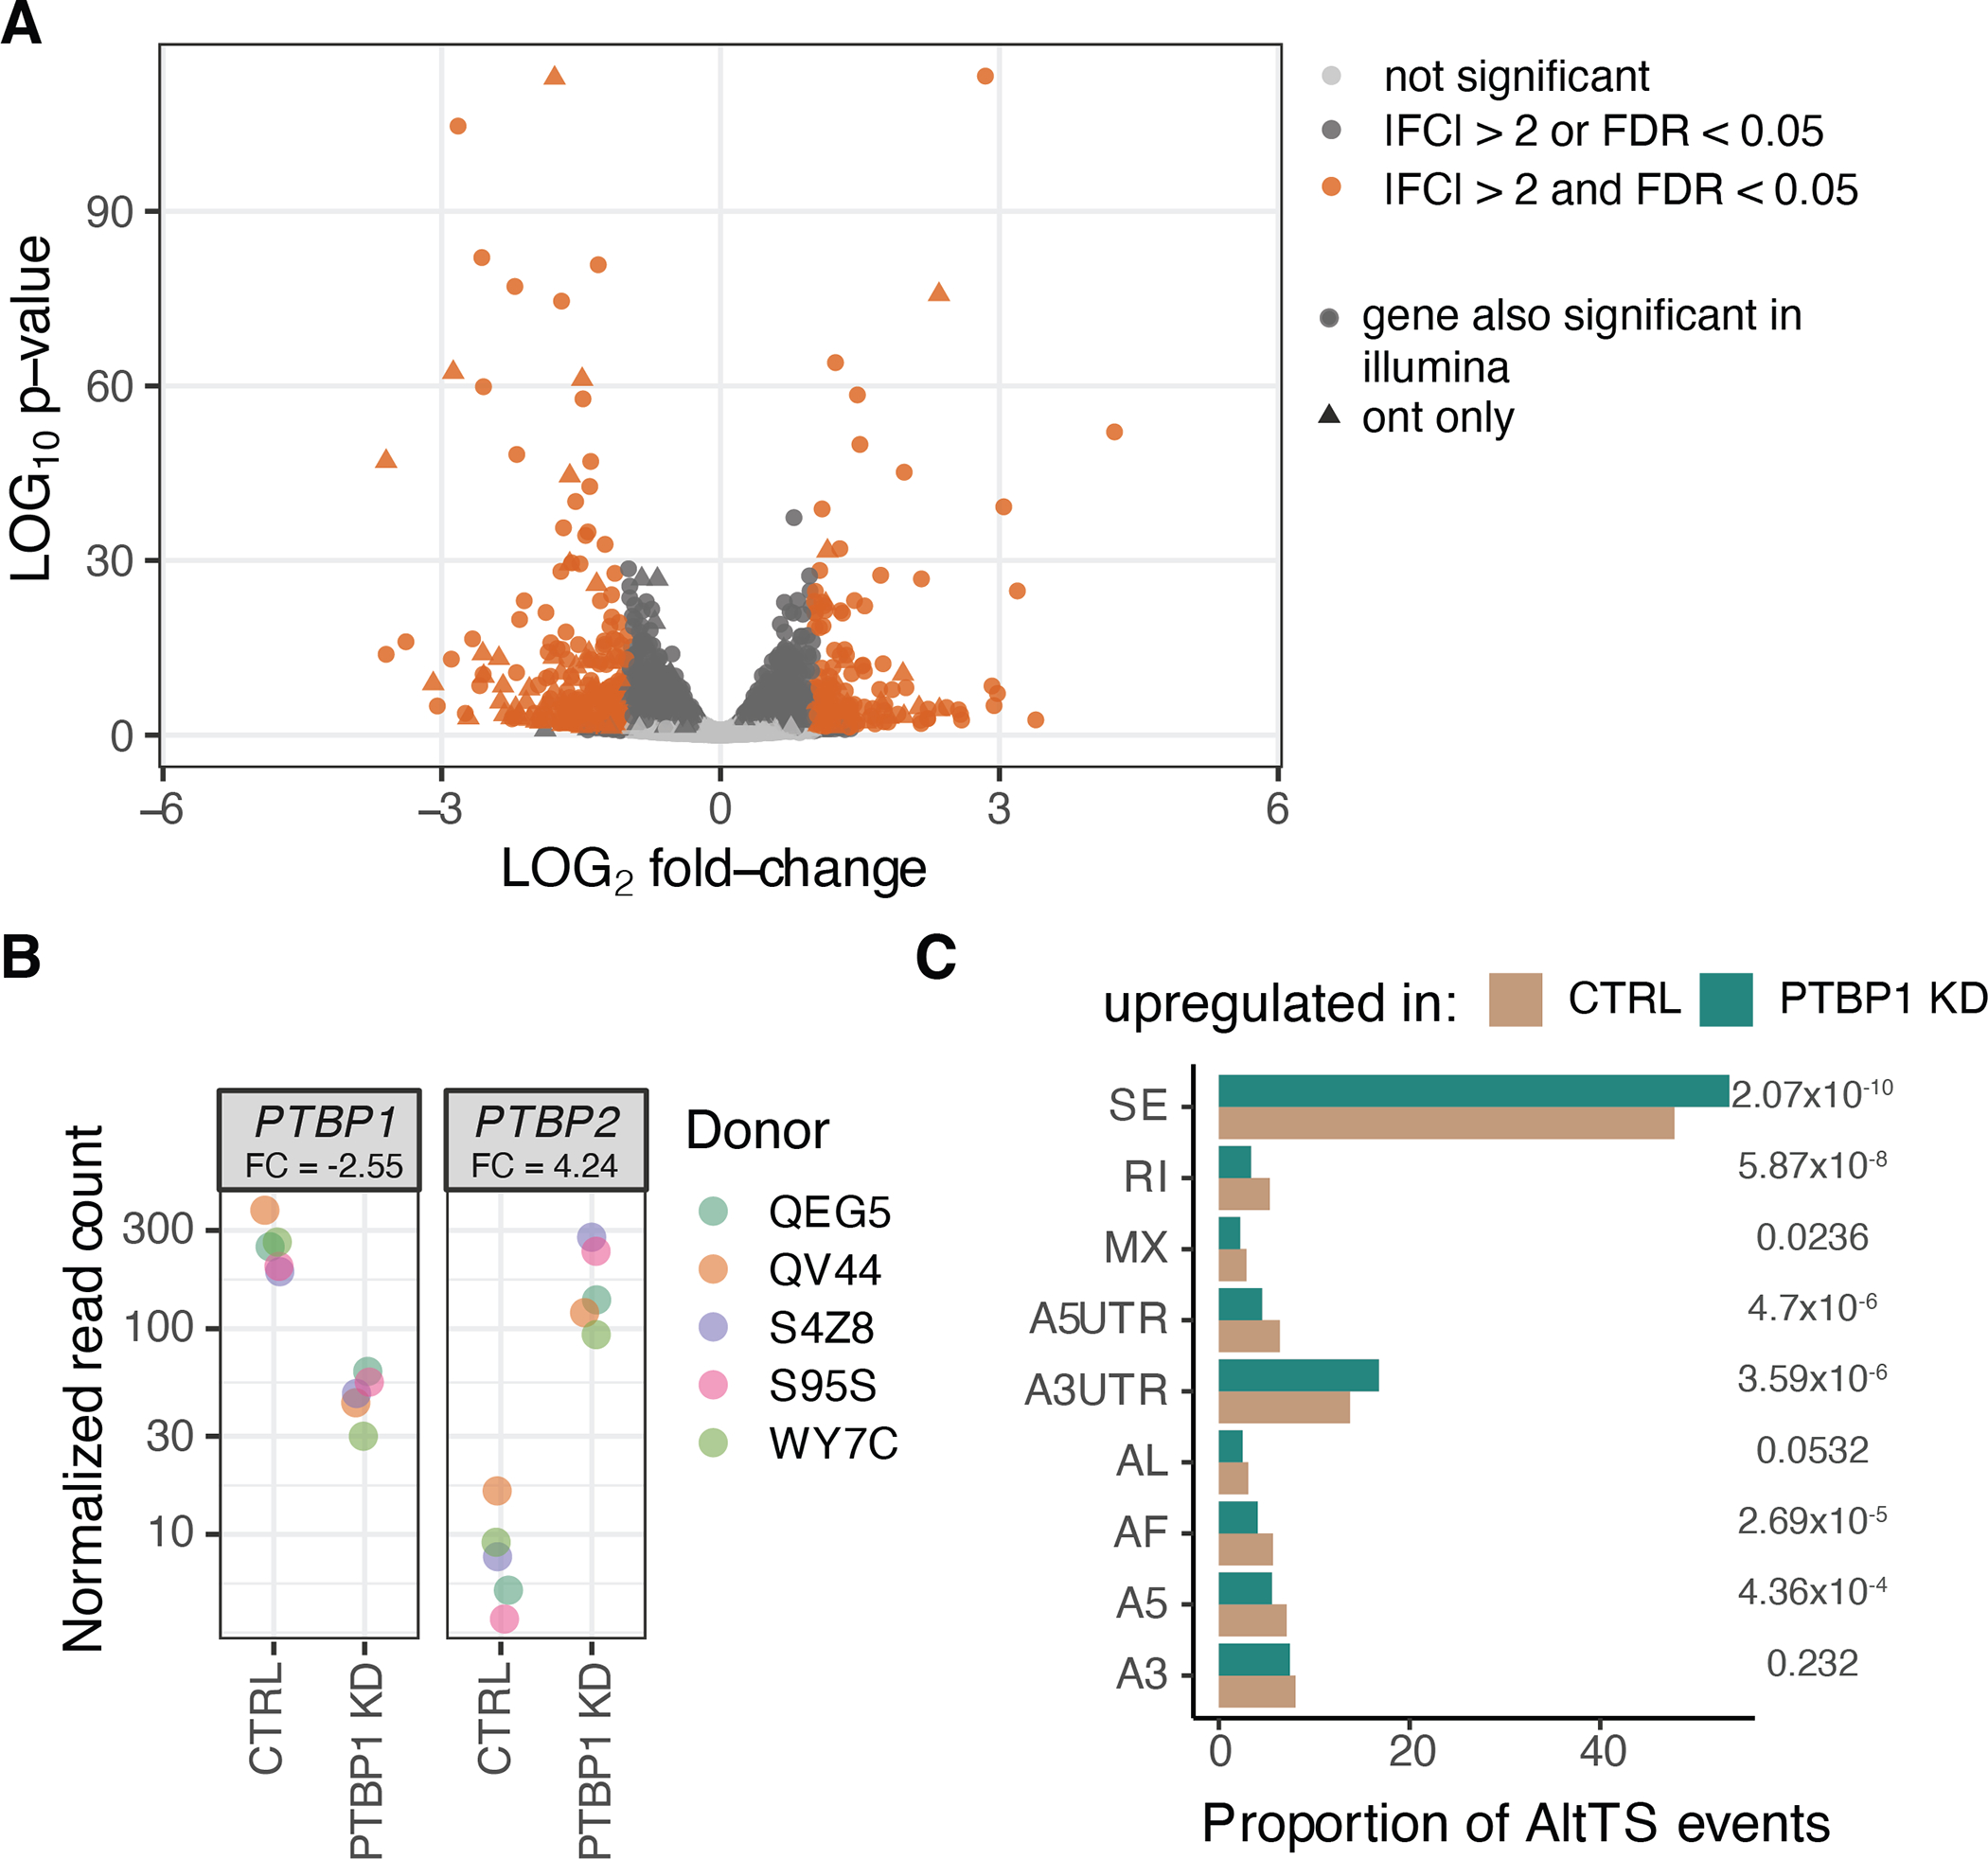
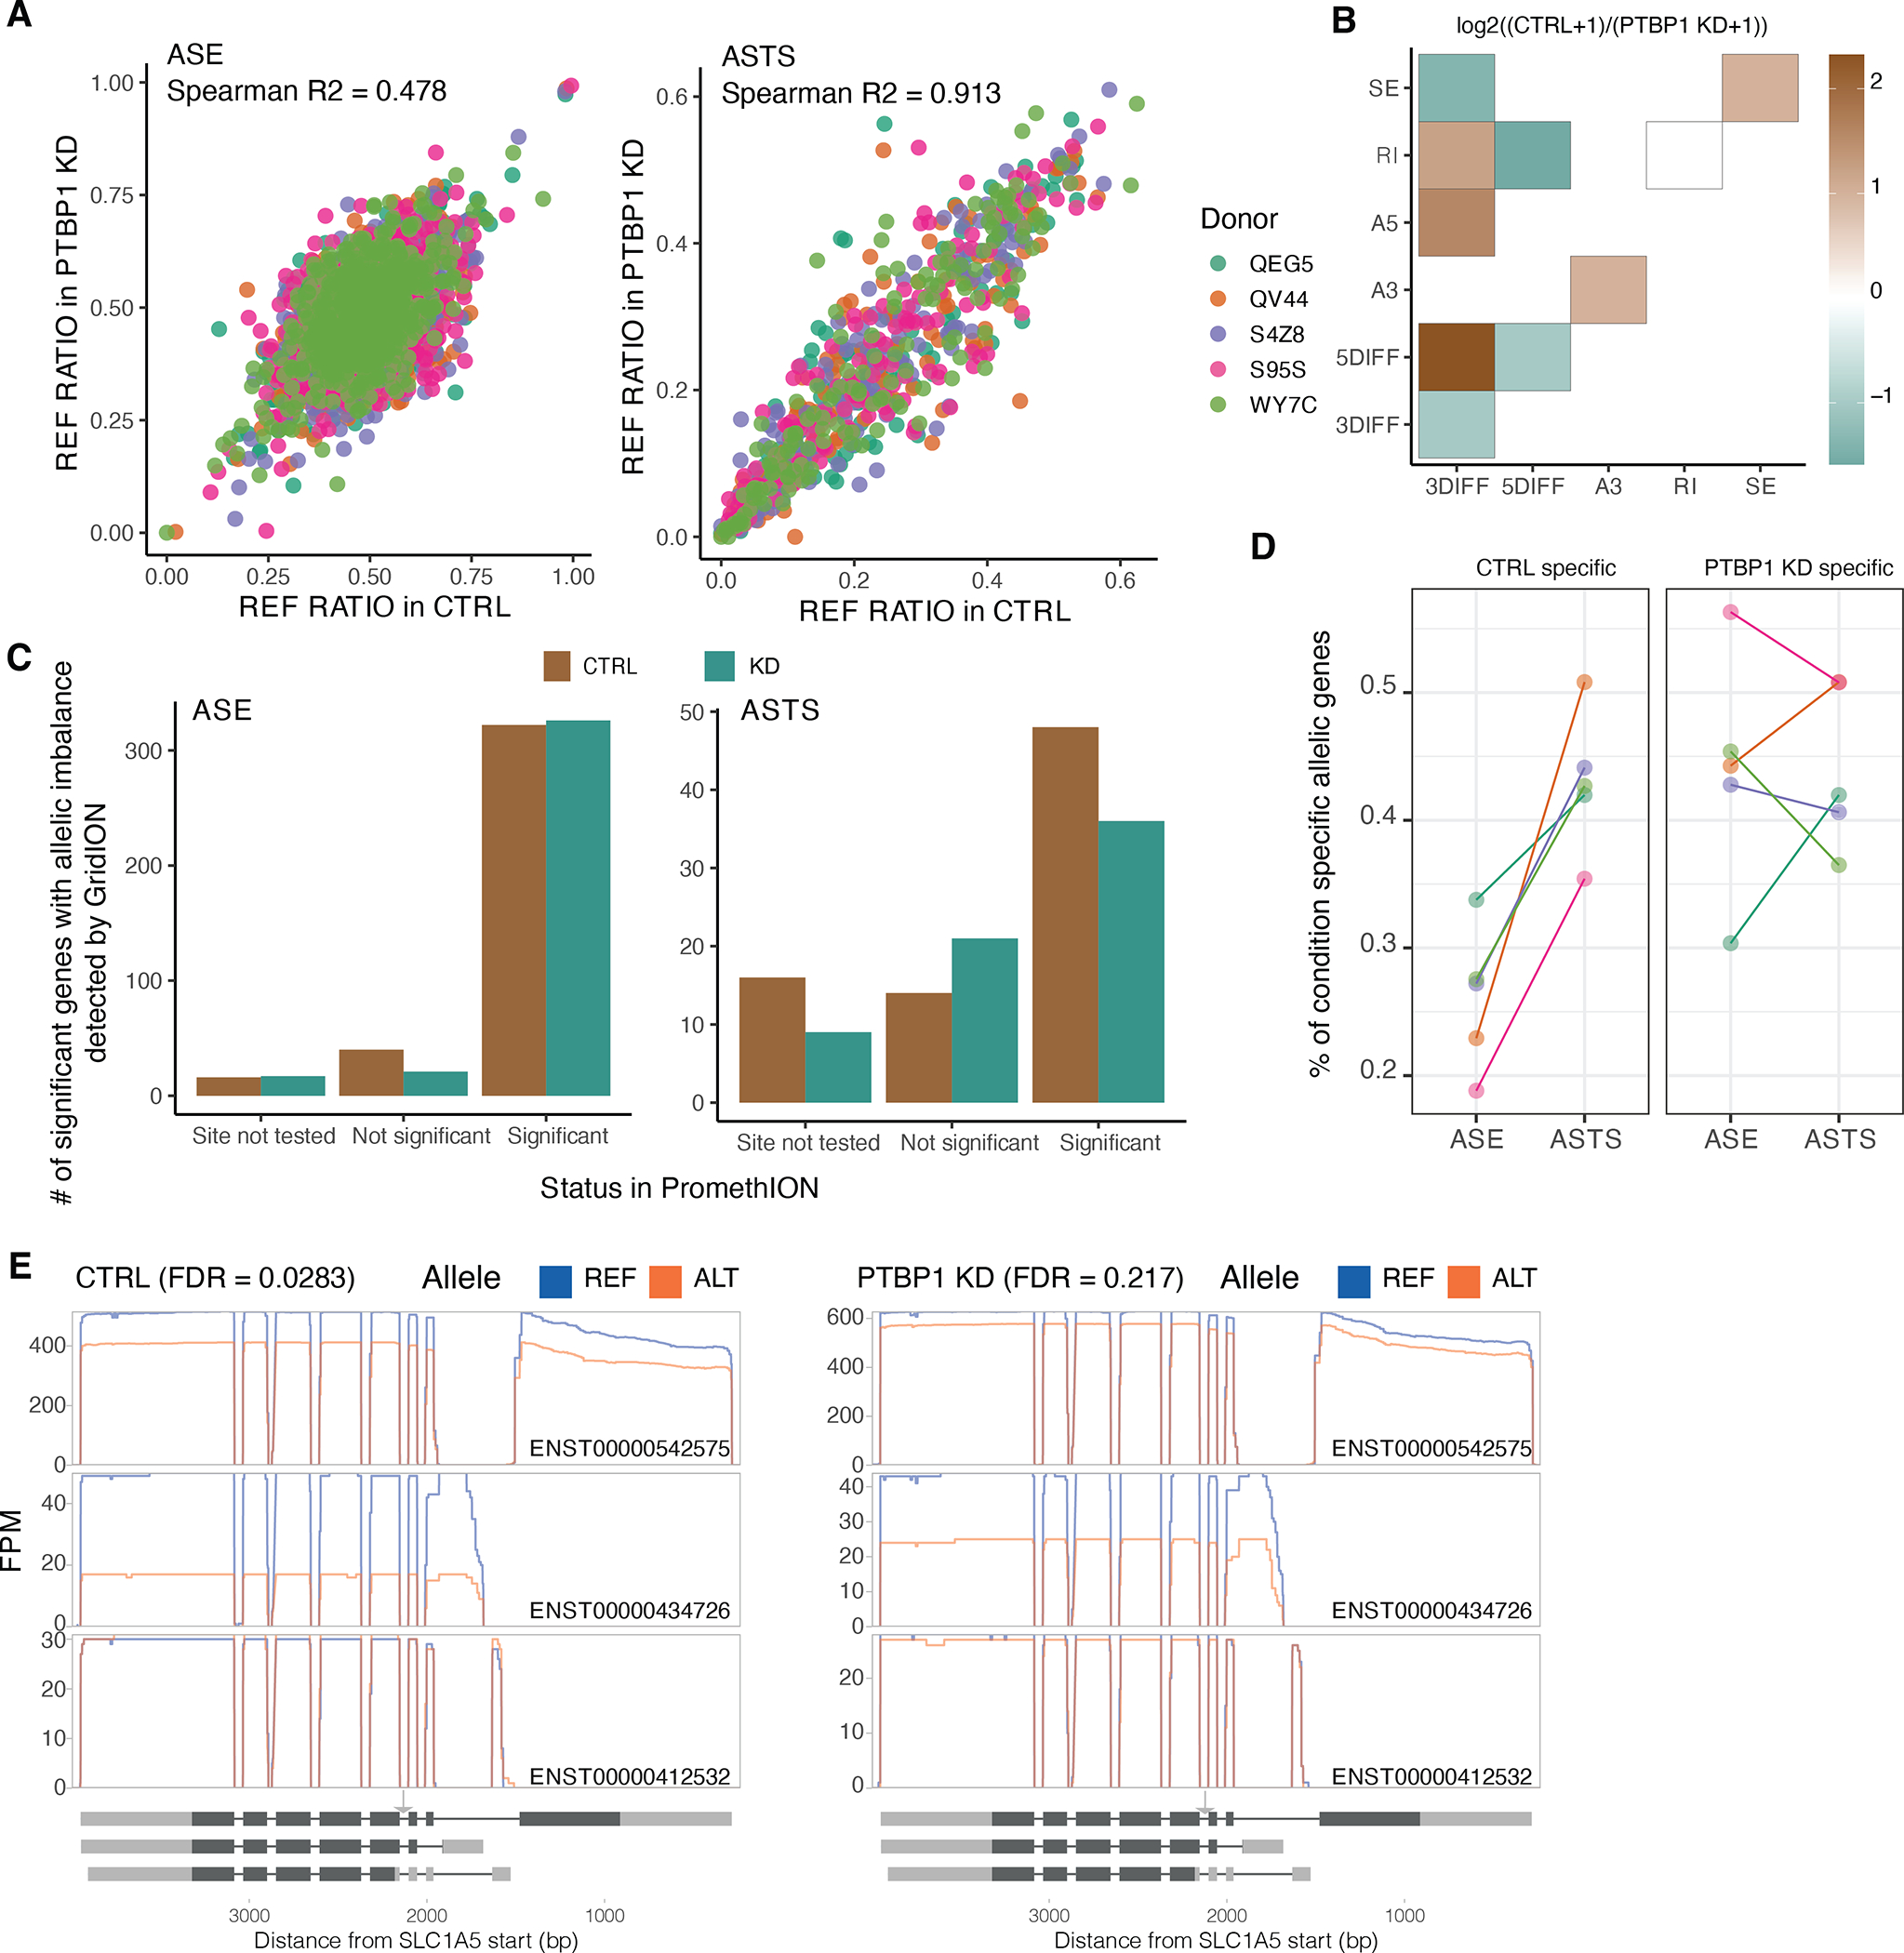
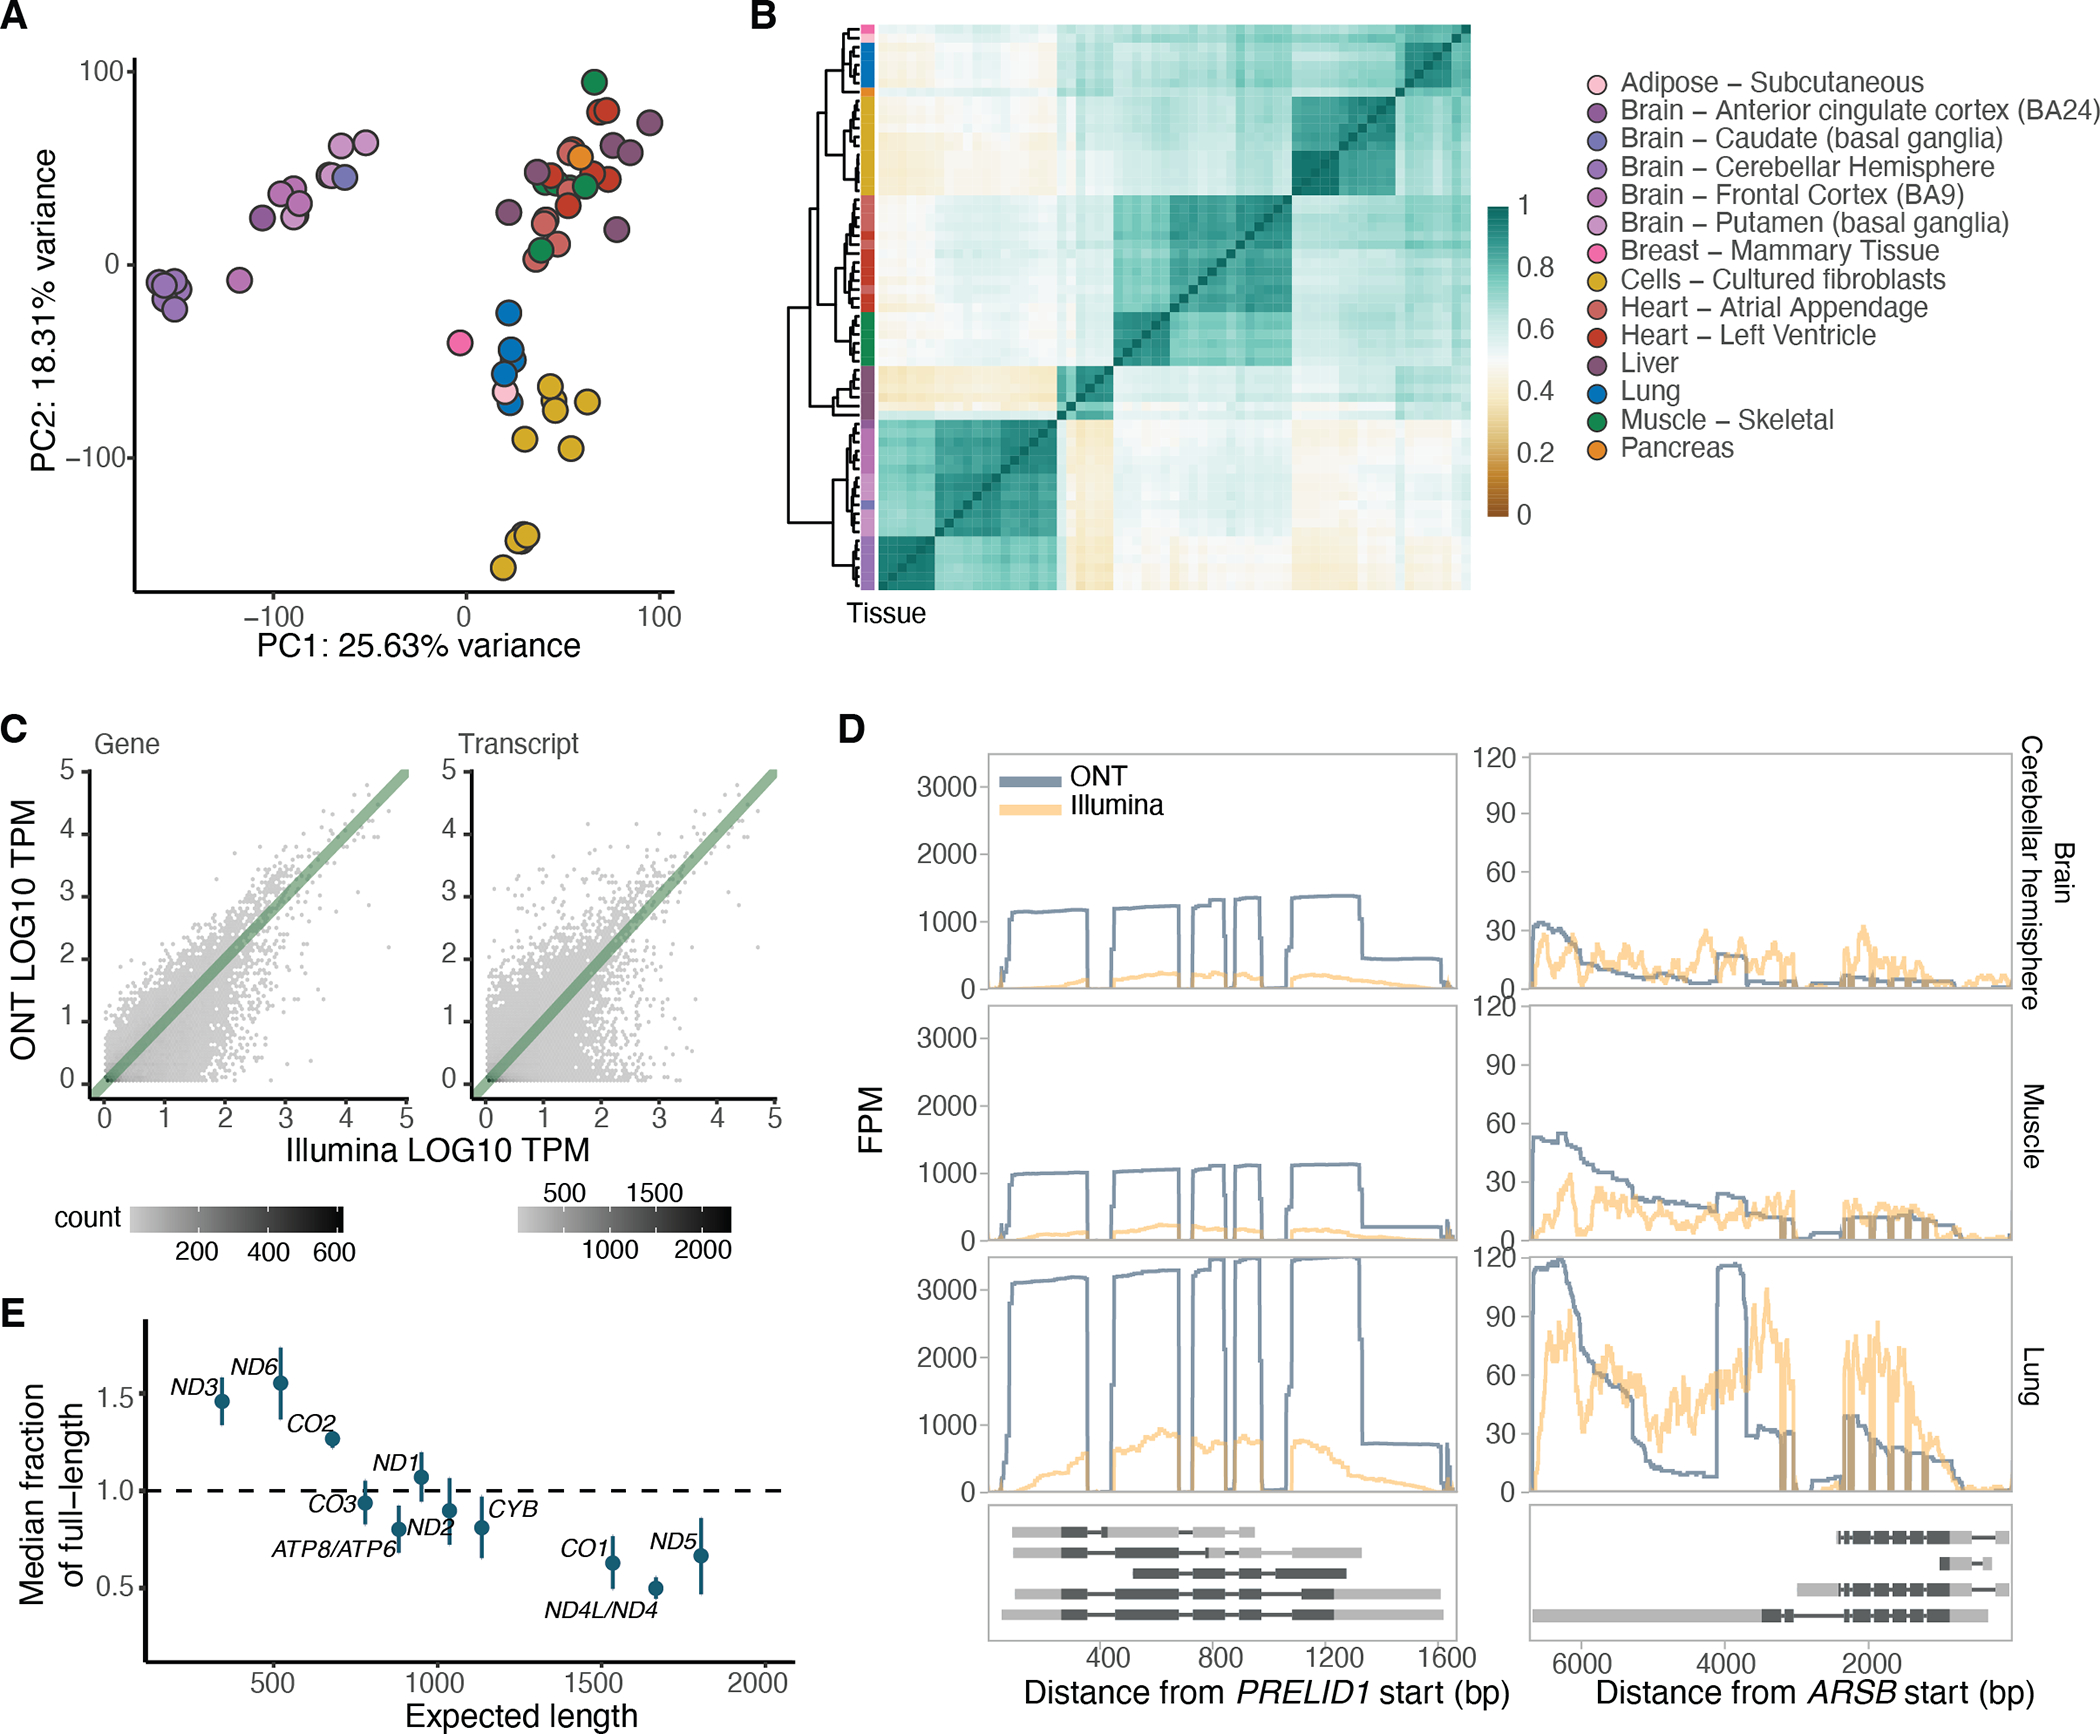
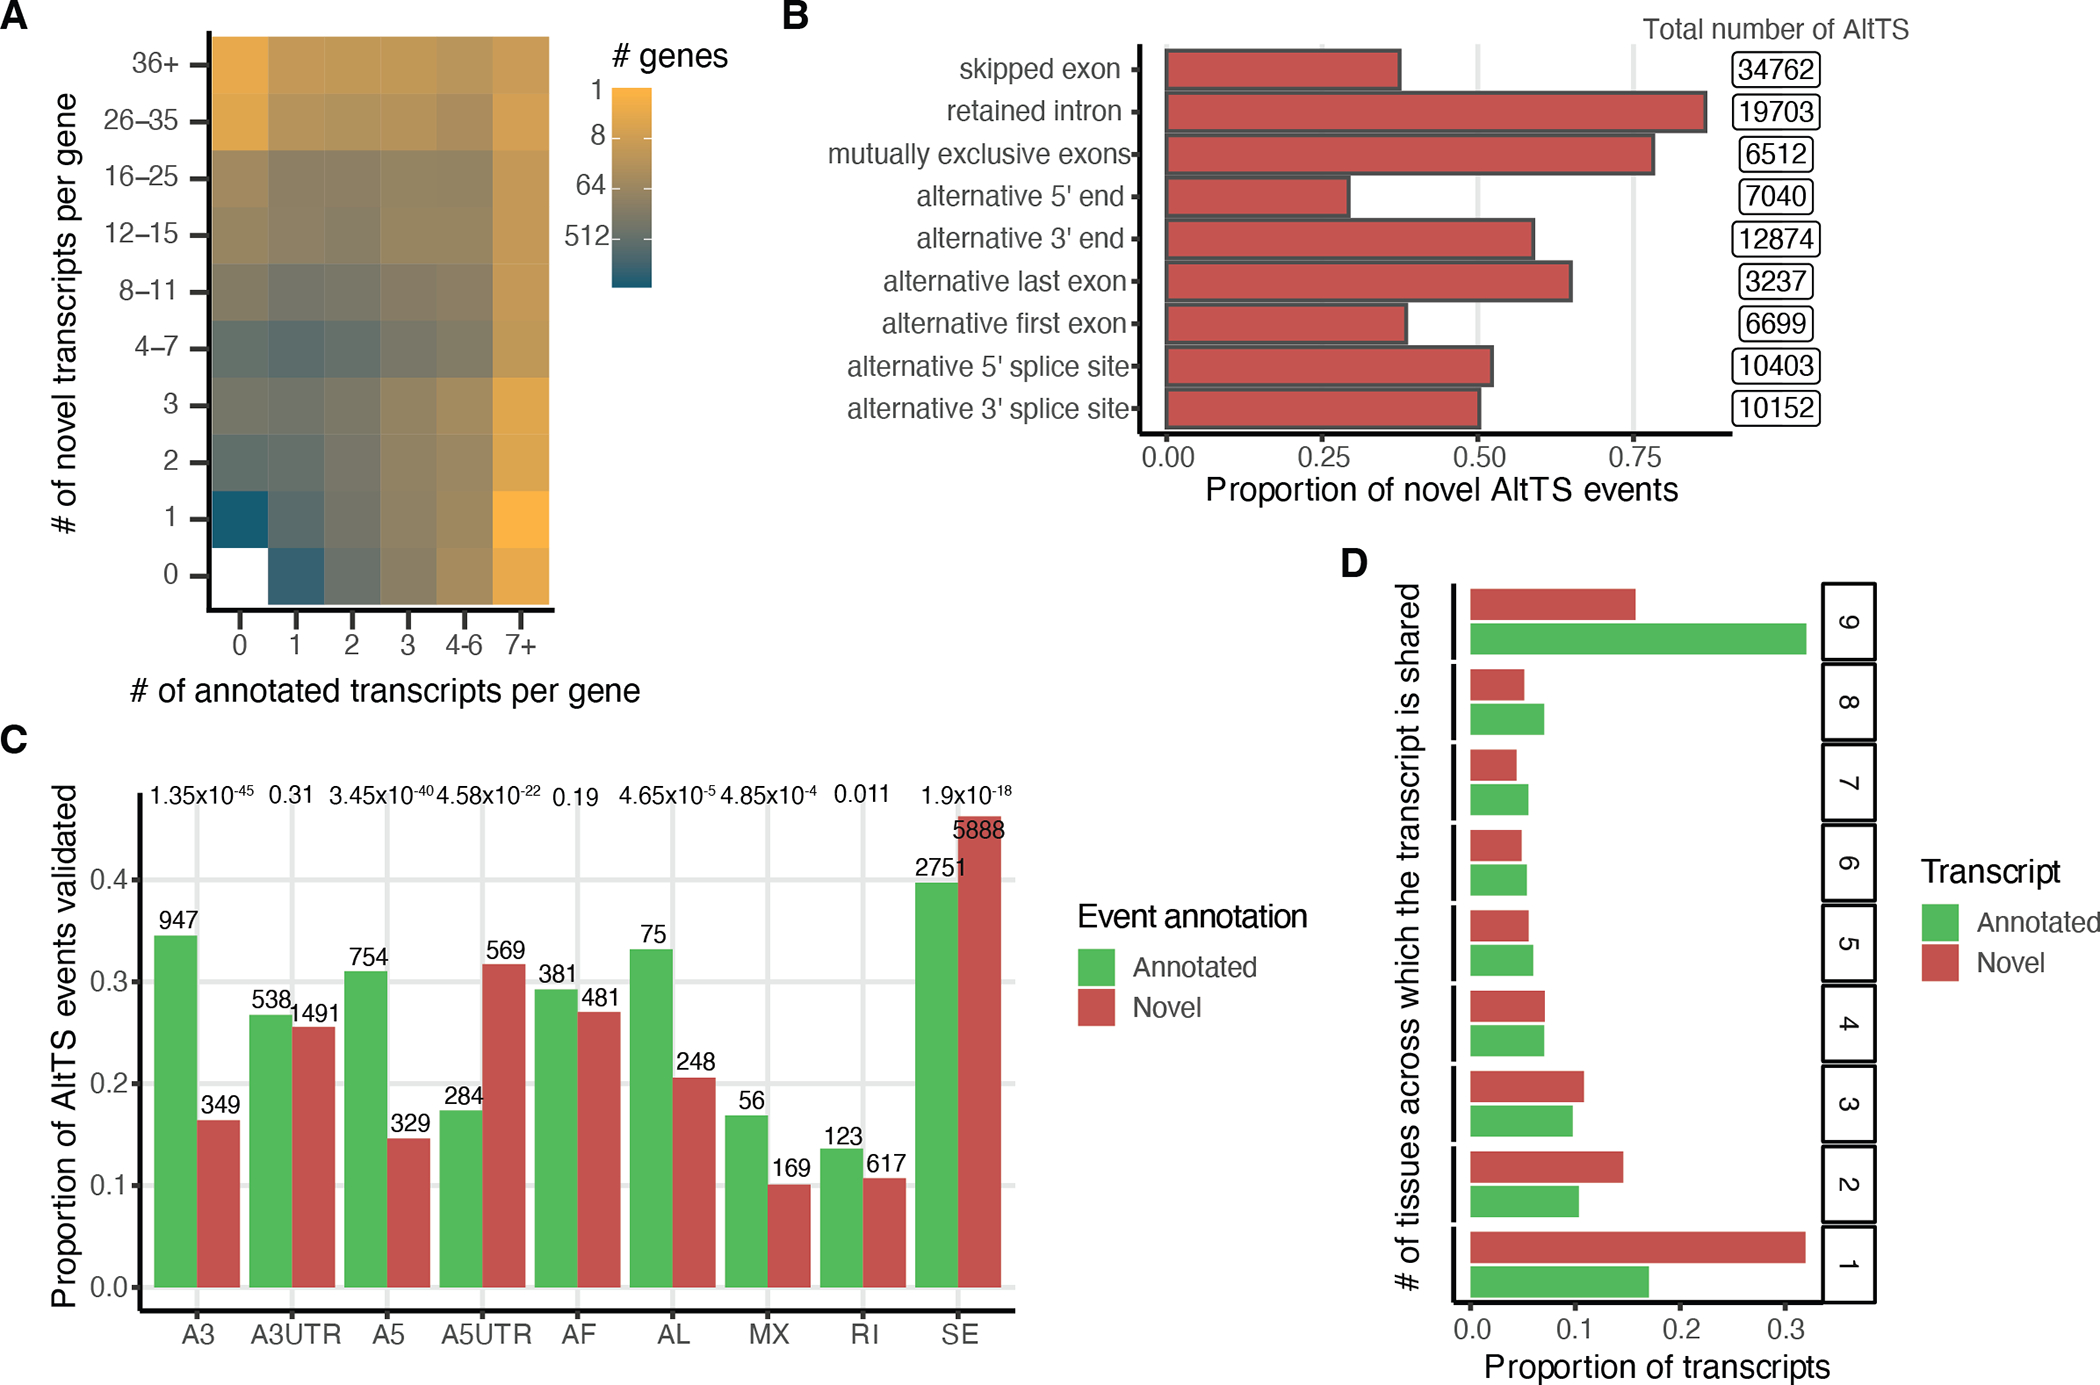
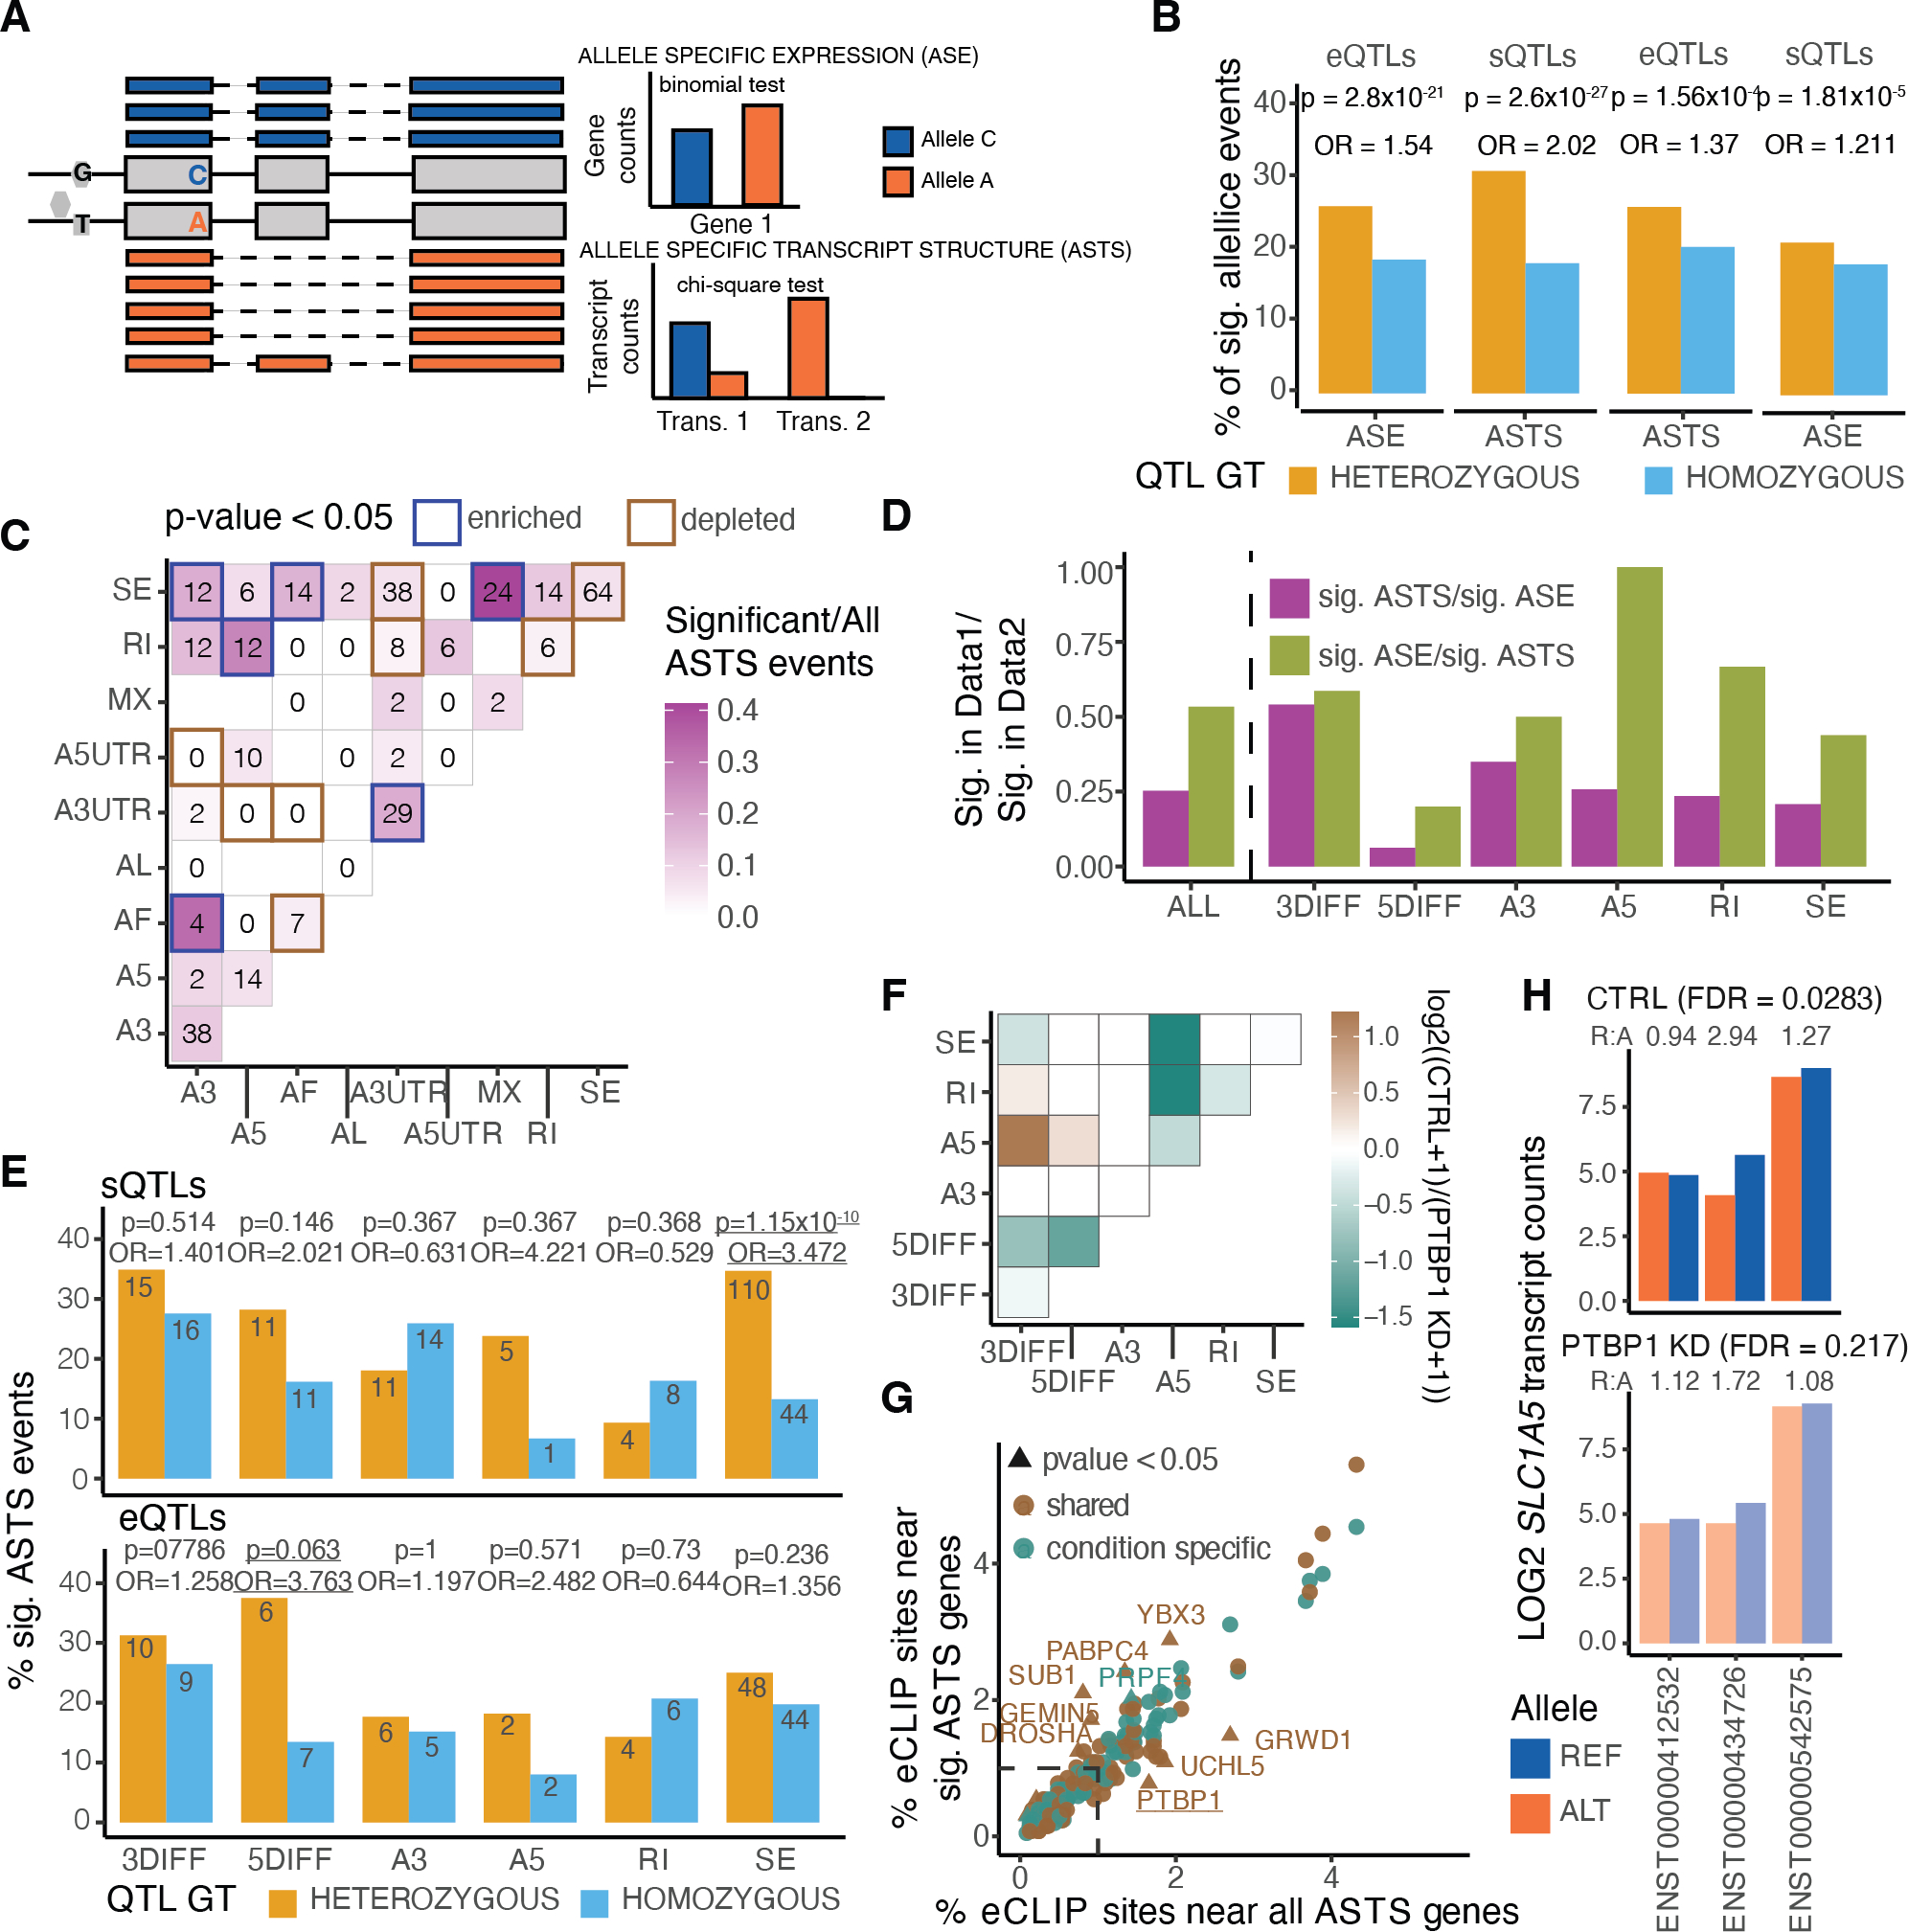
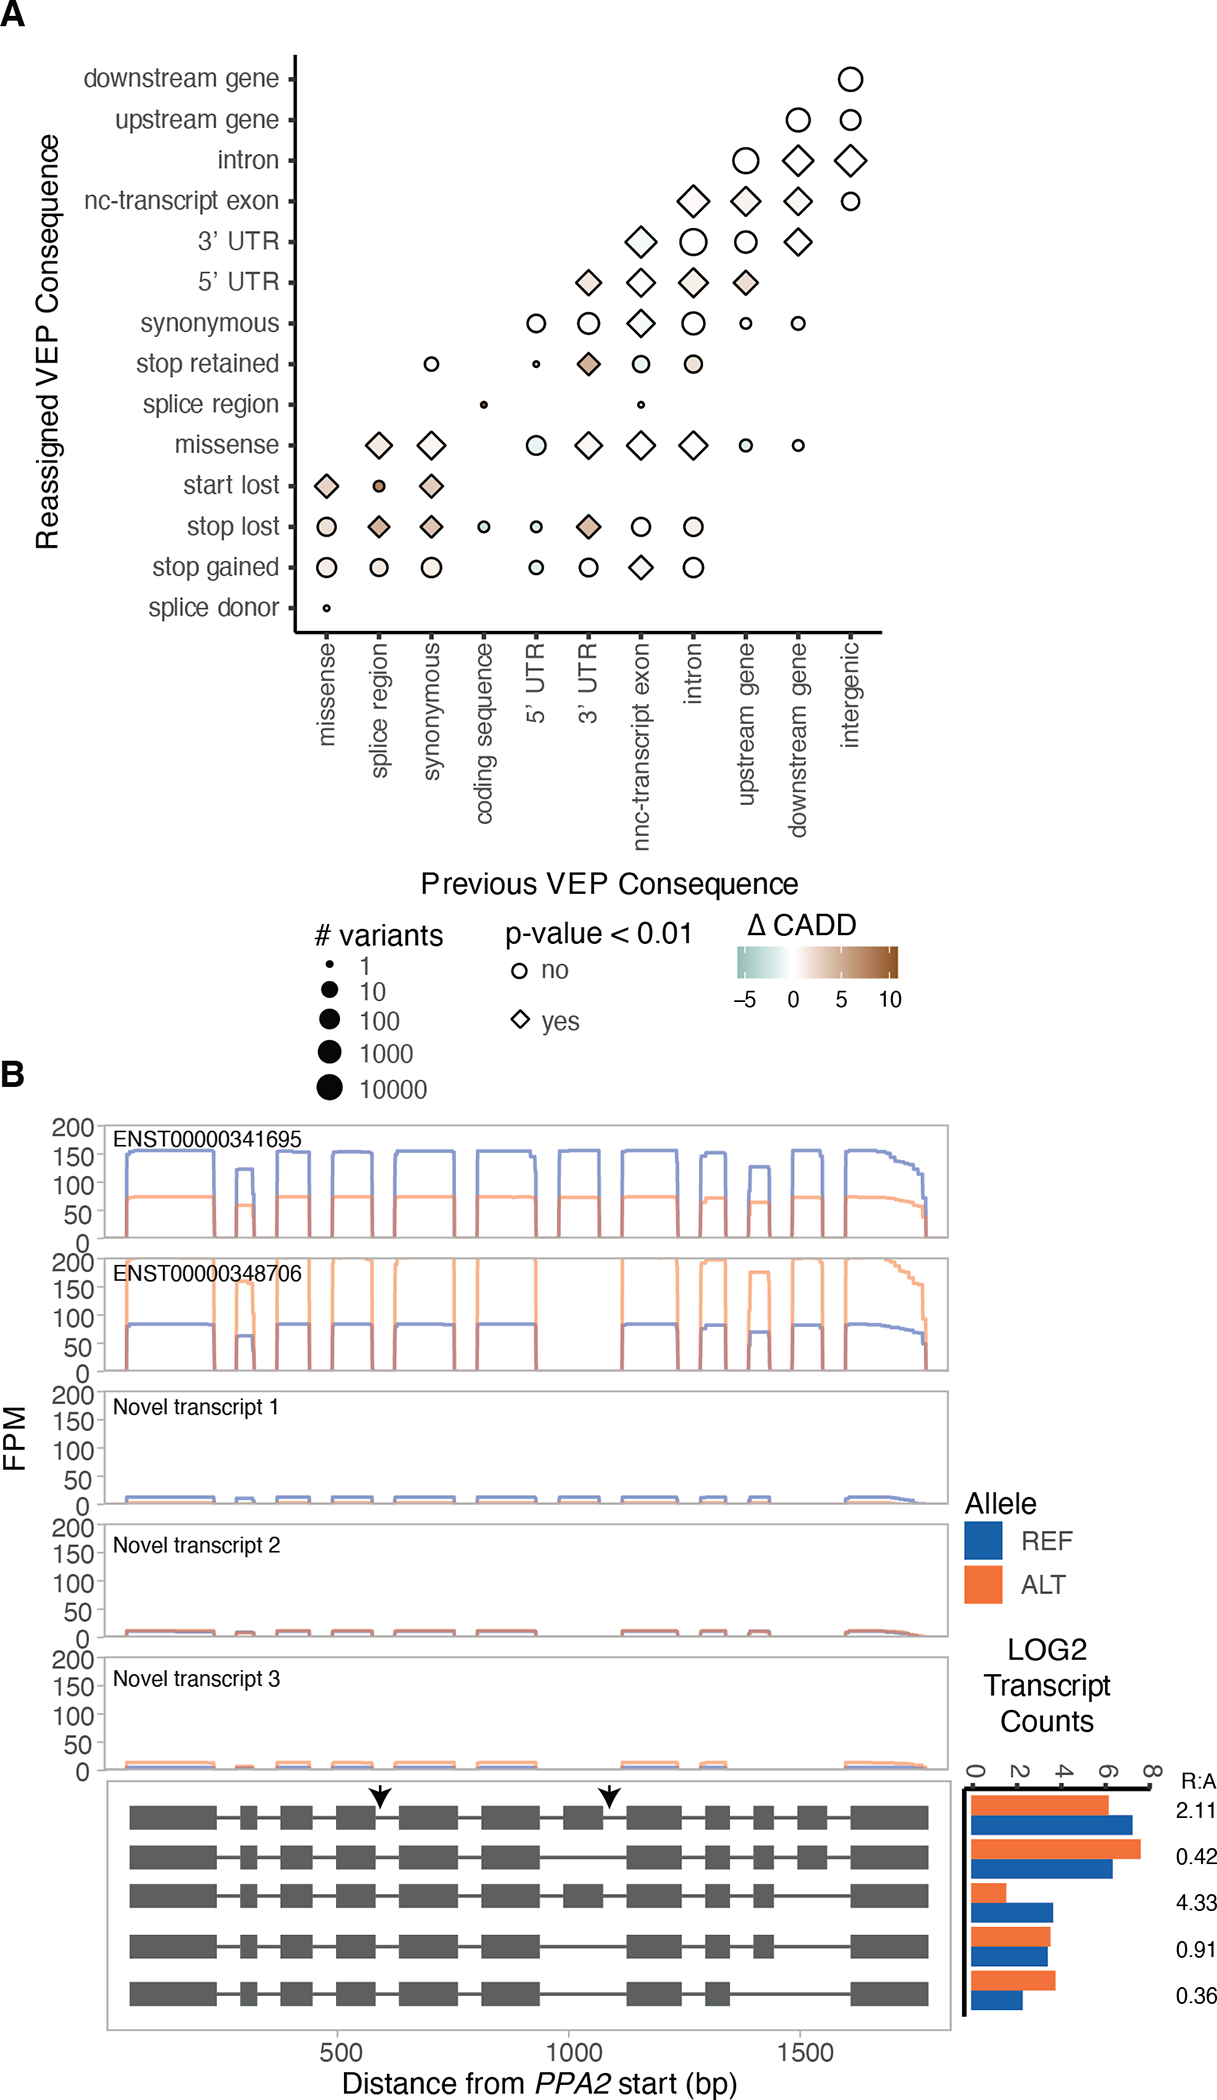
Regulation of transcript structure generates transcript diversity and plays an important role in human disease1-7. The advent of long-read sequencing technologies offers the opportunity to study the role of genetic variation in transcript structure8-16. In this Article, we present a large human long-read RNA-seq dataset using the Oxford Nanopore Technologies platform from 88 samples from Genotype-Tissue Expression (GTEx) tissues and cell lines, complementing the GTEx resource. We identified just over 70,000 novel transcripts for annotated genes, and validated the protein expression of 10% of novel transcripts. We developed a new computational package, LORALS, to analyse the genetic effects of rare and common variants on the transcriptome by allele-specific analysis of long reads. We characterized allele-specific expression and transcript structure events, providing new insights into the specific transcript alterations caused by common and rare genetic variants and highlighting the resolution gained from long-read data. We were able to perturb the transcript structure upon knockdown of PTBP1, an RNA binding protein that mediates splicing, thereby finding genetic regulatory effects that are modified by the cellular environment. Finally, we used this dataset to enhance variant interpretation and study rare variants leading to aberrant splicing patterns.


Conflict of interest statement

Conflicts of interest: DAG is currently a fellow at Vertex Pharmaceuticals. XD, EDH, and SJ are employees of Oxford Nanopore Technologies and are shareholders and/or share option holders. FA has been an employee of Illumina, Inc., since 8 November 2021. PTE has received sponsored research support from Bayer AG and IBM Health, and he has served on advisory boards or consulted for Bayer AG, MyoKardia and Novartis; none of these activities are related to the work presented here. DGM is a founder with equity in Goldfinch Bio, a paid advisor to GSK, Insitro, Third Rock Ventures, and Foresite Labs, and has received research support from AbbVie, Astellas, Biogen, BioMarin, Eisai, Merck, Pfizer, and Sanofi-Genzyme; none of these activities are related to the work presented here. BC is currently employed at Third Rock Ventures. The other authors declare no competing interests.

Figures

Extended Figure 1:
Extended Figure 1:. Quality control of the dataset.
A) Number and B) median length of raw and aligned reads per sample. The diagonal lines correspond to intercept = 0. With the dashed black circle, we highlight the two samples sequenced using the direct-cDNA technology. C) Read number and read length in two fibroblast cell line samples (one of which was sequenced in replicate) that were sequenced using both the direct-cDNA and the PCR-cDNA protocol for 48 hours. P-values were calculated using a two-sided t-test. Error bars: standard deviation from the mean. D) Hierarchical clustering using Euclidean distance for replicate samples aligned to GENCODE for transcripts with expression above 3 TPM in at least 5 samples. E) Principal component analysis using all 88 samples aligned to GENCODE (v26) for transcripts with expression above 3 TPM in at least 5 samples.
Extended Figure 2:
Extended Figure 2:. Comparison between ONT and Illumina gene expression.
A) Correlation between the transcriptome of each sample quantified by ONT and by Illumina sequencing technologies. B) Normalized gene and transcript expression for high residual (|residual| > 1) genes and transcripts retrieved from the Spearman correlation analysis. C) Characteristics of genes and D) transcripts with high or low residuals with respect to gene/transcript length, number of transcripts per gene and number of exons per transcript.
Extended Figure 3:
Extended Figure 3:. Three prime bias analysis using mitochondrial reads.
A) Observed versus expected read length for one sample sequenced using both direct (Spearman R2=0.3) and PCR cDNA (Spearman R2=0.26) protocols. The discrete clusters below the diagonal represent incorrect assignments to GENCODE isoforms (potential novel transcripts), and the diffuse shading represents fragmented RNA. Relationship between the expected transcript read length and the fraction of observed nanopore poly(A) RNA reads over the expected full length by sample for B) all samples and C) only fibroblasts. Labels are for mitochondrial genes without the MT prefix. The median was calculated per sample and error bars represent standard deviation. D) Median fraction of full-length per method by which RNA was isolated. E) Comparison of alternative transcription structure events found in highly expressed transcripts in the top and bottom 10% of samples ranked by 3’ bias. We observed no difference between the two deciles when using a two-sided proportionality test.
Extended Figure 4:
Extended Figure 4:. FLAIR transcript characterisation.
A) FLAIR transcripts comparison to GENCODE with respect to different genomic levels. The difference between intron chain and transcript is that the former only looks at matching the intron boundaries, therefore allowing variation in the UTR regions. B) Transcript length and C) number of exons per transcript classified by comparison to GENCODE. D) Number of overlapping transcripts between the ones identified in this paper and the ones released by a) CHESS and b) Workman.
Extended Figure 5:
Extended Figure 5:. Protein validation analysis of transcripts from matched tissues.
A) Percentage of validated transcripts at the protein level using mass spectrometry for different TPM thresholds. Each point represents the mean across n=7 assayed tissues and error bars represent the standard deviation. B) Mean expression per tissue with over one sample (lung, liver, heart, muscle and brain) of annotated and novel transcripts stratified by their validation status. The vertical line denotes the 5TPM threshold used. C) Percentage of validated transcripts at the protein level using mass spectrometry per primary tissue. D) Proportion of the AltTS events validated per tissue. E) MLF1 is an example of a gene with multiple highly-expressed transcripts across both muscle and heart tissues with a different transcript validated in each tissue. A3: alternative 3’ splice site; A5: alternative 5’ splice site; AF: alternative first exon; AL: alternative last exon; A3UTR: alternative 3’ end; A5UTR: alternative 5’ end; MX: mutually exclusive exons; RI: retained intron; SE: skipped exon.
Extended Figure 6:
Extended Figure 6:. Transcript expression overview of novel and annotated transcripts.
A) Hierarchical clustering using euclidean distance and B) principal component analysis for selected samples aligned to GENCODE for transcripts with expression above 5 TPM in at least 3 samples separated based on whether they are novel or not. C) Proportion of transcripts expressed at different TPM thresholds and classified based on how many tissues express the transcript in at least two samples. The total number of transcripts per group and threshold is included in the legend.
Extended Figure 7:
Extended Figure 7:. Differential transcript expression and usage between tissues.
Heatmap of number of differentially A) upregulated transcripts and B) used transcripts (FDR ≤ 0.05) in pairwise comparison of tissues with at least five samples. In differential expression analysis we identify up- or down-regulated transcripts per pairwise comparison (asymmetrical heatmap) while in the differential transcript usage analysis there is no direction of effect (symmetrical heatmap). C) Number of differentially expressed or used transcripts that were specific to that tissue. D) Median gene expression across all transcripts that are specific to a tissue.
Extended Figure 8:
Extended Figure 8:. LORALS pipeline development and aligning statistics.
A) Pipeline for allele-specific analysis. Raw long-reads are first aligned to the genome using minimap2. This alignment is used to correct the phase of some of the heterozygous variants on the whole genome sequencing vcf. This new file is then used to generate personalized genome reference files against which the raw reads are again aligned using minimap2. The raw reads are also aligned to the transcriptome using minimap2. The VCF file along with the genome aligned reads and the transcriptome aligned reads are then fed into LORALS for allelic analysis. B) Percentage of switched haplotypes per donor informed by the long-read data. For this all samples from the same donor were merged to harmonize the files. C) Percentage of haplotype specific reads calculated as reads having a higher mapping score when using a personalized genome reference. D) Delta calculated as the difference in the start position of the aligned read between the genome aligned and the personalized genome aligned reads. Not shown are the reads that had Delta = 0. E) Reference ratio for the samples present in this study sequenced using Illumina technology and ONT technology aligned with two different approaches.
Extended Figure 9:
Extended Figure 9:. LORALS pipeline allele specific analysis filter setting.
A) Reference ratio and B) normalised reads counts across different Illumina and ONT flags for both of these sequencing technologies. Mapping bias: mapping bias in simulations; Low mappability: low-mappability regions (75-mer mappability < 1 based on 75mer alignments with up to two mismatches based on the pipeline for ENCODE tracks and available on the GTEx portal); Genotype warning: no more reads supporting two alleles than would be expected from sequencing noise alone, indicating potential genotyping errors (FDR < 1%); Blacklist: ENCODE blacklist. Multi-mapping: regions with multi-mapping reads constructed using the alignability track from UCSC using a threshold of 0.1 (so that a 100kmer aligning to that site aligns to at least 5 other locations in the genome with up to 2 mismatches); Other allele warning: regions where the proportion of ref or alt containing reads is lower than 0.8; High indel warning: sited where the proportion of non-indel containing is lower than 0.8. C) Reference ratios and normalised reads counts of all kept sites across Illumina and ONT sequencing technologies. D) Distribution of the high indel warning ratios and the other allele ratios across all samples. E) Proportion of genes with at least 20 overlapping reads flagged per filter. The proportion was calculated across all genes for each sample (n=59). The center corresponds to the median, the lower and upper hinges correspond to the 25th and 75th percentiles and the whiskers extend from the hinge to the smallest/largest value no further than 1.5 * inter-quartile range from the hinge.
Extended Figure 10:
Extended Figure 10:. Allele specific analysis on all GTEx samples.
A) Estimated power for different number of transcripts (2, 3 or 5) with respect to the coverage (x-axis) for effect sizes 0.1 (low), 0.3 (medium) and 0.5 (high), derived from simulated count data. B) Number of genes tested for allele-specific expression (ASE) and allele-specific transcript structure (ASTS) and number of significant genes. The diagonal indicates the median percentage of significant genes (9% and 9%, respectively). C) Number of transcripts per gene tested for ASTS. D) Number of genes with allelic data across donors per tissue for ASE and ASTS. E) Total number of genes calculated per sample (n=59) at different levels of powerOutliers are hidden for ease of viewing. The center corresponds to the median, the lower and upper hinges correspond to the 25th and 75th percentiles and the whiskers extend from the hinge to the smallest/largest value no further than 1.5 * inter-quartile range from the hinge.
Extended Figure 11:
Extended Figure 11:. Comparison of allele specific expression between ONT and Illumina
A) Proportion of significant ASE genes discovered using Illumina or ONT and replicated in the other method. Pi1 calculations are carried out up to p-value = 0.5. B) Log allelic fold-change of Illumina and ONT of the shared ASE genes. C) Number of ASE events with opposite directions between ONT and Illumina per sample. Highlighted are the five fibroblast cell lines that were further cultured prior to sequencing, where 12/57 events were observed. RNA-seq read pile-ups for D) CCDC69 and E) ACSSL3 which have ASE in the opposite direction between the two methods. In red is shown the variant used to parse the reads between the two haplotypes. CCDC69 differences can be attributed to a depression in the Illumina read pile-ups while ACSSL3 can be attributed to the variant being in the 3’UTR, which is not well captured by Illumina reads. F) Venn diagram of the significant ASE genes discovered by Illumina and ONT. The LOG2 of total counts for each method is shown for each group of the Venn diagram.
Extended Figure 12:
Extended Figure 12:. Alternative transcript structure event annotation of allele specific events.
A) Percentage of genes displaying a single alternative transcript structure event. P-values were calculated using a two-sided binomial test. A3: alternative 3’ splice site; A5: alternative 5’ splice site; AF: alternative first exon; AL: alternative last exon; A3UTR: alternative 3’ end; A5UTR: alternative 5’ end; MX: mutually exclusive exons; RI: retained intron; SE: skipped exon. B) Average relative location of heterozygous variant used for ASTS event, by grouping all the transcripts of an ASTS event together. C) Read pile-ups per transcript for the two donors displaying ASTS in DUSP13 gene. In the lower panel the transcript structure is shown, without details of the coding sequence. D) Transcript percentage for four of the five DUSP13 annotated transcripts with high read coverage in the GTEx v8.
Extended Figure 13:
Extended Figure 13:. Differential expression analysis between PTBP1-KD and control samples.
A) Volcano plot from differential gene expression between control and samples with PTBP1 knockdown using ONT data. P-values were calculated using the Wald test in DESeq2. B) Gene expression profile in PTBP1 and PTBP2 genes (PTBP2 under normal circumstances has its expression restricted to the brain). C) Proportion of different alternative transcript structure events in transcripts upregulated in the control or the PTBP1 knockdown samples. P-values were calculated using a two-sided proportionality test.
Extended Figure 14:
Extended Figure 14:. Allele specific analysis of PTBP1-KD and control samples.
A) Correlation between the control and the PTBP1 knockdown samples in the reference ratio of gene expression and transcript structure. B) Changes in ASTS by PTPB1 knockdown, as assayed by gridION, with the heatmap showing the co-occurrence of alternative transcript structure events that are observed at least once per each event (or a single time for the diagonal) in a given gene. Color corresponds to the log2 ratio of the number of events found in the control over PTBP1 knockdown (KD) samples. C) Number of significant ASE and ASTS genes found by GridION categorized based on their status in the PromethION data from the same samples. D) Proportion of genes displaying allele-specific patterns specifically in either control or PTBP1 knockdown samples. E) SLC1A5 gene transcript read pile-ups which display significant ASTS only in the control sample only. The arrow indicates the location of the PTBP1 eCLIP site which contains a heterozygous variant in that donor.
Extended Figure 15:
Extended Figure 15:. Variant interpretation through novel transcripts and allele-specific transcript structure analysis.
A) Number of variants per variant effect predictor (VEP) category using GENCODE v26 protein-coding genes with or without novel FLAIR transcripts. B) CADD score distribution of variants that were reassigned to a more severe consequence when the GENCODE gene annotations were complemented with the novel FLAIR transcripts, compared to variants that retained their annotation (down sampled to a similar size). P-values from two-sided t-test. The center corresponds to the median, the lower and upper hinges correspond to the 25th and 75th percentiles and the whiskers extend from the hinge to the smallest/largest value no further than 1.5 * inter-quartile range from the hinge. C) Percentage of variants per clinical significance category that get reassigned when supplementing the gene annotation with the novel transcripts. The numbers above the bars correspond to the number of re-assigned variants. D) Number of rare variants per ASTS gene (10kb window around gene). E) Proportion of rare heterozygous variants per annotation in significant ASTS events. As a background all ASTS events were used, and p-values were calculated using a two-sided binomial testing. F) Enrichment of the significant ASTS genes within splicing outliers. As a background all ASTS genes were used and p-values were calculated using a two-sided binomial test. G) NDUFS4 as an example of a gene with a rare heterozygous variant in a sample that is a GTEx splicing outlier and has significant ASTS, with read pileups, with grey arrows indicating the rare variants. Log normalised transcript counts per allele are plotted per transcript, with the REF:ALT ratios marked for each.
Figure 1:
Figure 1:. Overview and quality control of the dataset.
A) Principal component analysis of samples with replicates merged, without K562 cell lines and without PTBP1 knockdown samples, based on GENCODE transcript expression (>3 TPM in >5 samples). B) Hierarchical clustering of samples based on correlation of transcript expression (as in A), using Euclidean distance. C) Example of gene and transcript expression correlation between Illumina and ONT in the muscle tissue of GTEX-1LVA9. D) Two examples of genes displaying low correlation between ONT and Illumina. PRELID1 was better captured by ONT than Illumina, while ARSB had 3’ bias when assayed by ONT. They are shown across three different tissues and all protein-coding transcripts are plotted below. FPM: Fragments per million. E) Relationship between the expected transcript read length and the fraction of observed nanopore poly(A) RNA reads over the expected full length. Labels are for mitochondrial genes without the MT prefix. The transcript median was calculated per sample, and plotted is the median across all samples (n=90). Error bars represent standard deviation.
Figure 2:
Figure 2:. Discovery of new transcripts and comparison between tissues.
A) Number of annotated and novel transcripts per gene quantified in our dataset. B) Proportion of novel alternative transcript structure (AltTS) events across all quantified transcripts compared to GENCODEv26. C) Proportion of the AltTS events validated at the protein level by mass-spectrometry per novel or annotated. Enrichment was calculated using a two-sided proportionality test. D) Number of transcripts expressed at > 1 TPM in at least two samples and classified based on how many tissues express the transcript. A3: alternative 3’ splice site; A5: alternative 5’ splice site; AF: alternative first exon; AL: alternative last exon; A3UTR: alternative 3’ end; A5UTR: alternative 5’ end; MX: mutually exclusive exons; RI: retained intron; SE: skipped exon.
Figure 3:
Figure 3:. Allelic analysis of long-read data.
A) Illustration of allele specific analysis framework, data input and testing performed. B) Percentage of significant allele specific expression and transcript structure events for samples that are heterozygous or homozygous for a lead eQTL or sQTL variant for that gene. P-values from two-sided Fisher’s exact test. C) Co-occurrence of alternative transcript structure events within the transcripts used for ASTS analysis that are observed at least once per each event (or a single time for the diagonal) in a given gene. P-values from two-sided binomial test. D) Sharing of ASE and ASTS events for all events, and stratified by AltTS event. E) Percentage of significant ASTS for samples that are heterozygous or homozygous for a lead eQTL or sQTL variant for that gene, respectively, by type of event based on whether at least 50% of the differences in transcript can be assigned to that AltTS event. P-values from two-sided Fisher’s exact test. F) Changes in ASTS by PTPB1 knockdown, with the heatmap showing the co-occurrence of alternative transcript structure events that are observed at least once per each event (or a single time for the diagonal) in a given gene. Color corresponds to the log2 ratio of the number of events found in the control (CTRL) over PTBP1 knockdown (KD) samples. G) Percentage of eCLIP sites near genes tested for ASTS, annotated using a 10kb window. Genes stratified into shared or condition specific based on the overlap between control and PTBP1 knockdown. Marked are sets of peaks with p-value < 0.05 using a two-sided binomial test. H) Example of a gene, SLC1A5, where transcript read counts display significant ASTS only in the PTBP1 knock-down sample.
Figure 4:
Figure 4:. Variant interpretation through novel transcripts and allele-specific transcript structure analysis.
A) Difference in the mean CADD score of variants that were reassigned to a more severe consequence when the GENCODE gene annotations were complemented with the novel FLAIR transcripts, compared to variants that retained their annotation (down sampled to a similar size). P-values from two-sided t-test. B) PPA2 is an example of a gene with a rare heterozygous variant in a sample that is a GTEx splicing outlier and has significant ASTS, with read pileups, and grey arrows indicating the rare variants.

References

    1. Park E, Pan Z, Zhang Z, Lin L & Xing Y The Expanding Landscape of Alternative Splicing Variation in Human Populations. Am. J. Hum. Genet. 102, 11–26 (2018). - PMC - PubMed
    1. Nicolae DL et al. Trait-Associated SNPs Are More Likely to Be eQTLs: Annotation to Enhance Discovery from GWAS. PLoS Genet. 6, e1000888 (2010). - PMC - PubMed
    1. Li YI et al. RNA splicing is a primary link between genetic variation and disease. Science 352, 600–604 (2016). - PMC - PubMed
    1. Consortium GTEx. The GTEx Consortium atlas of genetic regulatory effects across human tissues. Science 369, 1318–1330 (2020). - PMC - PubMed
    1. Cummings BB et al. Improving genetic diagnosis in Mendelian disease with transcriptome sequencing. Sci. Transl. Med. 9, (2017). - PMC - PubMed

Methods References

    1. GTEx Consortium. Human genomics. The Genotype-Tissue Expression (GTEx) pilot analysis: multitissue gene regulation in humans. Science 348, 648–660 (2015). - PMC - PubMed
    1. Li H Minimap2: pairwise alignment for nucleotide sequences. Bioinformatics 34, 3094–3100 (2018). - PMC - PubMed
    1. De Coster W, D’Hert S, Schultz DT, Cruts M & Van Broeckhoven C NanoPack: visualizing and processing long-read sequencing data. Bioinformatics 34, 2666–2669 (2018). - PMC - PubMed
    1. Alasoo K Wiggleplotr: Make read coverage plots from bigwig files. (2017).
    1. Pertea M et al. CHESS: a new human gene catalog curated from thousands of large-scale RNA sequencing experiments reveals extensive transcriptional noise. Genome Biol. 19, 208 (2018). - PMC - PubMed

MeSH terms

Substances