. 2022 Aug;608(7922):429-435.
doi: 10.1038/s41586-022-05013-4. Epub 2022 Aug 3.

Architecture and self-assembly of the jumbo bacteriophage nuclear shell

Affiliations

Architecture and self-assembly of the jumbo bacteriophage nuclear shell

Thomas G Laughlin et al. Nature. 2022 Aug.

Abstract

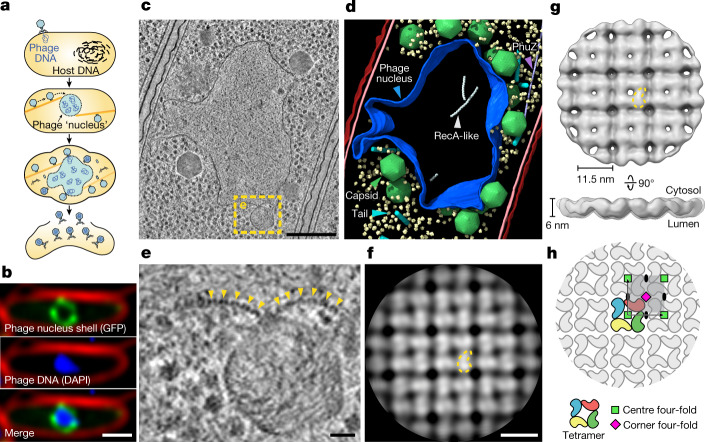
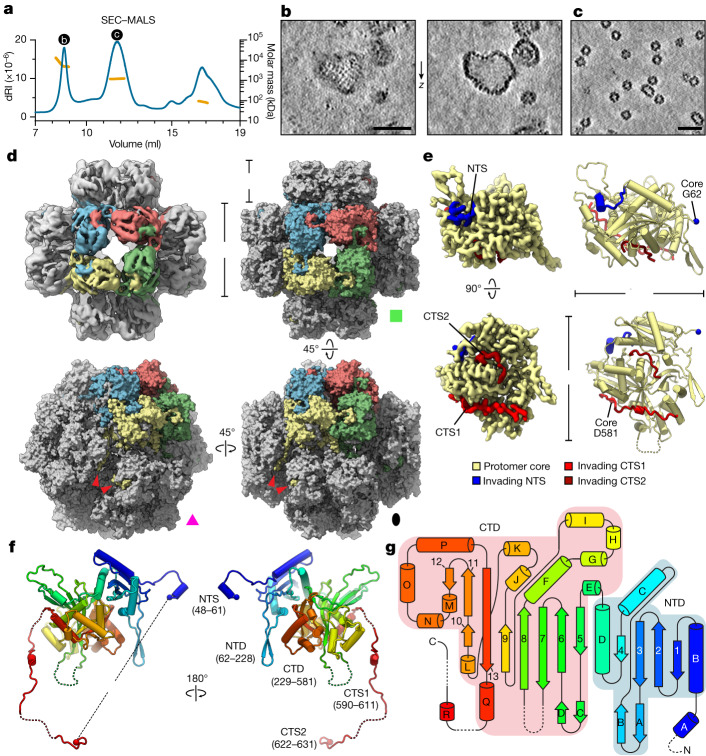
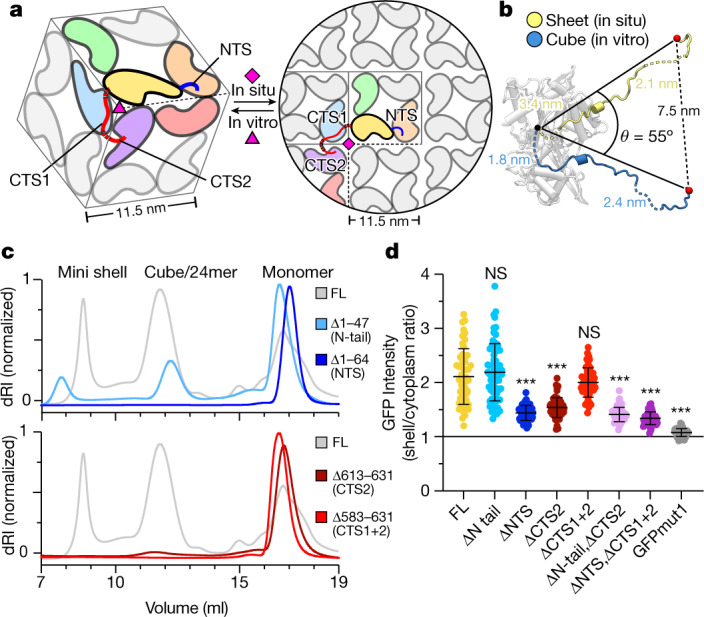
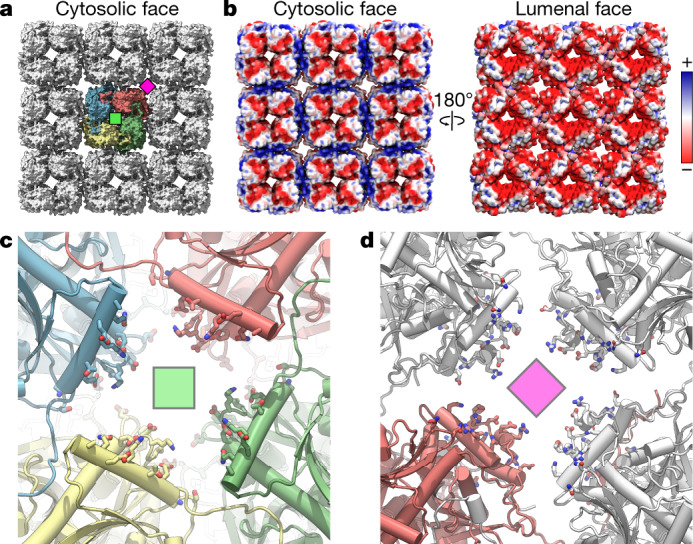
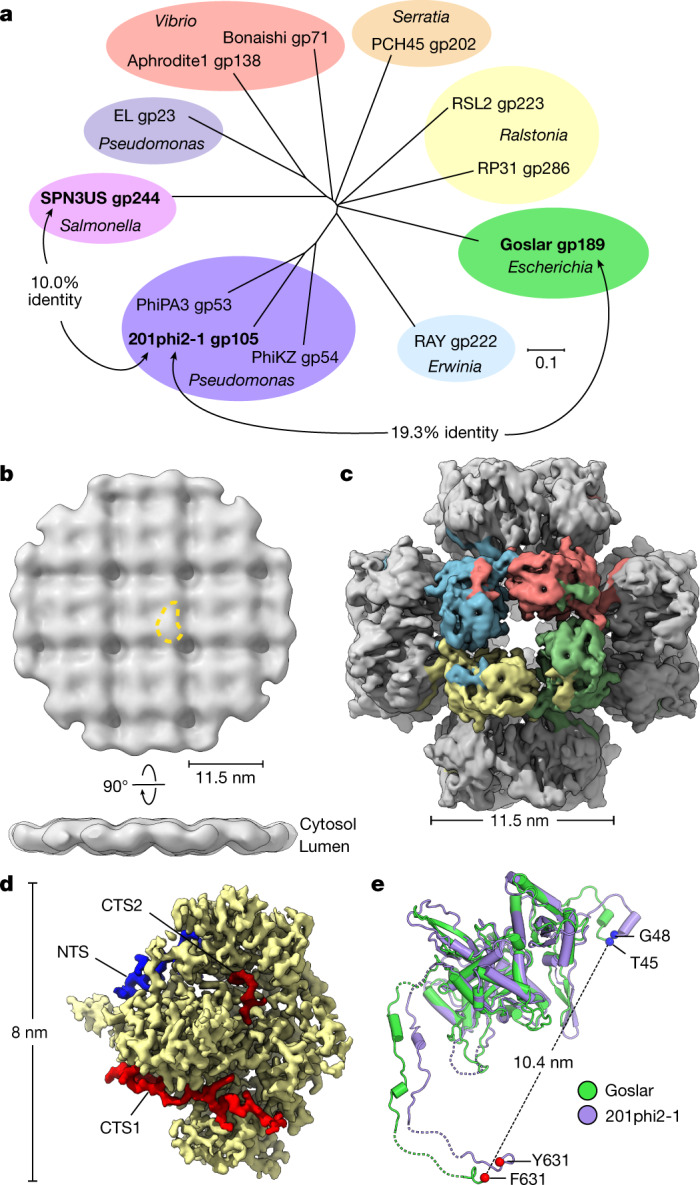
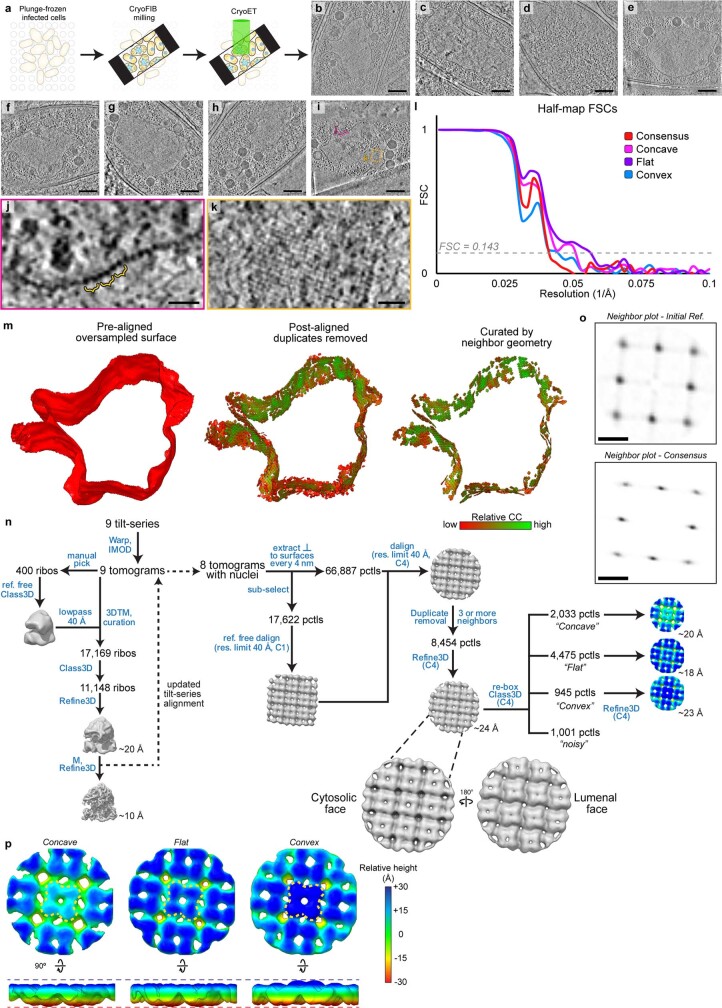
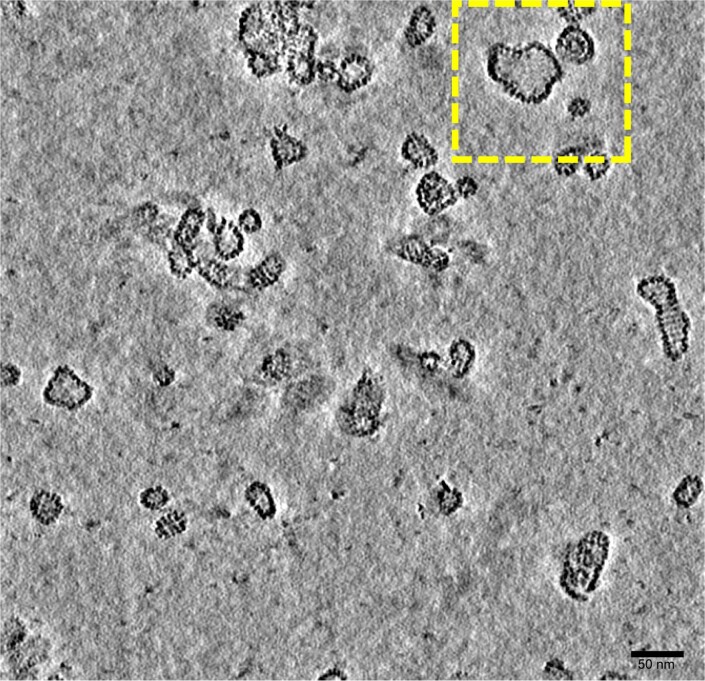
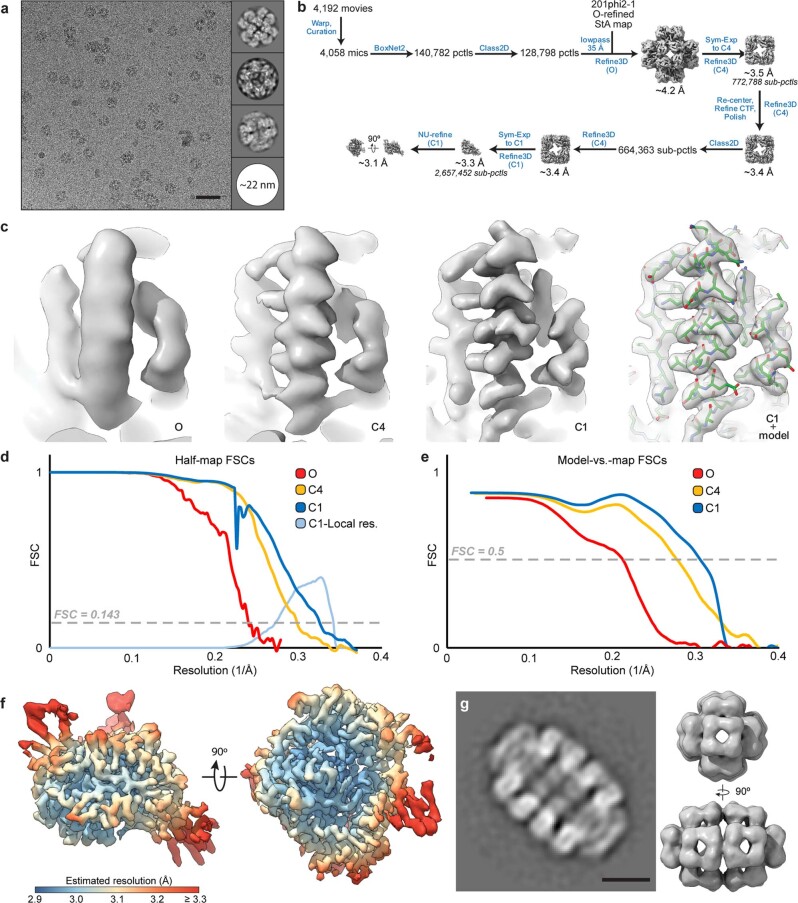
Bacteria encode myriad defences that target the genomes of infecting bacteriophage, including restriction-modification and CRISPR-Cas systems1. In response, one family of large bacteriophages uses a nucleus-like compartment to protect its replicating genomes by excluding host defence factors2-4. However, the principal composition and structure of this compartment remain unknown. Here we find that the bacteriophage nuclear shell assembles primarily from one protein, which we name chimallin (ChmA). Combining cryo-electron tomography of nuclear shells in bacteriophage-infected cells and cryo-electron microscopy of a minimal chimallin compartment in vitro, we show that chimallin self-assembles as a flexible sheet into closed micrometre-scale compartments. The architecture and assembly dynamics of the chimallin shell suggest mechanisms for its nucleation and growth, and its role as a scaffold for phage-encoded factors mediating macromolecular transport, cytoskeletal interactions, and viral maturation.


Conflict of interest statement

The authors declare no competing interests.

Figures

Fig. 1
Fig. 1. In situ tomography and subtomogram analysis of the 201phi2-1 phage nucleus.
a, Schematic of the jumbo phage infection cycle. b, Fluorescence microscopy of a 201phi2-1-infected P. chlororaphis cell at 45 mpi (n = 5 independent experiments). Phage nucleus shell component gp105 (green) is tagged with GFP, phage DNA (blue) is stained with DAPI and the outer cell membrane (red) is stained with FM4-64. c, Tomographic slice of a phage nucleus in a 201phi2-1-infected P. chlororaphis cell at 50–60 mpi. d, Segmentation of the tomogram in c. Outer and inner bacterial membranes are shown in burgundy and pink, respectively. The phage nucleus is coloured blue. Phage capsids and tails are green and cyan, respectively. PhuZ and RecA-like protein filaments are light purple and white, respectively. A subset of 500 host ribosomes is shown in pale yellow. e, Enlarged view of the boxed region in c. Yellow arrows point to the repetitive feature of the phage nucleus perimeter. f, Slice of the cytosolic face of the subtomogram average of the repetitive feature in the phage nucleus perimeter with a comma-shaped subunit outlined in yellow. g, Cytosolic and side views of the shell subtomogram average isosurface with a single subunit outlined in yellow. h, Schematic representation of the p442-like arrangement of chimallin protomers. A ‘centre’ four-fold symmetry is indicated by a green square and a ‘corner’ four-fold symmetry is indicated by a magenta square. Scale bars: 1 μm (b), 250 nm (c), 25 nm (e) and 10 nm (f).
Fig. 2
Fig. 2. In vitro cryo-EM structure of the 201phi2-1 phage nuclear shell protein chimallin.
a, SEC–MALS analysis of purified 201phi2-1 chimallin. The measured molar masses of the three peaks are 6.9 MDa (range 4–13 MDa), 1.2 MDa and 87 kDa (left to right). dRI, differential refractive index. See Extended Data Fig. 5 for molar mass measurements by SEC–MALS. b,c, Z-slices from tomograms of samples from the correspondingly labelled SEC–MALS peaks in a. The full field of view of b is provided in Extended Data Fig. 2. d, Top left, O-symmetrized reconstruction of the chimallin cubic assembly viewed along the four-fold axis. The protomers of one four-fold face are coloured. Top right, surface representation of the chimallin cubic assembly model viewed along the four-fold axis. Bottom right and bottom left, views of the model along the two-fold and three-fold axes, respectively. Red arrowheads point to the C-terminal segments of the yellow protomer. The green square, pink triangle and black oval indicate that the corresponding panels are viewed down the particle’s four-fold, three-fold and two-fold rotational symmetry axes, respectively. e, Localized asymmetric reconstruction of the chimallin protomer (left) and cartoon model (right). Invading N- and C-terminal segments from neighbouring protomers are coloured blue (NTS), red (CTS1) and burgundy (CTS2). Resolved core protomer termini are shown as spheres. f, Rainbow-coloured cartoon model of the chimallin protomer conformation in the cubic assembly. Resolved N and C termini are shown as spheres. Domains and segments are labelled. Unresolved linkers are shown as dashed lines. g, A rainbow-coloured fold diagram of chimallin (blue at N terminus, red at C terminus) with α-helices labelled alphabetically and β-strands labelled numerically. The N- and C-terminal domains are highlighted in blue and red, respectively. Dashed lines indicate unresolved loops. Scale bars, 50 nm. Source data
Fig. 3
Fig. 3. Flexibly attached N- and C-terminal segments mediate self-assembly of the chimallin shell.
a, Protomer packing in the cubic 24mer assemblies (left) and flat sheet model (right). One protomer is coloured yellow with NTS in blue and CTS1/CTS2 in red. Protomers interacting directly with this focal protomer are coloured orange, green, blue, purple and red. Non-interfacing protomers are grey. Red dashed lines indicate locations of unresolved linkers, and pink symbols indicate 3- or 4-fold symmetry axes. b, Comparison of chimallin C terminus conformation in the in vitro sheet and the in situ cube. Distances spanned by each disordered segment (CTD–CTS1: residues 582–589 and CTS1–CTS2: residues 612–621) in the two models are noted. c, SEC–MALS of N- and C-terminal truncation mutants (ΔN tail, Δ1–47 (residues 48–631 are present); ΔNTS, Δ1–64 (residues 65–631 are present); ΔCTS2, Δ613–631 (residues 1–611 are present); ΔCTS1+2, Δ583–631 (residues 1–582 are present). See Extended Data Fig. 5 for molar mass measurements by SEC–MALS. d, Relative incorporation of eGFP–chimallin variants into the 201phi2-1 phage nucleus of infected P. chlororaphis cells. Incorporation is calculated as the ratio of GFP fluorescence per pixel in the shell versus outside the shell (details in Extended Data Fig. 6). Data are mean ± s.d. Unpaired t-test between a given variant and full-length (FL) (n = 67 cells); ***P < 0.0001; ΔN tail: n = 51, P = 0.4131; ΔNTS: n = 53, P < 0.0001; ΔCTS1 (residues 1–611): n = 54, P < 0.0001; ΔCTS1+2: n = 50, P = 0.1884; ΔN tail, ΔCTS2 (residues 48–611): n = 58, P < 0.0001; ΔNTS, ΔCTS1+2 (residues 65–582): n = 63, P < 0.0001; eGFP: n = 60, P < 0.0001. The threshold for significance was Bonferroni-corrected to P < 0.007 to account for multiple hypothesis testing. Source data
Fig. 4
Fig. 4. Electrostatics and pores of the chimallin shell.
a, Surface model of the 3 × 3 chimallin tetramer lattice viewed from the cytosol with the central tetramer coloured. A ‘centre’ four-fold symmetry is indicated by a green square and a ‘corner’ four-fold symmetry is indicated by a magenta square. b, Surface model of the cytosolic and lumenal faces of the chimallin lattice coloured by relative electrostatic potential (blue: positive; red: negative). c, Cytosolic views of the centre four-fold pore cartoon model with pore-facing residues (Supplementary Table 8) shown as sticks. The centre pores (n = 9) have an average volume of 798 ± 81 nm3 over the course of 300 ns molecular dynamics simulations (n = 5; Extended Data Fig. 8). d, Same as c, for the corner pore. The core pores (n = 4) have an average volume of 1,429 ± 227 nm3 over the course of simulations (n = 5 independent simulations; Extended Data Fig. 8).
Fig. 5
Fig. 5. Structural conservation of chimallin in the distantly related E. coli jumbo phage Goslar.
a, Unrooted phylogenetic tree of chimallin homologues. Homologues are listed as phage and gene product (gp) numbers (see Supplementary Table 7). Groups based on proximity are coloured and the host genus is indicated (Scale bar, 0.1 substitutions per position). b, In situ subtomogram reconstruction of the Goslar chimallin shell. A comma-shaped protomer is marked by a yellow dashed outline and cytosolic and lumenal faces are indicated. c, O-symmetrized map of the Goslar chimallin cubic assembly viewed along the four-fold axis. d, Localized asymmetric reconstruction of the Goslar chimallin protomer. Invading N- and C-terminal segments from neighbouring protomers are coloured blue (NTS), red (CTS1) and burgundy (CTS2). e, Superposition of the Goslar (green) and 201phi2-1 (purple) coordinate models for the cube confirmation of the protomers e. Resolved termini are shown as spheres for the protomers in e. The r.m.s.d. is 1.8 Å for the aligned protomers.
Extended Data Fig. 1
Extended Data Fig. 1. In situ cryoFIB-ET of 201phi2-1-infected P. chlororaphis cells and subtomogram analysis.
a, Schematic of cryoFIB-ET workflow. b-i, Slices of the eight 201phi2-1 nucleus-containing tomograms used in this study. j Enlarged view of the colored boxed region in i. Exemplar doublets are indicated by yellow braces. k Enlarged view of the correspondingly colored boxed region in i which shows a square mesh-like texture corresponding to the square lattice. l, Half-map Fourier shell correlation (FSC) curves for the 201phi2-1 subtomogram reconstructions. m, Example over-sampling and subtomogram curation strategy using lattice plots for the tomogram shown in Figure 1c. n, Schematic of the subtomogram averaging workflow. Enlarged views of the consensus average with cytosolic and lumeal faces indicated. o, Neighbor plot of the initial (top), asymmetrically aligned reference. Neighbor plot of the symmetrized consensus (bottom) refinement. p, Enlarged views of the resolved classes colored by relative height. The central tetramer is denoted by a yellow, dashed line for each class. Scale bars: b–i: 250 nm, j,k: 25 nm, o: 10 nm.
Extended Data Fig. 2
Extended Data Fig. 2. In vitro tomography of 201phi2-1 chimallin void peak.
Slice through the tomogram of the 201phi2-1 chimallin SEC size-exclusion chromatography void peak. Region marked by a dashed yellow box is used in Figure 2b. Scale bar is 50 nm.
Extended Data Fig. 3
Extended Data Fig. 3. Single-particle reconstruction of the in vitro 201phi2-1 chimallin cubic assembly.
a, Exemplar micrograph and 2D class averages. b, Schematic of the localized reconstruction workflow. c, Unsharpened density map views centered on helix B (residues 68-84) at progressive stages of the localized reconstruction process. Final view of the C1 map shown with a fitted coordinate model. d, Fourier shell correlation (FSC) curves for the half-maps at progressive stages of the localized reconstruction process (red, yellow, and blue), histogram of local resolution estimates for the C1 reconstruction (light blue). f, C1 reconstruction filtered and colored by local resolution. g, (left) 2D class average of the minor (517 particles) species of elongated, quasi-D4 assemblies. (right) Orthogonal views of the D4-symmeterized single particle reconstruction. Scale bars: a: 50 nm, g: 10 nm.
Extended Data Fig. 4
Extended Data Fig. 4. Partial homology of chimallin fold topology to known structures.
a, Topology of the 201phi2-1 chimallin N-terminal domain (NTD, residues 62-228). b, Topology of E. faecalis EF_1977 (PDB ID: 3NAT), the closest structural relative of the chimallin A NTD. The root mean square deviation (RMSD) between chimallin NTD and 3NAT coordinate models is 4.6 Å over 97 aligned Cɑ atoms. Homologous secondary structure elements are colored in yellow. c, Topology of the 201phi2-1 chimallin C-terminal domain (CTD, residues 229-581). d, Topology of the E. coli AtaT tRNA-acetylating toxin (PDB ID: 6AJM). The root mean square deviation (RMSD) between chimallin CTD and 6AJM coordinate models is 4.2 Å over 269 aligned Cɑ atoms. Homologous secondary structure elements are colored in blue. e, Structural overlay of the chimallin CTD (blue) and AtaT (white; PDB ID 6AJM), showing the similarity in binding site for the chimallin CTS1 segment (red) and the antitoxin AtaR (green).
Extended Data Fig. 5
Extended Data Fig. 5. Interactions of NTS and CTS segments with the chimallin core.
a, Relationship of 201phi2-1 chimallin protomer packing in the cube (left) and flat sheet model (right). One protomer is shown as spheres and colored yellow with its NTS in blue and CTS1/CTS2 in red. Protomers that interact directly with this central protomer are colored. Non-interfacing protomers are in white. The flat sheet model is docked within the 201phi2-1 consensus subtomogram average map shown as transparent grey. Red arrows point to locations of unresolved linkers (red dashed lines), and pink symbols indicate 3- or 4-fold symmetry axes. b-d, Close-ups of the 201phi2-1 coordinate model around the binding sites for NTS (b), CTS1 (c), and CTS2 (d). (e–g) Close-ups of the Goslar coordinate model around the binding sites for NTS (e), CTS1 (f), and CTS2 (g). For all panels, cryo-EM density map is shown as a mesh at high (pink) and low (grey) contours. Polar interactions are depicted by the symbols indicated in the key at the far right. Source data
Extended Data Fig. 6
Extended Data Fig. 6. SEC-MALS of 201phi2-1 chimallin truncations.
a, Domain diagram of 201phi2-1 chimallin (top), with truncations tested by SEC-MALS (bottom). b-h, SEC-MALS analysis of full-length 201phi2-1 chimallin (b) and truncated constructs lacking the N-tail (c), NTS (d), CTS2 (e), CTS1+CTS2 (f), N-tail+CTS2 (g), or NTS + CTS1/2 (h). For panels b-h, differential refractive index (dRI) shows protein concentration (blue curves), and yellow points indicate measured molecular weight. Average molecular weight for each peak is shown.
Extended Data Fig. 7
Extended Data Fig. 7. GFP-chimallin incorporation into the nuclear shell in 201phi2-1-infected P. chlororaphis and truncation mutant growth curves.
a, Raw microscopy images of representative cells expressing GFP-chimallin and infected with 201phi2-1 60 min post-infection (mpi) showing GFP fluorescence with associated 3D graphs showing normalized GFP fluorescence intensity within these cells from a top and side view. GFPmut1 was expressed without fusion to chimallin as a negative control and shows no incorporation. Growth curves for P. chlororaphis expressing the indicated 201phi2-1 chimallin truncation mutant (or empty vector control) and challenged with either no phage (black line) or increasing multiplicity of infection of 201phi2-1 (color key at the bottom) over a period of 8 h. Dashed grey-line indicates the half of the maximal optical density at 600 nm achieved by the no phage control in each experiment. Curves are the average of four replicates (n = 4) of each condition. Scale bar: a: 1 μm. Source data
Extended Data Fig. 8
Extended Data Fig. 8. Analysis of flexibility by Gaussian network models and subtomogram analysis.
a, Cytosolic and tilted view schematic of 3x3 tetramer sheet model. b-f, Cartoon sheet model colored by results of Gaussian Network Model modes 1 through 5, respectively. Regions are colored according to the directional correlation of motion: positive (cyan), negative (magenta), and near-zero (white). “Hinge-residues” are depicted as green spheres. A list of the hinge-residues for each mode is in SI Table 5. g, Slice through the consensus subtomogram average for the 201phi2-1 nuclear shell, with the four-fold axis defining the central tetramer noted. h, Equivalent view of panel g from a pseudomap generating by fitting tetramers into the consensus subtomogram average. i, Model-map correlation coefficient about the mean (CC) for a tetramer model fit into the consensus subtomogram average and the three subclasses (concave, flat, and convex) within either the N-termini facing the cytosol (OUT) or lumen (IN). j, Two views of the concave, flat, and convex subclasses, compared to a pseudomap generated from the tetramer model. Dotted lines indicate the orientation of one monomer in each map. Denoted angles are with respect to the perpendicular. The arc arrow is red for the pseudomap to denote its opposite direction compared to the subtomogram average maps. k, Angles between tetramers in the phage nucleus lattice, derived from surface curvature estimates for phage nucleus segmentation in Figure 1d. l, Schematic of example manifestations of lattice curvature. The positive curvature shown on the right represents the 90° angle seen in the in vitro cubic assembly.
Extended Data Fig. 9
Extended Data Fig. 9. Size and hydrophobicity profiles of the four-fold pores.
a, Schematic of the 9-tetramer sheet model with the center four-fold pores marked with green squares. b, Pore diameter summary statistics for the nine center four-folds denoted in a over the course of the averaged 300-ns simulations (n = 5). c, Diameter profiles for each pore. The permeation pathway from top (negative values) to bottom (positive values) corresponds with cytosol to lumen. Solid black lines denote the mean diameter, dark gray shading +/− one standard deviation, and light grey shading the range. Dots indicate pore-facing residues and are colored by hydrophobicity. d, Hydrophobicity profiles for each pore. Solid black lines denote the mean hydrophobicity, dashed lines +/− one standard deviation, and shaded regions mark the range. e, Schematic of the 9-tetramer sheet model with the corner four-fold pores marked with pink squares. f, Pore diameter summary statistics for the four corner four-folds denoted in a over the course of the averaged 300-ns simulations (n = 5). g, Same as c for the corner four-fold pores. h, Same as d for the corner four-fold pores. i, Mean root mean square deviation (RMSD) of the alpha-carbons in the 3x3 tetramer sheet model over the course of the simulations for all alpha-carbons (green) and for those just within the central tetramer (blue). The central tetramer is embedded in a physiological environment, flanked by other tetramers. The edge tetramers continue to display an increasing RMSD since they are not connected to adjacent tetramers. Our analysis in the text stems from the central pore and corner pores formed by this tetramer.
Extended Data Fig. 10
Extended Data Fig. 10. In situ cryoFIB-ET of Goslar infected APEC2248 cells and subtomogram analysis.
a, Tomographic slice of a Goslar-nucleus and b the corresponding segmentation model. Outer and inner bacterial membranes are burgundy and pink, respectively. The phage nucleus is colored blue and host ribosomes are colored pale yellow. Five-hundred randomly selected 70S ribosomes are placed for clarity. c-g, A slice from each of the Goslar-nucleus containing tomograms used for subtomogram averaging in this study. The cells were plunged at effectively ~20–30 mpi, thus too early to observe virion assembly. h, Schematic of the subtomogram averaging workflow. i, Neighbor plots of the asymmetrically aligned initial reference (left) and symmetrized consensus refinement (right). j, Enlarged views of the resolved classes colored by relative height. k, Half-map Fourier shell correlation (FSC) curves for the subtomogram reconstructions. Source data
Extended Data Fig. 11
Extended Data Fig. 11. Single-particle reconstruction of the in vitro Goslar chimallin cubic assembly.
a, Size-exclusion coupled to multi-angle light scattering (SEC-MALS) analysis of purified, full-length Goslar chimallin. b, Exemplar micrograph and 2D class averages. c, Schematic of the localized reconstruction workflow. d, C1 reconstruction filtered and colored by local resolution estimates. e, Unsharpened density map views centered on helix B (residues 64-78) at progressive stages of the localized reconstruction process. Final view of the C1 map shown with a fitted coordinate model. f,g, Fourier shell correlation (FSC) curves for the half-maps and against corresponding models at progressive stages of the localized reconstruction process (red, yellow, and blue), histogram of local resolution estimates for the C1 reconstruction (light blue), and the C1 model-vs-map FSC curve (black). Scale bar: b: 50 nm. Source data
Extended Data Fig. 12
Extended Data Fig. 12. Unidentified spherical bodies present in jumbo phage-infected cell populations and speculative models.
a, Tomographic slice of Goslar-infected APEC2248 cell containing a bonafide phage nucleus, as well as an unidentified spherical body (USB). b, Enlarged view of the phage nucleus and USB from the region boxed in a. c, Plot of the apparent maximal diameter distributions for 201phi2-1 (purple) and Goslar (green) USBs with the summary statistics listed. d, Subtomogram average of the USBs picked from the Goslar dataset. Yellow arrow pointing to putative membrane leaflets. slices of USBs from the Goslar dataset. e, Left, model of USBs as the previously proposed pre-shell/nucleus enclosure of the phage DNA. Right, schematic summary of structural models in this work: (i) exclusion of host nucleases by small chimallin pore sizes, (ii) possible extrusion of phage mRNA via these pores, and (iii) implication of additional shell components to enable uptake of specific phage proteins into the phage nucleus. f-h, Gallery of USBs observed in tomograms of 201phi2-1-infected cell populations. i–l, Gallery of USBs observed in tomograms of Goslar-infected cell populations. Scale bars: a: 150 nm, b: 50 nm, d: 10 nm, f–l: 50 nm.

References

    1. Koonin EV, Makarova KS, Wolf YI. Evolutionary genomics of defense systems in archaea and bacteria. Annu. Rev. Microbiol. 2017;71:233–261. doi: 10.1146/annurev-micro-090816-093830. - DOI - PMC - PubMed
    1. Chaikeeratisak V, et al. Assembly of a nucleus-like structure during viral replication in bacteria. Science. 2017;355:194–197. doi: 10.1126/science.aal2130. - DOI - PMC - PubMed
    1. Mendoza SD, et al. A bacteriophage nucleus-like compartment shields DNA from CRISPR nucleases. Nature. 2020;577:244–248. doi: 10.1038/s41586-019-1786-y. - DOI - PMC - PubMed
    1. Malone LM, et al. A jumbo phage that forms a nucleus-like structure evades CRISPR–Cas DNA targeting but is vulnerable to type III RNA-based immunity. Nat. Microbiol. 2020;5:48–55. doi: 10.1038/s41564-019-0612-5. - DOI - PubMed
    1. Rostøl JT, Marraffini L. (Ph)ighting phages: how bacteria resist their parasites. Cell Host Microbe. 2019;25:184–194. doi: 10.1016/j.chom.2019.01.009. - DOI - PMC - PubMed