. 2022 Aug 3;23(1):554.
doi: 10.1186/s12864-022-08785-1.

Genes expressed at low levels raise false discovery rates in RNA samples contaminated with genomic DNA

Affiliations

Genes expressed at low levels raise false discovery rates in RNA samples contaminated with genomic DNA

Xiangnan Li et al. BMC Genomics. .

Abstract

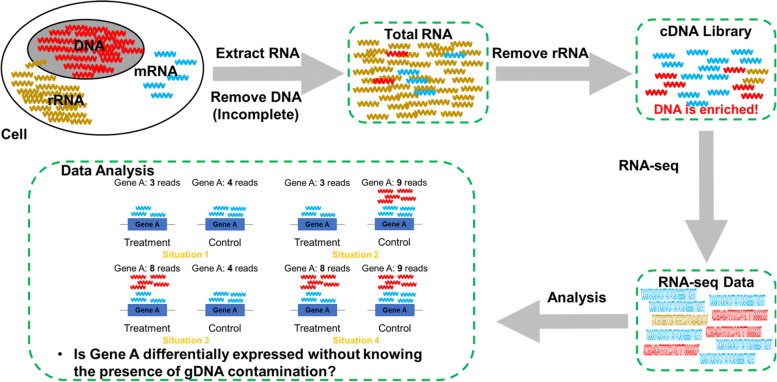
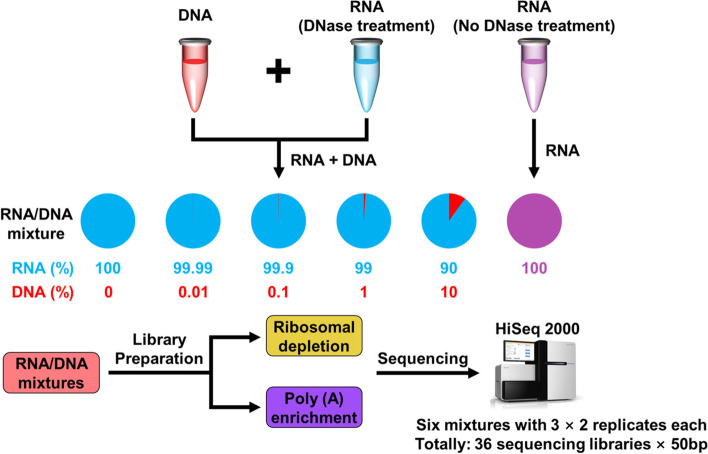
Background: RNA preparations contaminated with genomic DNA (gDNA) are frequently disregarded by RNA-seq studies. Such contamination may generate false results; however, their effect on the outcomes of RNA-seq analyses is unknown. To address this gap in our knowledge, here we added different concentrations of gDNA to total RNA preparations and subjected them to RNA-seq analysis.

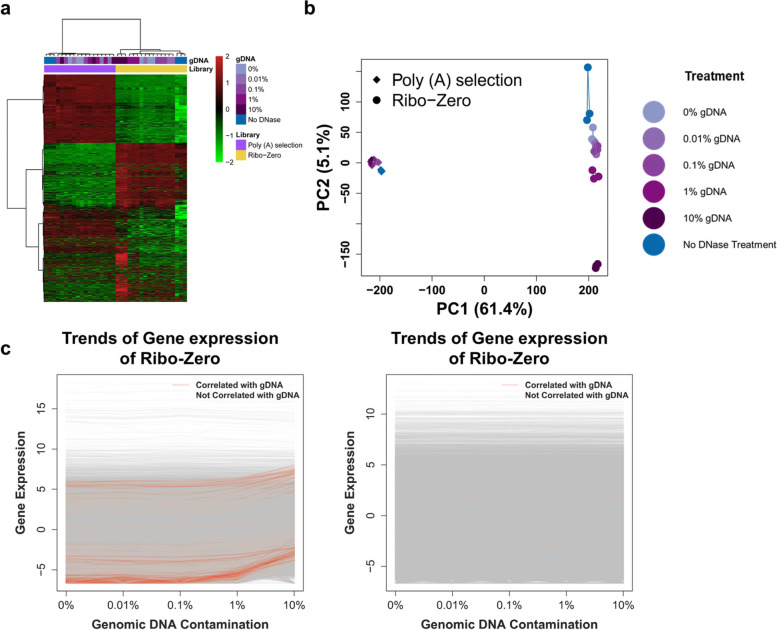
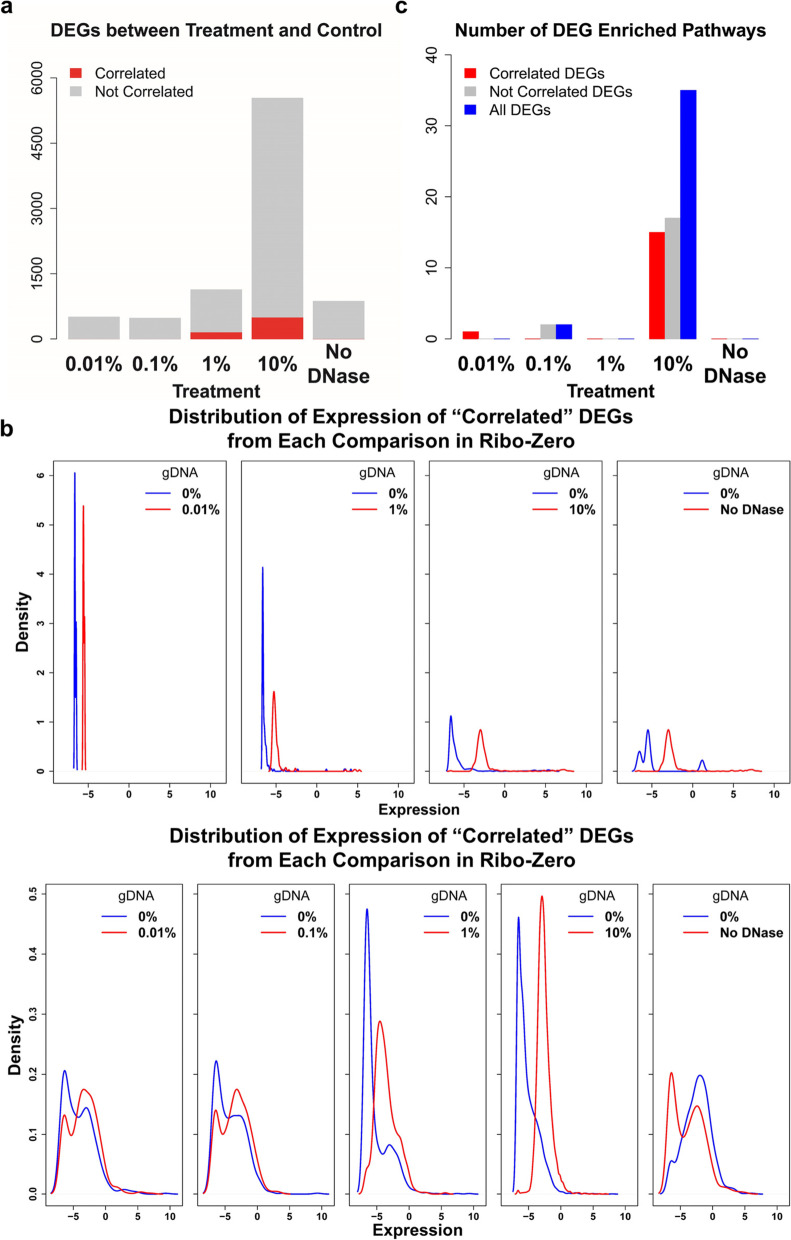
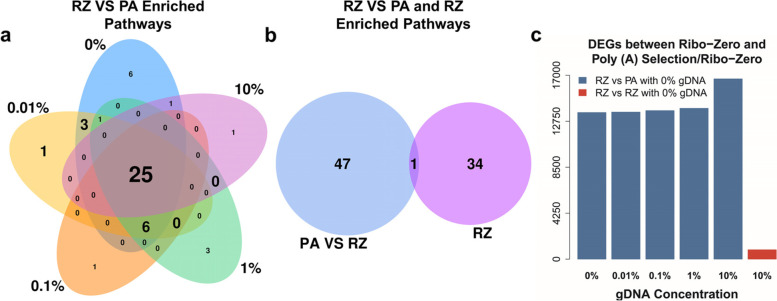
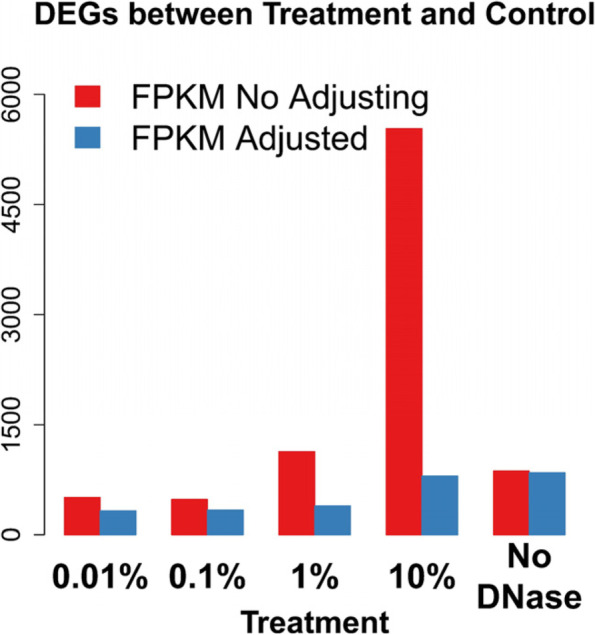
Results: We found that the contaminating gDNA altered the quantification of transcripts at relatively high concentrations. Differentially expressed genes (DEGs) resulting from gDNA contamination may therefore contribute to higher rates of false enrichment of pathways compared with analogous samples lacking numerous DEGs. A strategy was developed to correct gene expression levels in gDNA-contaminated RNA samples, which assessed the magnitude of contamination to improve the reliability of the results.

Conclusions: Our study indicates that caution must be exercised when interpreting results associated with low-abundance transcripts. The data provided here will likely serve as a valuable resource to evaluate the influence of gDNA contamination on RNA-seq analysis, particularly related to the detection of putative novel gene elements.

Keywords: False Discoveries; Genomic DNA Contamination; RNA-seq.


Conflict of interest statement

The authors declare that they have no competing interests.

Figures

Fig. 1
Fig. 1
Genomic DNA contamination in RNA-seq raises concerns about the reliability of RNA-seq results. Diagram showing that genomic DNA (gDNA) contamination may affect RNA-seq results. Most RNA-seq studies focus on mRNA and/or noncoding RNA in cells or tissues, while these RNAs account for a small part of total cellular RNA. When enriching for such RNAs, gDNA will be enriched as well and eventually contaminate RNA-seq data. In extracted total RNA, the sample consists of a large amount of rRNA, small amounts of mRNAs and noncoding RNAs, and a small amount of gDNA. During library preparation, particularly using the ribosomal depletion method, most rRNA in the total RNA sample is removed, which results in high enrichment of mRNA and noncoding RNAs together with gDNA. These gDNAs will contaminate RNA-seq data and ultimately affect analyzing results, such as falsely increasing gene expression levels that may influence the DEG detection. When detecting DEGs between Treatment and Control groups, there are roughly four situations for one specific gene. Situations 1: both the Treatment and Control are not contaminated by gDNA; Situation 2: only Control is contaminated by gDNA contamination; Situation 3: only Treatment is contaminated by gDNA; Situation 4: both Treatment and Control are contaminated by gDNA. Different contaminating situations would result in different DEG detecting results for genes, e.g. gene A
Fig. 2
Fig. 2
Study design. Here we aimed to investigate and reduce the influence of gDNA contamination on gene expression. Total RNA and gDNA were extracted from a human HapMap lymphoblast cell line, and total RNA was divided into two groups: one treated with DNase and the other not treated with DNase. The gDNA was added to the DNase-treated RNA to achieve concentrations of 0% to 10%. These RNA/DNA mixtures and the non-DNase-treated RNA were prepared to construct the RNA-seq libraries using the Ribo-Zero and Poly (A) Selection methods. Each treatment was performed in triplicate, and 36 libraries were prepared. Sequencing data (50-bp reads) were generated using an Illumina HiSeq2000
Fig. 3
Fig. 3
Higher gDNA contamination affects Ribo-Zero to a greater extent than Poly (A) Selection. a) Different library preparation methods clustered separately; and Poly (A) Selection mutually clustered, while Ribo-Zero gDNA clustered closely by the treatments. For Poly (A) Selection, different treatments clustered together regardless of gDNA concentrations, except for no-DNase treatment, while closely clustered by gDNA concentrations particularly at high gDNA concentrations for Ribo-Zero. b) PCA showed results similar to those shown in panel a). Different library preparation methods separately clustered. For Poly (A) selection, different gDNA contamination treatments tightly clustered, which reflected that gDNA exerted a small amount of influence on gene expression levels. For Ribo-Zero, different treatments tightly clustered on PC1 and sporadically on PC2, which reflects the different extents of influence of gDNA on gene expression levels. c) More genes were affected by gDNA, indicated by changes in their expression levels in Ribo-Zero compared with Poly (A) Selection. These samples were enriched in genes expressed at low expressed in Ribo-Zero (See Supplementary Figure S1, Additional File 2). Each line represents the mean expression level of one gene from three replicates at different contaminating gDNA concentrations. The x-axis represents different amounts of gDNA contamination, and the y-axis represents the gene expression value. The light red line represents gene expression levels that significantly correlated with gDNA contamination, and the gray line represents gene expression levels that did not. Left (Ribo-Zero), right (Poly (A) Selection)
Fig. 4
Fig. 4
Genomic DNA alters the expression of low-abundance transcripts and leads to false results in Ribo-Zero. a) Genomic DNA significantly altered the quantitation of gene expression levels in Ribo-Zero. The bar plot shows the number of DEGs in Ribo-Zero at different concentrations of contaminating gDNA. The “Correlated” DEGs were considered genes with altered expression levels caused by gDNA contamination, and the “Not Correlated” DEGs were considered genes with altered levels caused by gDNA and/or background noise. The DEGs were detected by comparing libraries with > 0% (Treatment) and 0% (Control) gDNA. The x-axis represents different treatments; the y-axis represents the number of DEGs in each comparison (t test, two-sided, p < 0.05 and |log2(fold-change)|> 1). The red and gray bars represent “Correlated” and “Not Correlated” DEGs, respectively. b) The “Correlated” and “Not Correlated” DEGs were expressed at low levels in the Treatment and Control. Most “Correlated” and “Not Correlated” DEGs in Treatment and Control showed expression levels < 0. The distribution of expression levels of “Correlated” DEGs between libraries with 0.1% and 0% gDNA contamination is not displayed, because only one “Correlated” DEG was detected. The x-axis represents the expression value (log2[FPKM]); the y-axis represents density. The blue line represents Control, the red line represents Treatment. c) “Correlated” and “Not Correlated” DEGs give “false” enrichment results. The plot shows the number of enriched KEGG pathways of DEGs between Treatment and Control in Ribo-Zero. The x-axis represents different treatments; the y-axis represents the number of enriched pathways. The red, gray, and blue bars represent “Correlated”, “Not Correlated,” and all DEG-enriched pathways, respectively
Fig. 5
Fig. 5
Genomic DNA contributes little to pathway enrichment analysis when comparing two distinct methods. a) Enriched pathways showed a large overlap regardless of gDNA concentration. The Venn diagram shows the number of DEG-enriched pathways compared with Ribo-Zero and Poly (A) Selection. Twenty-five (52.1%) of enriched pathways were shared, regardless of gDNA contamination. b) Most enriched pathways associated with gDNA did not appear in the comparison of Ribo-Zero and Poly (A) Selection. The Venn diagram shows the number of all enriched pathways in the comparison of Ribo-Zero with > 0% and 0% gDNA and Ribo-Zero and Poly (A) selection. The pathway enriched between Ribo-Zero with > 0% and 0% gDNA were considered associated with gDNA. c) Many more DEGs between Ribo-Zero and Poly (A) Selection than between Ribo-Zero libraries. The DEGs were detected by comparing Ribo-Zero libraries (0% to 10% gDNA) and Poly (A) Selection libraries (0% gDNA) and between Ribo-Zero libraries with 10% and with 0% gDNA. PA: Poly (A) Selection; RZ: Ribo-Zero
Fig. 6
Fig. 6
Adjusting expression levels reduces number of DEGs. The DEGs were detected by comparing libraries with > 0% (Treatment) gDNA and those with 0% (Control) gDNA for Ribo-Zero libraries. The red and blue bars represent DEGs detected before and after adjustment, respectively. The x-axis represents different treatments; the y-axis represents the number of DEGs in each comparison. (t test, two-sided, p < 0.05 and |log2(fold-change)|> 1)

Similar articles

Cited by

References

    1. Bustin SA. Quantification of mRNA using real-time reverse transcription PCR (RT-PCR): trends and problems. J Mol Endocrinol. 2002;29(1):23–39. doi: 10.1677/jme.0.0290023. - DOI - PubMed
    1. Naderi A, Ahmed AA, Barbosa-Morais NL, Aparicio S, Brenton JD, Caldas C. Expression microarray reproducibility is improved by optimising purification steps in RNA amplification and labelling. BMC Genomics. 2004;5(1):9. - PMC - PubMed
    1. Van Peer G, Mestdagh P, Vandesompele J. Accurate RT-qPCR gene expression analysis on cell culture lysates. Sci Rep. 2012;2(1):222. doi: 10.1038/srep00222. - DOI - PMC - PubMed
    1. Su Z, Łabaj PP, Li S, Thierry-Mieg J, Thierry-Mieg D, Shi W, et al. A comprehensive assessment of RNA-seq accuracy, reproducibility and information content by the Sequencing Quality Control Consortium. Nat Biotechnol. 2014;32(9):903–914. doi: 10.1038/nbt.2957. - DOI - PMC - PubMed
    1. Laurell H, Iacovoni JS, Abot A, Svec D, Maoret JJ, Arnal JF, et al. Correction of RT-qPCR data for genomic DNA-derived signals with ValidPrime. Nucleic Acids Res. 2012;40(7):e51. doi: 10.1093/nar/gkr1259. - DOI - PMC - PubMed

LinkOut - more resources