Meta-Analysis
. 2022 Aug 3;28(1):86.
doi: 10.1186/s10020-022-00513-5.

Identifying novel host-based diagnostic biomarker panels for COVID-19: a whole-blood/nasopharyngeal transcriptome meta-analysis

Affiliations
Meta-Analysis

Identifying novel host-based diagnostic biomarker panels for COVID-19: a whole-blood/nasopharyngeal transcriptome meta-analysis

Samaneh Maleknia et al. Mol Med. .

Abstract

Background: Regardless of improvements in controlling the COVID-19 pandemic, the lack of comprehensive insight into SARS-COV-2 pathogenesis is still a sophisticated challenge. In order to deal with this challenge, we utilized advanced bioinformatics and machine learning algorithms to reveal more characteristics of SARS-COV-2 pathogenesis and introduce novel host response-based diagnostic biomarker panels.

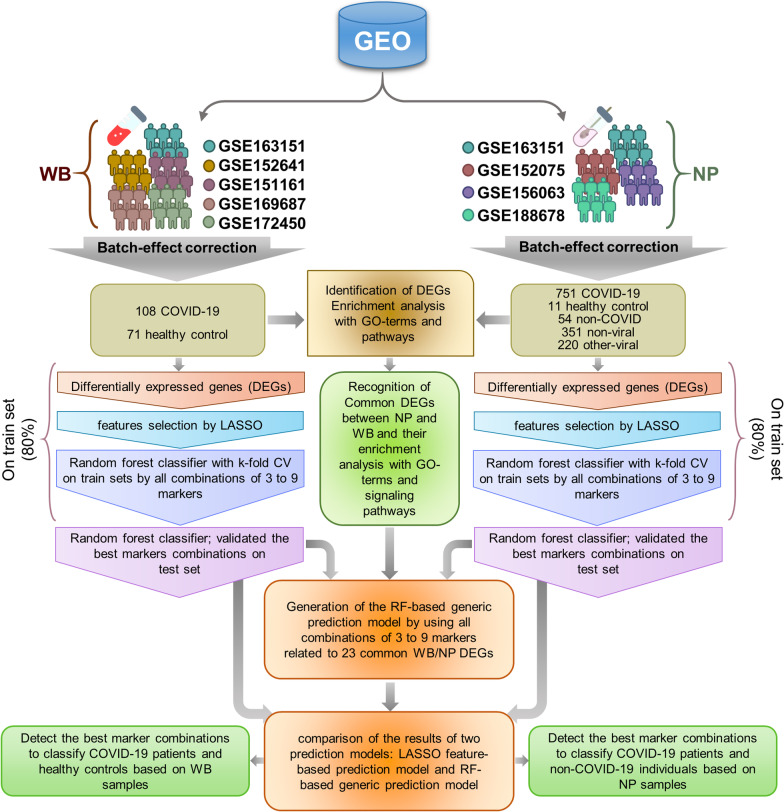
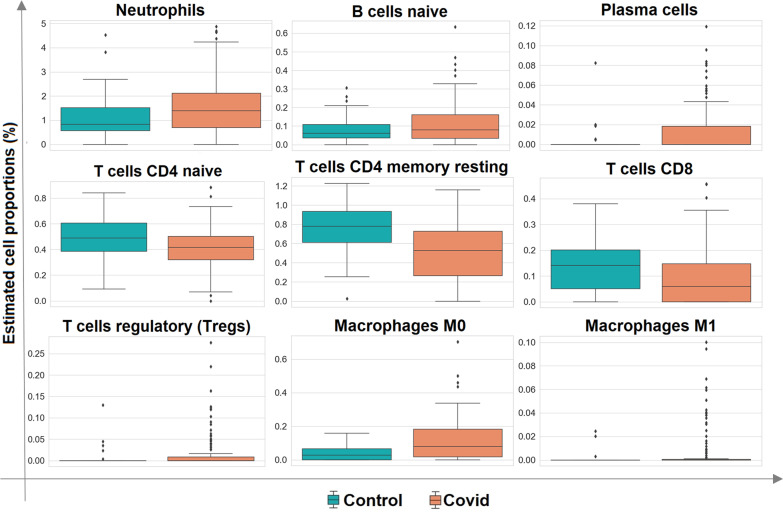
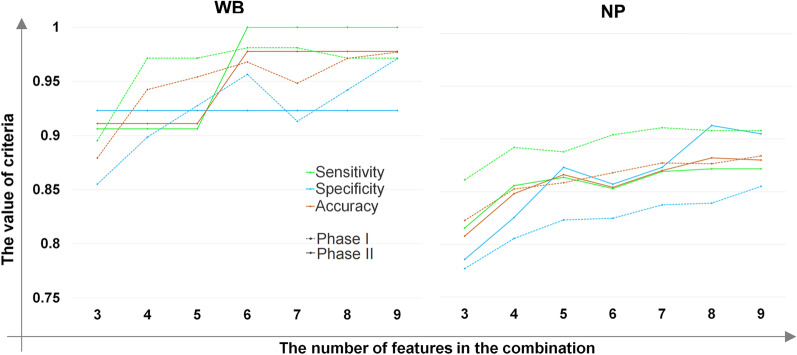
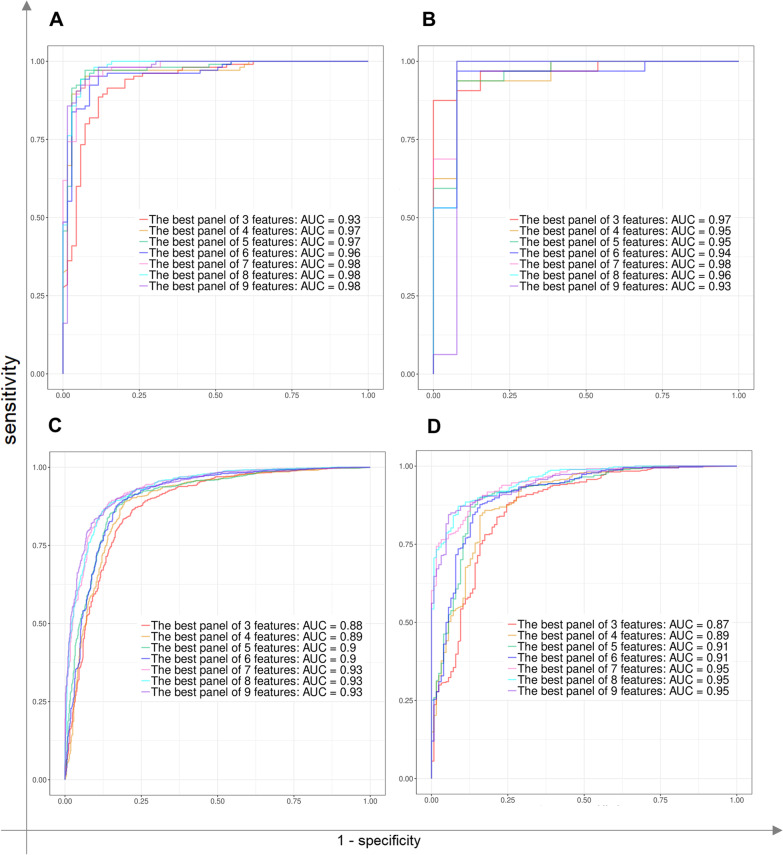
Methods: In the present study, eight published RNA-Seq datasets related to whole-blood (WB) and nasopharyngeal (NP) swab samples of patients with COVID-19, other viral and non-viral acute respiratory illnesses (ARIs), and healthy controls (HCs) were integrated. To define COVID-19 meta-signatures, Gene Ontology and pathway enrichment analyses were applied to compare COVID-19 with other similar diseases. Additionally, CIBERSORTx was executed in WB samples to detect the immune cell landscape. Furthermore, the optimum WB- and NP-based diagnostic biomarkers were identified via all the combinations of 3 to 9 selected features and the 2-phases machine learning (ML) method which implemented k-fold cross validation and independent test set validation.

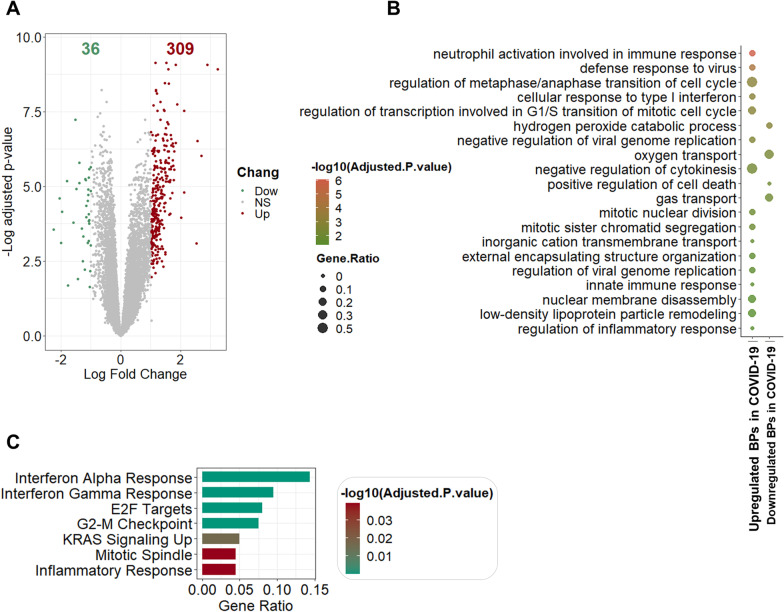
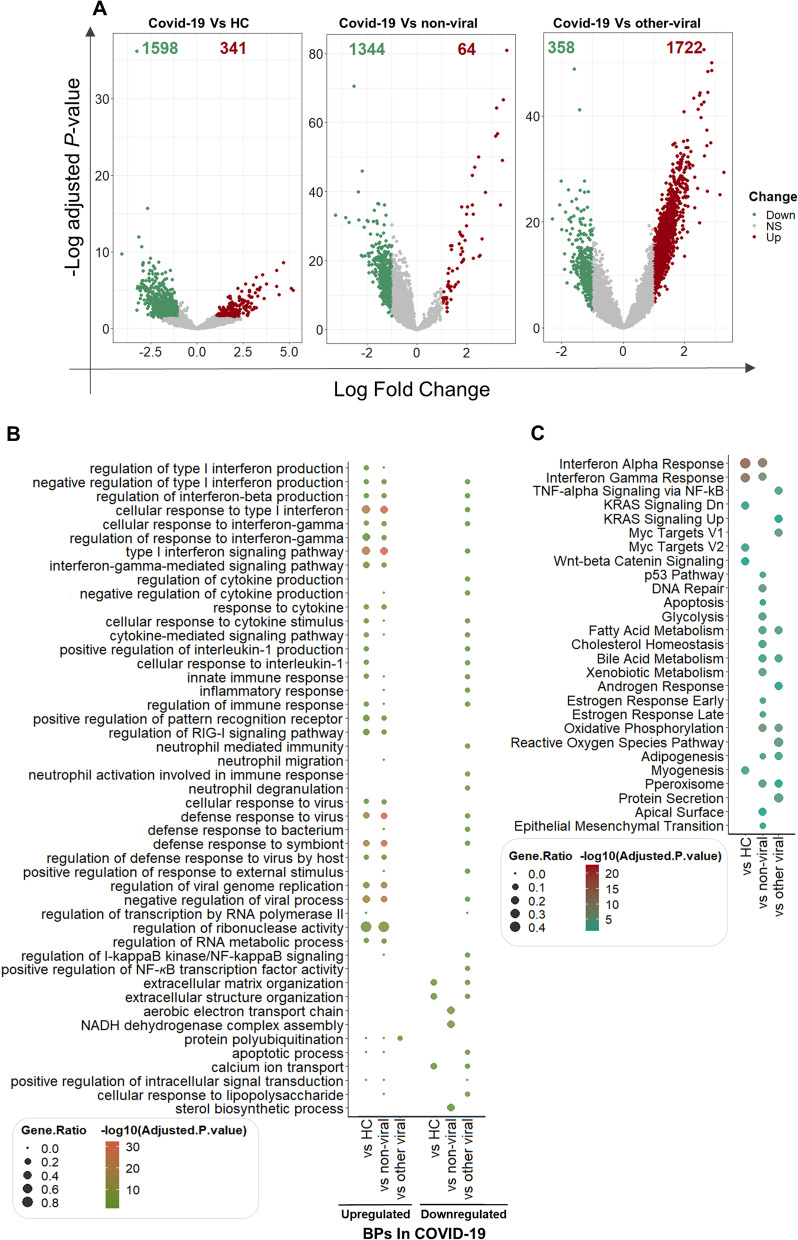
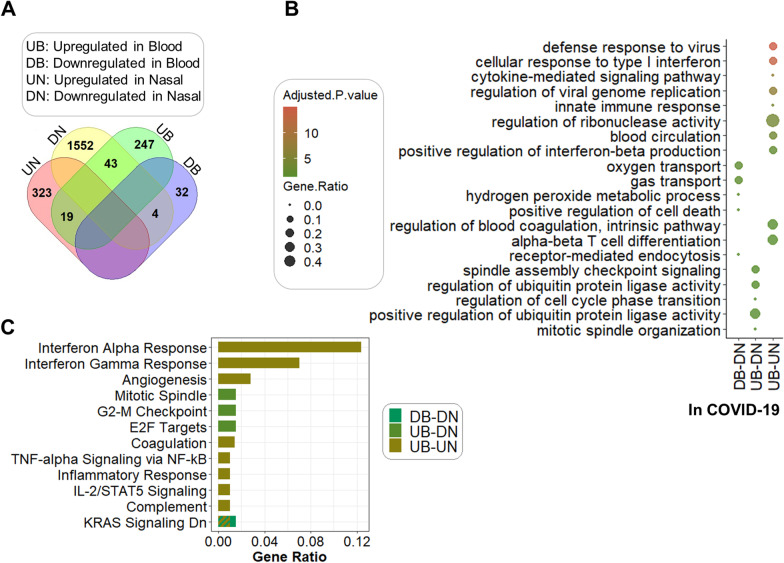
Results: The host gene meta-signatures obtained for SARS-COV-2 infection were different in the WB and NP samples. The gene ontology and enrichment results of the WB dataset represented the enhancement in inflammatory host response, cell cycle, and interferon signature in COVID-19 patients. Furthermore, NP samples of COVID-19 in comparison with HC and non-viral ARIs showed the significant upregulation of genes associated with cytokine production and defense response to the virus. In contrast, these pathways in COVID-19 compared to other viral ARIs were strikingly attenuated. Notably, immune cell proportions of WB samples altered in COVID-19 versus HC. Moreover, the optimum WB- and NP-based diagnostic panels after two phases of ML-based validation included 6 and 8 markers with an accuracy of 97% and 88%, respectively.

Conclusions: Based on the distinct gene expression profiles of WB and NP, our results indicated that SARS-COV-2 function is body-site-specific, although according to the common signature in WB and NP COVID-19 samples versus controls, this virus also induces a global and systematic host response to some extent. We also introduced and validated WB- and NP-based diagnostic biomarkers using ML methods which can be applied as a complementary tool to diagnose the COVID-19 infection from non-COVID cases.

Keywords: Biomarker; COVID-19; Data integration; Nasopharyngeal swab; Pathogenesis; Random forest; SARS-COV-2; Systems biology; Whole blood.


Conflict of interest statement

The authors declare that they have no competing interests.

Figures

Fig. 1
Fig. 1
The workflow of the study: The RNA-Seq datasets related to whole blood (WB) and nasopharyngeal (NP) samples from patients with COVID-19 infection and other similar disease conditions including viral and non-viral acute respiratory illnesses (ARI) as well as healthy controls were acquired from GEO database. Data were integrated and the batch effects were eliminated. Subsequently, the datasets were subjected to pathway enrichment and GO analyses. Furthermore, the candidate diagnostic biomarker panels were identified using machine learning methods on train datasets and validated on independent cohorts to introduce the best biomarker combinations. Besides, the RF-based generic prediction models were generated by using all combinations of 3 to 9 markers related to 23 common WB/NP DEGs was done. Finally, the results of two prediction models, including the LASSO feature-based prediction model and RF-based generic prediction model were compared. WB whole blood, NP nasopharyngeal, ARI acute respiratory illnesses, RF random forest
Fig. 2
Fig. 2
Transcriptome analysis of whole blood samples of COVID-19 patients versus healthy controls: The volcano plot to demonstrate differential expressed genes which had adjusted P-value < 0.05, |Log2FC|> 1. Red and green show up and downregulated genes, respectively (A). Dot plot to show BPs (GO) according to significantly upregulated and downregulated genes. The size of the dots is proportional to the gene ratio in considering process and the color corresponds to the –log10 of the adjusted P-value. Selected top and not-redundant terms are visualized (B). Bar plot to depict hallmark gene set enrichment analysis. The size of the bars is proportional to the gene ratio in considering pathway and the color corresponds to the –log10 of the adjusted P-value (C). BP biological process, GO gene ontology
Fig. 3
Fig. 3
Cell-type proportions in whole blood of COVID-19 in comparison to healthy control: the box plots for the estimated immune cell type proportions of the COVID-19 patients and the HC individuals which were obtained by Cibersortx. HC healthy control
Fig. 4
Fig. 4
Transcriptome analysis of nasopharyngeal samples of patients with COVID-19 versus non-viral and other viral acute respiratory illnesses (ARIs) as well as healthy controls: The volcano plot to demonstrate differential expressed genes which had adjusted P-value < 0.05, |Log2FC|> 1. Red and green show up and downregulated genes, respectively (A). Dot plots to show BPs according to significantly up/downregulated genes (B) and hallmark gene set enrichment analysis (C). The size of the dots is proportional to the gene ratio in considering process and pathway; and the color corresponds to the –log10 of the adjusted P-value. Selected top and not-redundant terms are visualized. BP biological process
Fig. 5
Fig. 5
Analysis of common dysregulated genes in SARS-COV-2 -infected whole blood and nasopharyngeal samples in comparison with healthy controls: The Venn diagram to display the distribution of genes in four desired groups (UB upregulated genes in blood, DB downregulated genes in blood, UN upregulated genes in nasal, and DN downregulated genes in nasal) (A). Dot plot to show BPs according to common genes of each paired group. The size of the dots is proportional to the gene ratio in considering process and the color corresponds to the –log10 of the adjusted P-value. Selected top and not-redundant terms are visualized (B). Bar plot to depict hallmark gene set enrichment analysis. The size of the bars is proportional to the gene ratio in considering pathway and the color corresponds to paired groups whose common genes were studied. The “KRAS Signaling Dn” pathway was enriched in two groups (C). BP biological process
Fig. 6
Fig. 6
The criteria of classifiers: The Line plots to indicate the value of the sensitivity, specificity, and accuracy of the classifiers for whole blood (WB) and nasopharyngeal (NP) samples in the first and second phases based on the number of features
Fig. 7
Fig. 7
The ROC curves: These ROC curves illustrate the sensitivity, 1-specificity, and AUC associated to phase I (A and C) and phase II (B and D) for whole blood and nasopharyngeal samples among the top 3 to 9 features, respectively

Similar articles

Cited by

References

    1. Abbas M, Verma S, Verma S, et al. Association of GSTM1 and GSTT1 gene polymorphisms with COVID-19 susceptibility and its outcome. J Med Virol. 2021;93:5446–5451. doi: 10.1002/jmv.27076. - DOI - PMC - PubMed
    1. Ahmed FF, Reza MS, Sarker MS, et al. Identification of host transcriptome-guided repurposable drugs for SARS-CoV-1 infections and their validation with SARS-COV-2 infections by using the integrated bioinformatics approaches. PLoS ONE. 2022 doi: 10.1371/journal.pone.0266124. - DOI - PMC - PubMed
    1. Aksakal A, Kerget B, Kerget F, Aşkın S. Evaluation of the relationship between macrophage migration inhibitory factor level and clinical course in patients with COVID-19 pneumonia. J Med Virol. 2021;93:6519–6524. doi: 10.1002/jmv.27189. - DOI - PMC - PubMed
    1. Andres-Terre M, McGuire HM, Pouliot Y, et al. Integrated, multi-cohort analysis identifies conserved transcriptional signatures across multiple respiratory viruses. Immunity. 2015;43:1199–1211. doi: 10.1016/j.immuni.2015.11.003. - DOI - PMC - PubMed
    1. Aschenbrenner AC, Mouktaroudi M, Krämer B, et al. Disease severity-specific neutrophil signatures in blood transcriptomes stratify COVID-19 patients. Genome Med. 2020 doi: 10.1101/2020.07.07.20148395. - DOI - PMC - PubMed

Publication types