. 2022 Aug 3;14(1):45.
doi: 10.1186/s11689-022-09454-w.

A framework for characterizing heterogeneity in neurodevelopmental data using latent profile analysis in a sample of children with ADHD

Affiliations

A framework for characterizing heterogeneity in neurodevelopmental data using latent profile analysis in a sample of children with ADHD

Anne B Arnett et al. J Neurodev Disord. .

Abstract

Background: Heterogeneity in neurodevelopmental disorders, and attention deficit hyperactivity disorder (ADHD) in particular, is increasingly identified as a barrier to identifying biomarkers and developing standards for clinical care. Clustering analytic methods have previously been used across a variety of data types with the goal of identifying meaningful subgroups of individuals with ADHD. However, these analyses have often relied on algorithmic approaches which assume no error in group membership and have not made associations between patterns of behavioral, neurocognitive, and genetic indicators. More sophisticated latent classification models are often not utilized in neurodevelopmental research due to the difficulty of working with these models in small sample sizes.

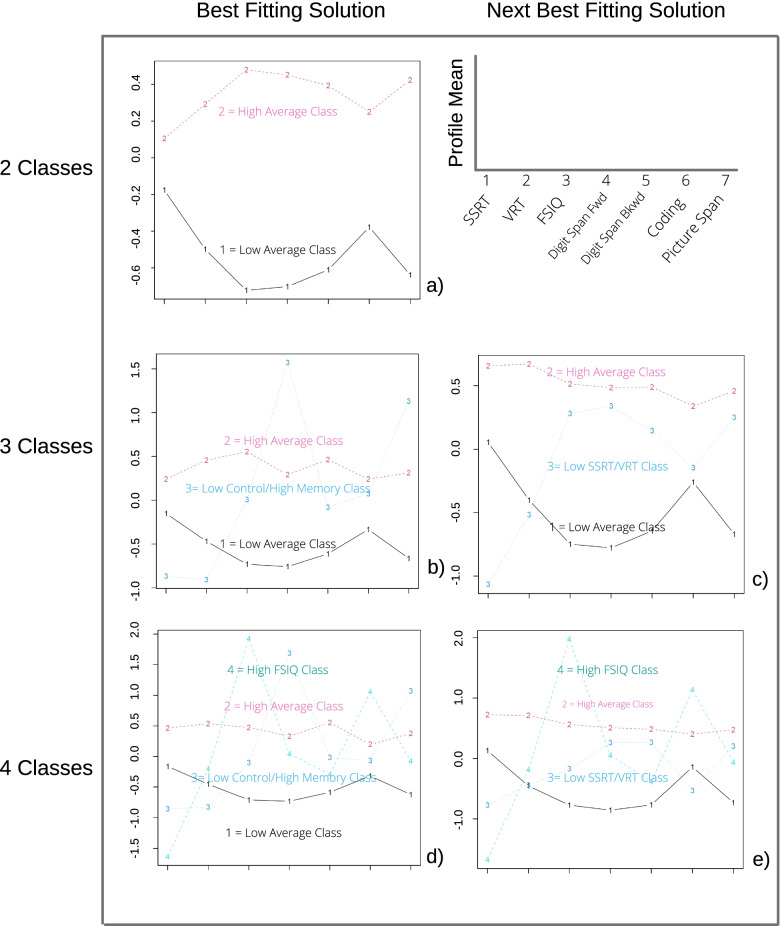
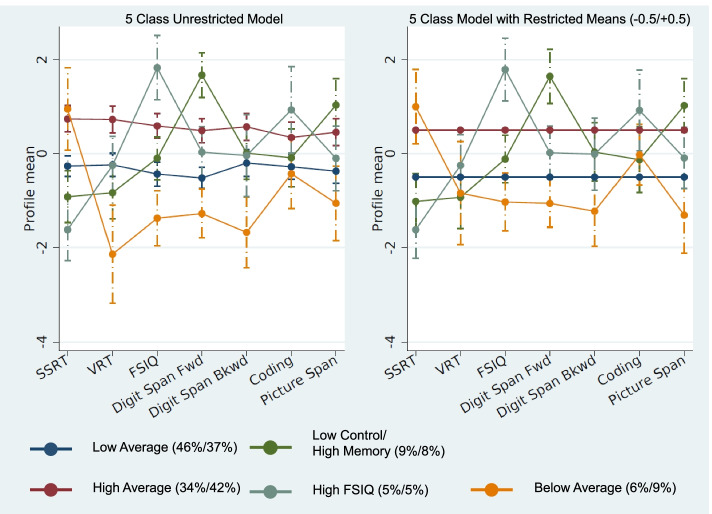
Methods: In the current study, we propose a framework for evaluating mixture models in sample sizes typical of neurodevelopmental research. We describe a combination of qualitative and quantitative model fit evaluation procedures. We test our framework using latent profile analysis (LPA) in a case study of 120 children with and without ADHD, starting with well-understood neuropsychological indicators, and building toward integration of electroencephalogram (EEG) measures.

Results: We identified a stable five-class LPA model using seven neuropsychological indicators. Although we were not able to identify a stable multimethod indicator model, we did successfully extrapolate results of the neuropsychological model to identify distinct patterns of resting EEG power across five frequency bands.

Conclusions: Our approach, which emphasizes theoretical as well as empirical evaluation of mixture models, could make these models more accessible to clinical researchers and may be a useful approach to parsing heterogeneity in neurodevelopmental disorders.


Conflict of interest statement

The authors declare that they have no competing interests.

Figures

Fig. 1
Fig. 1
Flow chart depicting estimation steps for the single-method and multimethod latent models. Model evaluation metrics are described in the circles, ordered from the most quantitative (top) to the most qualitative (bottom) in nature
Fig. 2
Fig. 2
Plots of means for unrestricted models with 2–4 classes. The two-class solution converged on a single mode, while the three- and four-class models converged on multiple modes. The two best modes (i.e., with the highest loglikelihoods) are depicted. Profile means (y-axis) are standardized within the sample. SSRT stop-signal reaction time, VRT go-reaction time variability, FSIQ full-scale IQ, Digit Span Fwd digit span forward, Digit Span Bkwd digit span backward. Note recurring features in the data, such as the shape of class 1 (“low average”) across models, the shape of class 3 (“low control/high memory”) in the top three- and four-class models, and the shape of class 4 (“high FSIQ”) in the two best four-class models
Fig. 3
Fig. 3
Plots of means and 95% confidence intervals for the unrestricted means (left) and fixed parameter (right) 5-class models. The fixed parameter model specifies a class with means of −0.5 (Low Average) and +0.5 (High Average). Numbers in parentheses are estimated proportions for each class (unrestricted/restricted). Note these values generally do not shift much, implying stability of the models. Profile means (y-axis) are standardized within the sample. SSRT stop-signal reaction time, VRT go-reaction time variability, FSIQ full-scale IQ, Digit Span Fwd digit span forward, Digit Span Bkwd digit span backward. Class proportions are depicted in parentheses (unrestricted model/restricted model)
Fig. 4
Fig. 4
EEG spectral power profiles by neuropsychological latent class. Y-axis values are log-transformed absolute spectral power

References

    1. Betancur C. Etiological heterogeneity in autism spectrum disorders: more than 100 genetic and genomic disorders and still counting. Brain Res. 2011;1380:42–77. doi: 10.1016/j.brainres.2010.11.078. - DOI - PubMed
    1. Jeste SS, Geschwind DH. Disentangling the heterogeneity of autism spectrum disorder through genetic findings. Nat Rev Neurol. 2014;10(2):74. doi: 10.1038/nrneurol.2013.278. - DOI - PMC - PubMed
    1. Karalunas SL, Nigg JT. Heterogeneity and subtyping in attention-deficit/hyperactivity disorder—considerations for emerging research using person-centered computational approaches. Biol Psychiatry. 2020;88(1):103–110. doi: 10.1016/j.biopsych.2019.11.002. - DOI - PMC - PubMed
    1. Li T, van Rooij D, Roth Mota N, Buitelaar JK, Group EAW, Hoogman M, et al. Characterizing neuroanatomic heterogeneity in people with and without ADHD based on subcortical brain volumes. J Child Psychol Psychiatry. 2021;62(9):1140–9. - PMC - PubMed
    1. Nigg JT, Karalunas SL, Feczko E, Fair DA. Toward a revised nosology for ADHD heterogeneity. Biol Psychiatry: Cogn Neurosci Neuroimaging. 2020;5(8):726–737. - PMC - PubMed

Publication types

MeSH terms