. 2022 Aug 3;28(1):90.
doi: 10.1186/s10020-022-00519-z.

Rapamycin rescues mitochondrial dysfunction in cells carrying the m.8344A > G mutation in the mitochondrial tRNALys

Affiliations

Rapamycin rescues mitochondrial dysfunction in cells carrying the m.8344A > G mutation in the mitochondrial tRNALys

Mariantonietta Capristo et al. Mol Med. .

Abstract

Background: Myoclonus, Epilepsy and Ragged-Red-Fibers (MERRF) is a mitochondrial encephalomyopathy due to heteroplasmic mutations in mitochondrial DNA (mtDNA) most frequently affecting the tRNALys gene at position m.8344A > G. Defective tRNALys severely impairs mitochondrial protein synthesis and respiratory chain when a high percentage of mutant heteroplasmy crosses the threshold for full-blown clinical phenotype. Therapy is currently limited to symptomatic management of myoclonic epilepsy, and supportive measures to counteract muscle weakness with co-factors/supplements.

Methods: We tested two therapeutic strategies to rescue mitochondrial function in cybrids and fibroblasts carrying different loads of the m.8344A > G mutation. The first strategy was aimed at inducing mitochondrial biogenesis directly, over-expressing the master regulator PGC-1α, or indirectly, through the treatment with nicotinic acid, a NAD+ precursor. The second was aimed at stimulating the removal of damaged mitochondria through prolonged rapamycin treatment.

Results: The first approach slightly increased mitochondrial protein expression and respiration in the wild type and intermediate-mutation load cells, but was ineffective in high-mutation load cell lines. This suggests that induction of mitochondrial biogenesis may not be sufficient to rescue mitochondrial dysfunction in MERRF cells with high-mutation load. The second approach, when administered chronically (4 weeks), induced a slight increase of mitochondrial respiration in fibroblasts with high-mutation load, and a significant improvement in fibroblasts with intermediate-mutation load, rescuing completely the bioenergetics defect. This effect was mediated by increased mitochondrial biogenesis, possibly related to the rapamycin-induced inhibition of the Mechanistic Target of Rapamycin Complex 1 (mTORC1) and the consequent activation of the Transcription Factor EB (TFEB).

Conclusions: Overall, our results point to rapamycin-based therapy as a promising therapeutic option for MERRF.

Keywords: MERRF; Mitochondrial DNA; Mitochondrial biogenesis; Mitochondrial dysfunction; Niacin; PGC-1α; Rapamycin; mTORC1.


Conflict of interest statement

The authors declare no conflict of interest related to this study.

Figures

Fig. 1
Fig. 1
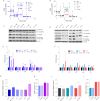
Bioenergetics assessment in MERRF cybrids. A Cell viability was evaluated growing cells for 24 h, 48 h and 72 h in galactose-medium and by performing SRB assay. Data are means ± SEM of four independent experiments (biological replicates). B OCR expressed as pmoles O2/min, normalized for protein content, under basal conditions and after injection of oligomycin (O), carbonyl cianide 4-(trifluoromethoxy) phenylhydrazone (FCCP; F), rotenone (R) and antimycin A (AA). Data are expressed as means ± SEM of three independent experiments (biological replicates). C Basal, ATP-linked and maximal respiration. All values are means and SEM of three independent experiments (biological replicates). D Western blot of OXPHOS subunits; ACTIN was used as loading control. A representative blot of three independent experiments, analyzing three biological replicates, is shown for each protein. E Densitometry of OXPHOS subunits of three independent experiments (biological replicates). All data are means and SEM and are normalized to control cells. F Western blot of VDAC, TIM23 and TOM20; ACTIN was used as loading control. A representative blot of three independent experiments (biological replicates) is shown for each protein. G Densitometry of VDAC, TIM23 and TOM20 content. All data are means and SEM and are normalized to control cells. H mtDNA content evaluation by qPCR. All values are expressed as means and SEM of three biological replicates and are normalized to control cells. Statistical analyses were performed with ANOVA test (Tukey’s multiple comparisons test). *, ** and *** values significantly different from the control cells, p < 0.05, p < 0.01, p < 0.001 respectively; #, ## and ### values significantly different from the I-mutant, p < 0.05, p < 0.01, p < 0.001, respectively. Wt-C wild type cybrids, I-C intermediate heteroplasmy cybrids, H-C high heteroplasmy cybrids
Fig. 2
Fig. 2
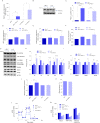
Bioenergetics assessment in MERRF fibroblasts. A Cell viability was evaluated growing cells for 24 h, 48 h and 72 h in galactose-medium and by performing SRB assay. Data are means ± SEM of three independent experiments (biological replicates). B OCR expressed as pmoles O2/min, normalized for protein content, under basal conditions and after injection of oligomycin (O), carbonyl cianide 4-(trifluoromethoxy) phenylhydrazone (FCCP; F), rotenone (R) and antimycin A (AA). Data are means ± SEM of three independent experiments (biological replicates). C Basal, ATP-linked and maximal respiration. All values are means + SEM of three independent experiments (biological replicates). D Western blot of OXPHOS subunits; ACTIN was used as loading control. One representative experiment out of three is shown. E Densitometry of OXPHOS subunits of three independent experiments (biological replicates). All data are means and SEM and are normalized to control cells. F Western blot of VDAC, TIM23 and TOM20; ACTIN was used as loading control. A representative blot of three independent experiments is shown for each protein. G Densitometry of VDAC, TIM23 and TOM20 content. All data are means and SEM and are normalized to control cells. H mtDNA content evaluation by qPCR. All values are expressed as means and SEM of four biological replicates and are normalized to control cells. Statistical analyses were performed with ANOVA test (Tukey’s multiple comparisons test). *, ** and *** values significantly different from the control cells, p < 0.05, p < 0.01, p < 0.001 respectively; #, ## and ### values significantly different from the I-mutant, p < 0.05, p < 0.01, p < 0.001, respectively. Wt-F wild type fibroblasts, I-F intermediate heteroplasmy fibroblasts, H-F high heteroplasmy fibroblasts
Fig. 3
Fig. 3
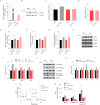
Nicotinic acid (NA) treatment in MERRF cybrids and fibroblasts. Cells are treated with vehicle (DMSO) or 10 mM NA for 96 h. A, B OCR in cybrids A and fibroblasts B after NA treatment; OCR expressed as pmoles O2/min and normalized for protein content, under basal conditions and after injection of oligomycin (O), carbonyl cianide 4-(trifluoromethoxy) phenylhydrazone (FCCP; F), rotenone (R) and antimycin A (AA). In cybrids, data are means ± SD of two experiments, analyzing two biological replicates. In fibroblasts, data are means ± SD of three experiments for Wt-F and of two experiments for H-F; only one experiment could be performed in I-F due to spontaneous heteroplasmy shift in culturing cells. C, D Western blot of OXPHOS subunits in cybrids C and fibroblasts D; ACTIN was used as loading control. A representative blot is shown for each protein. E Densitometry of OXPHOS subunits content in cybrids. Data of four independent experiments (biological replicates) are expressed as means and SEM, and are normalized to untreated cells. F Densitometry of OXPHOS subunits content in fibroblasts. Data are means and SD of three biological replicate for Wt-F and of two biological replicates for H-F; only one experiment could be performed in I-F due to spontaneous heteroplasmy shift in culturing cells; all data are normalized to untreated cells. G mtDNA content evaluation by qPCR in cybrids. All values are expressed as means and SEM of three biological replicates and are normalized to untreated cells. H Heteroplasmy level evaluation by snapshot method in cybrids. Values are expressed as means and SEM of three biological replicates. I mtDNA content evaluation by qPCR in fibroblasts. Data are means and SD of three biological replicates for Wt-F and of two biological replicates for H-F; only one experiment could be performed in I-F due to heteroplasmy shift in culturing cells. J Heteroplasmy level evaluation by snapshot method in fibroblasts. H-F values are expressed as means and SD of two biological replicates. Statistical analyses were performed using unpaired two-tail T-test. P value: * p < 0.05, ** p < 0.01, *** p < 0.001
Fig. 4
Fig. 4
PGC-1α steady over-expression in MERRF cybrids. Wt-cybrids and H-cybrids were transduced with either an empty or a PGC-1α expressing lentiviral vector and then puromycin-selected to generate steady over-expressing PGC-1α cybrids lines. A PGC-1α gene expression was evaluated by qPCR. ACTIN was used as reference gene. B Western blot of PGC-1α; ACTIN was used as loading control. A representative blot of three independent experiments (biological replicates) is shown. C Densitometry of PGC-1α protein content, normalized to the cybrids transduced with the empty plasmid. D ND1, E COX2 and F ATP6 gene expression evaluated by qPCR. ACTIN was used as reference gene. Data are means and SEM of three biological replicate and are normalized to the cells transduced with the empty plasmid. G Western Blot of OXPHOS subunits and of TOM20, VDAC e TFAM protein. ACTIN was used ad loading control. One representative of three independent experiment (biological replicates) is shown. H Densitometric analysis of OXPHOS subunits protein level. Data, normalized to the cybrids transduced with the empty plasmid, are means and SEM of six independent experiments (biological replicates). I Densitometric analysis of TOM20, VDAC and TFAM mitochondrial mass proteins. Data are means and SEM of three independent experiments (biological replicates) and are normalized to the cells transduced with the empty plasmid. J mtDNA content evaluation by qPCR. All data are means + SEM of six biological replicates and are normalized to the empty cells. K m.8344A > G mutation heteroplasmy evaluation by snapshot method. Values are expressed as means and SEM of three biological replicates. L OCR expressed as pmoles O2/min normalized for protein content, under basal conditions and after injection of oligomycin (O), carbonyl cyanide 4-(trifluoromethoxy) phenylhydrazone (FCCP; F), rotenone (R) and antimycin A (AA). Data are means ± SEM of three independent experiments (biological replicates). M Basal, ATP-linked and maximal respiration were calculated from OCR traces and reported in the graph. All values are means and SEM of three independent experiments (biological replicates). Statistical analyses were performed using unpaired two-tail T-test. P value: *p < 0.05, **p < 0.01, ***p < 0.001
Fig. 5
Fig. 5
Transiently PGC-1α overexpression in MERRF fibroblasts. Wt-fibroblasts and H-fibroblasts were transiently transduced (72 h) with lentiviral vectors to generate either empty or over-expressing PGC-1α fibroblasts lines. A PGC-1α gene expression was evaluated by qPCR. ACTIN was used as reference gene. B Western blot of PGC-1α; ACTIN was used as loading control. A representative blot of three independent experiments (biological replicates) is shown. C mtDNA content evaluation by qPCR. D m.8344A > G mutation heteroplasmy evaluation by SNaPshot method. E ND1, F COX2 and G ATP6 gene expressions were evaluated by qPCR. ACTIN was used as reference gene. Data are means and SEM of three biological replicates and are normalized to the cells transduced with the empty plasmid. H Western Blot of TOM20, VDAC e TFAM mitochondrial mass proteins. ACTIN was used ad loading control. One representative of three independent experiment (biological replicates) is shown. I Densitometric analysis of TOM20, VDAC e TFAM mitochondrial mass protein. J Western Blot of OXPHOS proteins. ACTIN was used ad loading control. One representative of three independent experiment (biological replicates) is shown. K Densitometric analysis of OXPHOS subunits protein levels. L OCR expressed as pmoles O2/min normalized for protein content, under basal conditions and after injection of oligomycin (O), carbonyl cyanide 4-(trifluoromethoxy) phenylhydrazone (FCCP; F), rotenone (R) and antimycin A (AA). M Basal, ATP-linked and maximal respiration were calculated from OCR traces and reported in the graph. All data are means and SEM of three independent experiments, analyzing three biological replicates, and are normalized to cells transduced with the empty plasmid. Statistical analyses were performed using unpaired two-tail T-test. P value: * p < 0.05, ** p < 0.01, *** p < 0.001
Fig. 6
Fig. 6
Mitochondrial respiration and mass assessment in MERRF fibroblasts treated with rapamycin. Wt-Fibroblasts, I-Fibroblasts and H-Fibroblasts were treated four weeks with 20 nM rapamycin. A Representative Western Blot of p-S6, S6 and LC3 proteins. ACTIN was used ad loading control. B Densitometric analyses of downstream target of mTORC1, p-S6 protein. C Densitometric analyses of LC3-II protein. D OCR expressed as pmoles O2/min normalized to cell number, under basal conditions and after injection of oligomycin (O), carbonyl cyanide 4-(trifluoromethoxy) phenylhydrazone (FCCP; F), rotenone (R) and antimycin A (AA). E Basal, ATP-linked and maximal respiration were calculated from OCR traces and reported in the graph. Data are means ± SEM of five experiments for Wt- and H-fibroblasts and of three experiments for I-fibroblasts. F Western Blot analyses of OXPHOS proteins, VDAC and TFAM mitochondrial mass proteins. One representative experiment is shown. Densitometric analyses of OXPHOS G and VDAC and TFAM proteins H. I mtDNA content evaluation by qPCR. J m.8344A > G mutation heteroplasmy evaluation by SNaPshot method. All data are normalized to untreated cells and, if not specifically indicated, are means and SD of six biological replicates for Wt-F, two biological replicates for I-F and four biological replicates for H-F. Statistical analyses were performed using unpaired two-tail T-test. P value: *p < 0.05, **p < 0.01, ***p < 0.001
Fig. 7
Fig. 7
Gene expression of mitochondrial biogenesis and TFEB pathways in MERRF fibroblasts treated with rapamycin. Wt-fibroblasts, I-fibroblasts and H-fibroblasts were treated four weeks with 20 nM rapamycin. Gene expression of PGC-1α (A), NRF1 (B), ND1 (C), COX2 (D), ATP6 (E), CTSD (F), LAMP1 (G), BECLIN (H) and p53 (I) evaluated by qPCR. ACTIN was used as reference gene. Data are normalized to untreated cells and are means and SD of four biological replicates for Wt-F and three biological replicates for H-F. Only one experiment is reported for I-F. Statistical analyses were performed using unpaired two-tail T-test. P value: *p < 0.05, **p < 0.01, ***p < 0.001

Similar articles

Cited by

References

    1. Altmann J, Büchner B, Nadaj-Pakleza A, Schäfer J, Jackson S, Lehmann D, et al. Expanded phenotypic spectrum of the m.8344A>G “MERRF” mutation: data from the German mitoNET registry. J Neurol. 2016;263(5):961–972. - PubMed
    1. Antonická H, Floryk D, Klement P, Stratilová L, Hermanská J, Houstková H, et al. Defective kinetics of cytochrome c oxidase and alteration of mitochondrial membrane potential in fibroblasts and cytoplasmic hybrid cells with the mutation for myoclonus epilepsy with ragged-red fibres ('MERRF’) at position 8344 nt. Biochem J. 1999;342(Pt 3):537–544. - PMC - PubMed
    1. Attardi G, Yoneda M, Chomyn A. Complementation and segregation behavior of disease-causing mitochondrial DNA mutations in cellular model systems. Biochim Biophys Acta Mol Basis Dis. 1995;1271(1):241–248. - PubMed
    1. Bentlage HACM, Attardi G. Relationship of genotype to phenotype in fibroblast-derived transmitochondrial cell lines carrying the 3243 mutation associated with the melas encephalomyopathy: shift towards mutant genotype and role of mtDNA copy number. Hum Mol Genet. 1996;5(2):197–205. - PubMed
    1. Berkovic SF, Carpenter S, Evans A, Karpati G, Shoubridge EA, Andermann F, et al. Myoclonus epilepsy and ragged-red fibres (MERRF). 1. A clinical, pathological, biochemical, magnetic resonance spectrographic and positron emission tomographic study. Brain. 1989;112(Pt 5):1231–1260. - PubMed

Publication types

LinkOut - more resources