

Assessing the associations between Aedes larval indices and dengue risk in Kalutara district, Sri Lanka: a hierarchical time series analysis from 2010 to 2019
- PMID: 35922821
- PMCID: PMC9351248
- DOI: 10.1186/s13071-022-05377-6
Assessing the associations between Aedes larval indices and dengue risk in Kalutara district, Sri Lanka: a hierarchical time series analysis from 2010 to 2019
Abstract
Background: Dengue is a major public health problem in Sri Lanka. Aedes vector surveillance and monitoring of larval indices are routine, long-established public health practices in the country. However, the association between Aedes larval indices and dengue incidence is poorly understood. It is crucial to evaluate lagged effects and threshold values of Aedes larval indices to set pragmatic targets for sustainable vector control interventions.
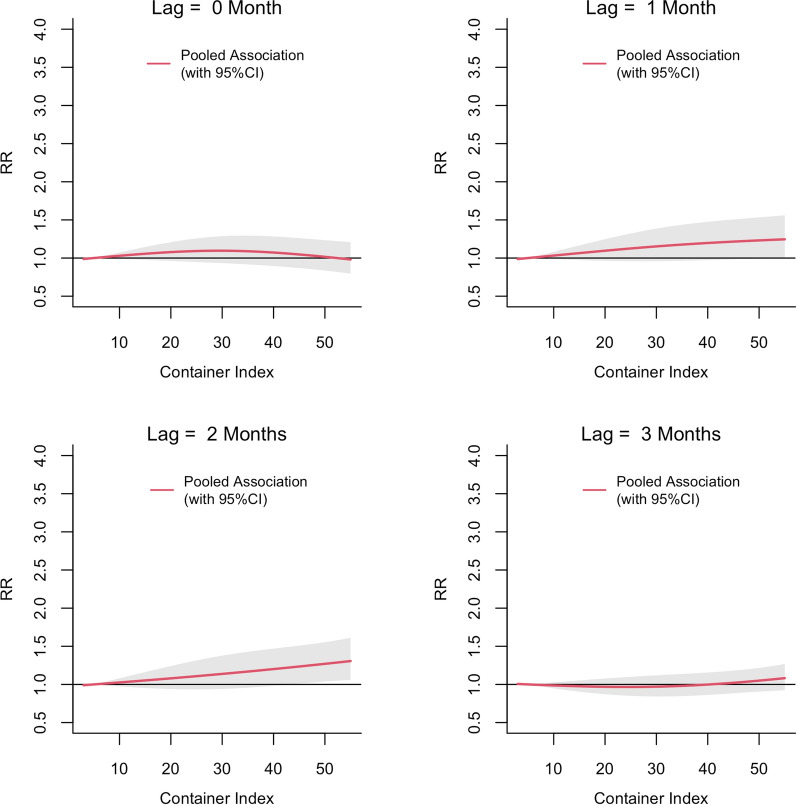
Methods: Monthly Aedes larval indices and dengue cases in all 10 Medical Officer of Health (MOH) divisions in Kalutara district were obtained from 2010 to 2019. Using a novel statistical approach, a distributed lag non-linear model and a two-staged hierarchical meta-analysis, we estimated the overall non-linear and delayed effects of the Premise Index (PI), Breteau Index (BI) and Container Index (CI) on dengue incidence in Kalutara district. A set of MOH division-specific variables were evaluated within the same meta-analytical framework to determine their moderator effects on dengue risk. Using generalized additive models, we assessed the utility of Aedes larval indices in predicting dengue incidence.
Results: We found that all three larval indices were associated with dengue risk at a lag of 1 to 2 months. The relationship between PI and dengue was homogeneous across MOH divisions, whereas that with BI and CI was heterogeneous. The threshold values of BI, PI and CI associated with dengue risk were 2, 15 and 45, respectively. All three indices showed a low to moderate accuracy in predicting dengue risk in Kalutara district.
Conclusions: This study showed the potential of vector surveillance information in Kalutara district in developing a threshold-based, location-specific early warning system with a lead time of 2 months. The estimated thresholds are nonetheless time-bound and may not be universally applicable. Whenever longitudinal vector surveillance data areavailable, the methodological framework we propose here can be used to estimate location-specific Aedes larval index thresholds in any other dengue-endemic setting.
Keywords: Aedes larval indices; Dengue risk; Kalutara; Lags; Sri Lanka; Thresholds.
© 2022. The Author(s).
Conflict of interest statement
The authors declare that they have no competing interests.
Figures


References
-
- WHO. Dengue: guidelines for diagnosis, treatment, prevention and control. 2009. https://books.google.co.in/books?hl=en&lr=&id=dlc0YSIyGYwC&oi=fnd&pg=PP2.... Accessed 12 Aug 2020. - PubMed
-
- Vitarana T, Jayakuru WS, Withane N. Historical account of dengue haemorrhagic fever in Sri Lanka. WHO Regional Office for South-East Asia. 1997. https://apps.who.int/iris/handle/10665/148517. Accessed 12 Aug 2020.
-
- Epidemiology Unit Ministry of Health Sri Lanka. Trends. http://www.epid.gov.lk/web/index.php?option=com_casesanddeaths&Itemid=44.... Accessed 1 Nov 2020.
Publication types
MeSH terms
Grants and funding
LinkOut - more resources
Full Text Sources
Medical
Research Materials
Miscellaneous
