

Irisin enhances chondrogenic differentiation of human mesenchymal stem cells via Rap1/PI3K/AKT axis
- PMID: 35922833
- PMCID: PMC9351134
- DOI: 10.1186/s13287-022-03092-8
Irisin enhances chondrogenic differentiation of human mesenchymal stem cells via Rap1/PI3K/AKT axis
Abstract
Background: Human mesenchymal stem cells (hMSCs) have been proven to have inherent chondrogenic differentiation potential, which appears to be used in cartilage regeneration. Increasing evidence suggests that irisin enhances osteoblast differentiation of MSCs, but little is known about its potential on chondrogenic differentiation.
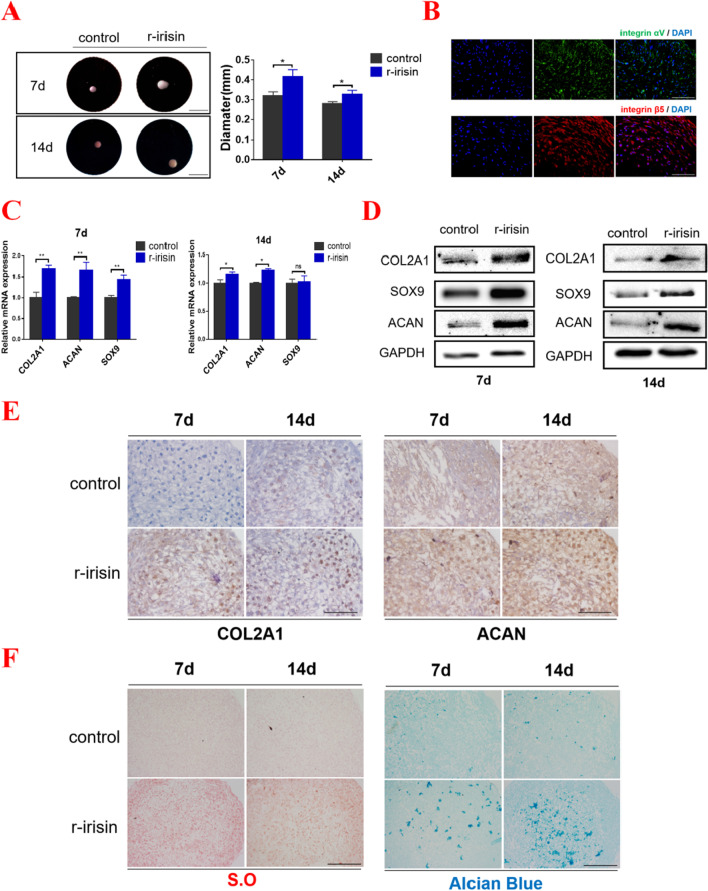
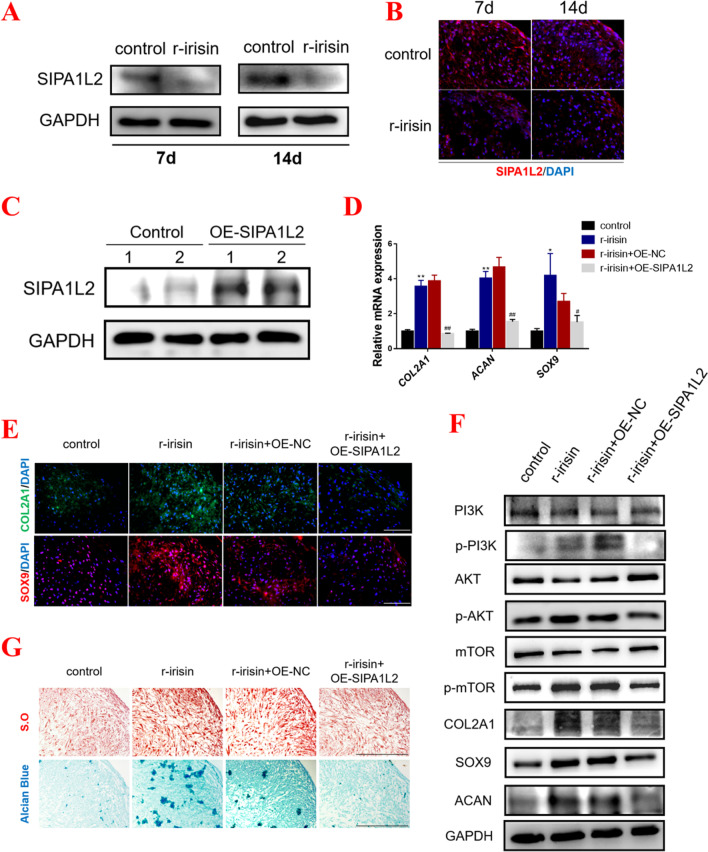
Methods: In the study, we investigated the effects of irisin on chondrogenic differentiation of hMSCs using a high-density pellet culture system. The cartilage pellets were evaluated by morphology, and the metabolism of cartilage matrix was detected by qPCR, western blot and immunohistochemistry. Next, RNA-seq was performed to explore the underlying mechanism. Furthermore, using the transduction of plasmid, miRNAs mimics and inhibitor, the activation of Rap1/PI3K/AKT axis, the expression level of SIPA1L2, and the functional verification of miR-125b-5p were detected on day 7 of chondrogenic differentiation of hMSCs.
Results: Compared with the controls, we found that irisin treatment could significantly enhance the chondrogenic differentiation of hMSCs, enlarge the induced-cartilage tissue and up-regulate the expression levels of cartilage markers. RNA-seq indicated that irisin activated the Rap1 and PI3K/AKT signaling pathway, and the lower expression level of SIPA1L2 and the higher expression level of miR-125b-5p were found in irisin-treated group. Further, we found that irisin treatment could up-regulate the expression level of miR-125b-5p, targeting SIPA1L2 and consequently activating the Rap1/PI3K/AKT axis on the process of chondrogenic differentiation of hMSCs.
Conclusions: Collectively, our study reveals that irisin can enhance chondrogenic differentiation of hMSCs via the Rap1/PI3K/AKT pathway, suggesting that irisin possesses prospects in cartilage regeneration.
Keywords: Chondrogenic differentiation; Human mesenchymal stem cells; Irisin; Rap1/PI3K/AKT signaling pathway; SIPA1L2; miR-125b-5p.
© 2022. The Author(s).
Conflict of interest statement
We declare that there is no conflict of interest regarding the publication of this paper.
Figures


Similar articles
-
Overexpression of miR-338-5p in exosomes derived from mesenchymal stromal cells provides neuroprotective effects by the Cnr1/Rap1/Akt pathway after spinal cord injury in rats.Neurosci Lett. 2021 Sep 14;761:136124. doi: 10.1016/j.neulet.2021.136124. Epub 2021 Jul 22. Neurosci Lett. 2021. PMID: 34302891
-
Angelica sinensis polysaccharide facilitates chondrogenic differentiation of adipose-derived stem cells via MDK-PI3K/AKT signaling cascade.Biomed Pharmacother. 2024 Oct;179:117349. doi: 10.1016/j.biopha.2024.117349. Epub 2024 Aug 26. Biomed Pharmacother. 2024. PMID: 39191028
-
Stage-Dependent Activity and Pro-Chondrogenic Function of PI3K/AKT during Cartilage Neogenesis from Mesenchymal Stromal Cells.Cells. 2022 Sep 23;11(19):2965. doi: 10.3390/cells11192965. Cells. 2022. PMID: 36230927 Free PMC article.
-
Targets of B-cell antigen receptor signaling: the phosphatidylinositol 3-kinase/Akt/glycogen synthase kinase-3 signaling pathway and the Rap1 GTPase.Immunol Rev. 2000 Aug;176:47-68. doi: 10.1034/j.1600-065x.2000.00601.x. Immunol Rev. 2000. PMID: 11043767 Review.
-
Cardioprotective Effects of Exercise: The Role of Irisin and Exosome.Curr Vasc Pharmacol. 2024;22(5):316-334. doi: 10.2174/0115701611285736240516101803. Curr Vasc Pharmacol. 2024. PMID: 38808716 Review.
Cited by
-
Irisin as an agent for protecting against osteoporosis: A review of the current mechanisms and pathways.J Adv Res. 2024 Aug;62:175-186. doi: 10.1016/j.jare.2023.09.001. Epub 2023 Sep 3. J Adv Res. 2024. PMID: 37669714 Free PMC article. Review.
-
Irisin in the modulation of bone and cartilage homeostasis: a review on osteoarthritis relief potential.Front Physiol. 2025 Apr 17;16:1570157. doi: 10.3389/fphys.2025.1570157. eCollection 2025. Front Physiol. 2025. PMID: 40313878 Free PMC article. Review.
-
Deep-supercooling preservation of stem cell spheroids for chondral defect repairment.Stem Cell Reports. 2024 Dec 10;19(12):1665-1676. doi: 10.1016/j.stemcr.2024.10.008. Epub 2024 Nov 21. Stem Cell Reports. 2024. PMID: 39577429 Free PMC article.
-
Heat acclimation defense against exertional heat stroke by improving the function of preoptic TRPV1 neurons.Theranostics. 2025 Jan 1;15(4):1376-1398. doi: 10.7150/thno.101422. eCollection 2025. Theranostics. 2025. PMID: 39816678 Free PMC article.
-
Manipulation of Oxygen Tension in Damaged Regions via Hypoxia-Induced IPN Hydrogel Microspheres for Intervertebral Disc Regeneration.Adv Sci (Weinh). 2025 Jun;12(22):e2417570. doi: 10.1002/advs.202417570. Epub 2025 Apr 15. Adv Sci (Weinh). 2025. PMID: 40231808 Free PMC article.
References
-
- Griffin MF, Ibrahim A, Seifalian AM, et al. Argon plasma modification promotes adipose derived stem cells osteogenic and chondrogenic differentiation on nanocomposite polyurethane scaffolds; implications for skeletal tissue engineering. Mater Sci Eng C Mater Biol Appl. 2019;105:110085. doi: 10.1016/j.msec.2019.110085. - DOI - PMC - PubMed
-
- Mistry AS, Mikos AG. Tissue engineering strategies for bone regeneration. Adv Biochem Eng Biotechnol. 2005;94:1–22. - PubMed
Publication types
MeSH terms
Substances
LinkOut - more resources
Full Text Sources
Miscellaneous
