. 2022 Aug 3;19(1):52.
doi: 10.1186/s12989-022-00494-7.

Macrophage-mediated tissue response evoked by subchronic inhalation of lead oxide nanoparticles is associated with the alteration of phospholipases C and cholesterol transporters

Affiliations

Macrophage-mediated tissue response evoked by subchronic inhalation of lead oxide nanoparticles is associated with the alteration of phospholipases C and cholesterol transporters

Tereza Smutná et al. Part Fibre Toxicol. .

Abstract

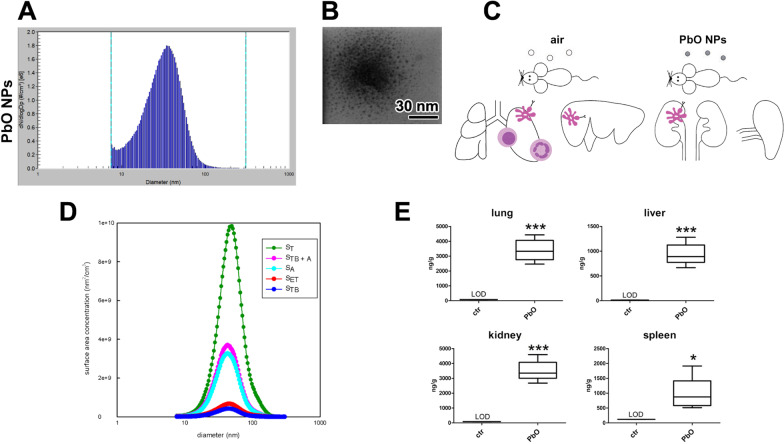
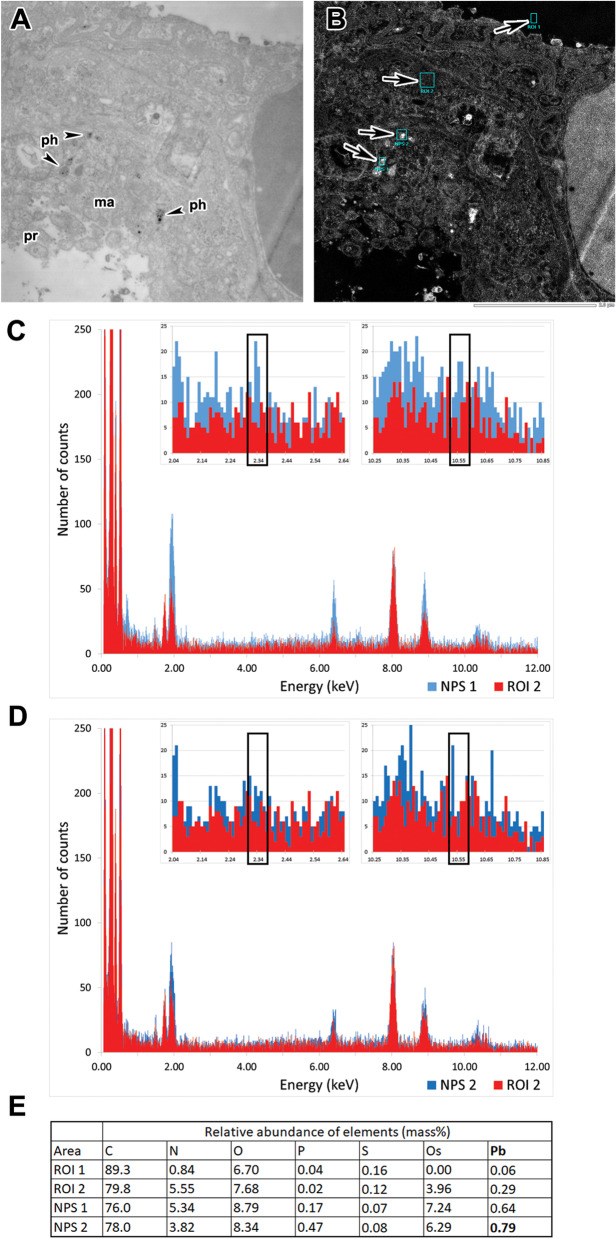
Background: Inhalation of lead oxide nanoparticles (PbO NPs), which are emitted to the environment by high-temperature technological processes, heavily impairs target organs. These nanoparticles pass through the lung barrier and are distributed via the blood into secondary target organs, where they cause numerous pathological alterations. Here, we studied in detail, macrophages as specialized cells involved in the innate and adaptive immune response in selected target organs to unravel their potential involvement in reaction to subchronic PbO NP inhalation. In this context, we also tackled possible alterations in lipid uptake in the lungs and liver, which is usually associated with foam macrophage formation.

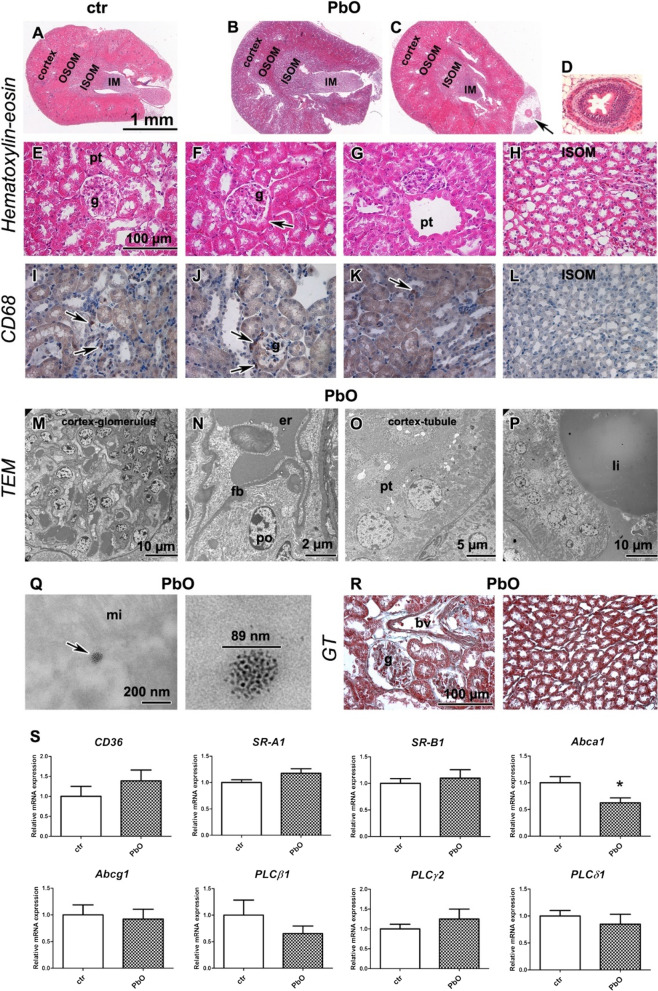
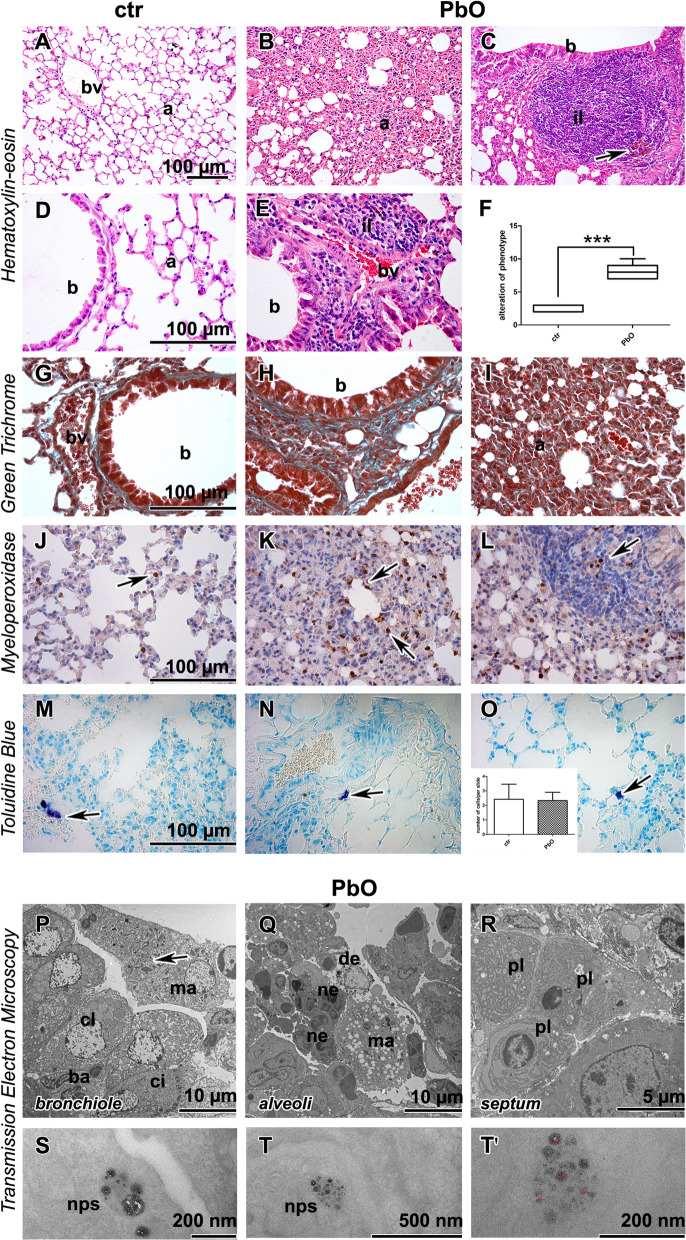
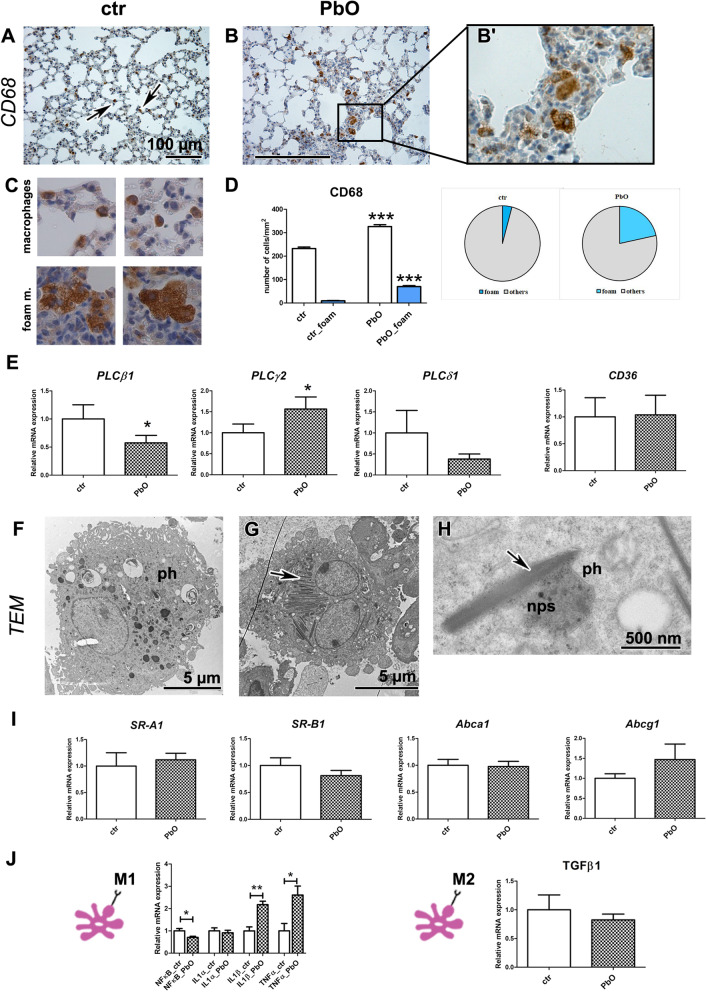
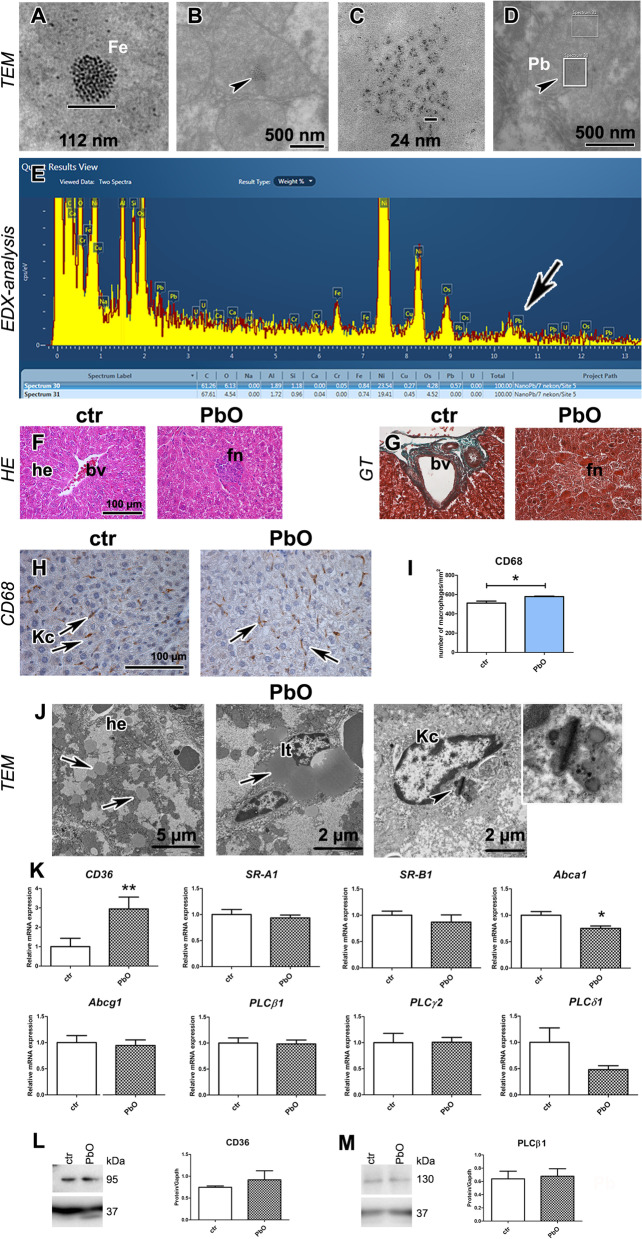
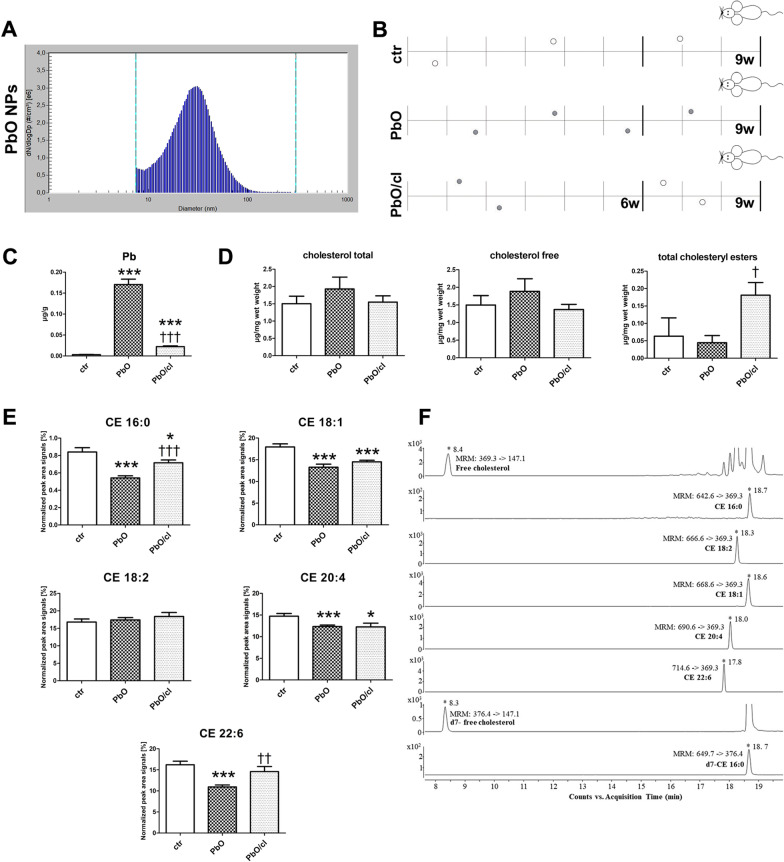
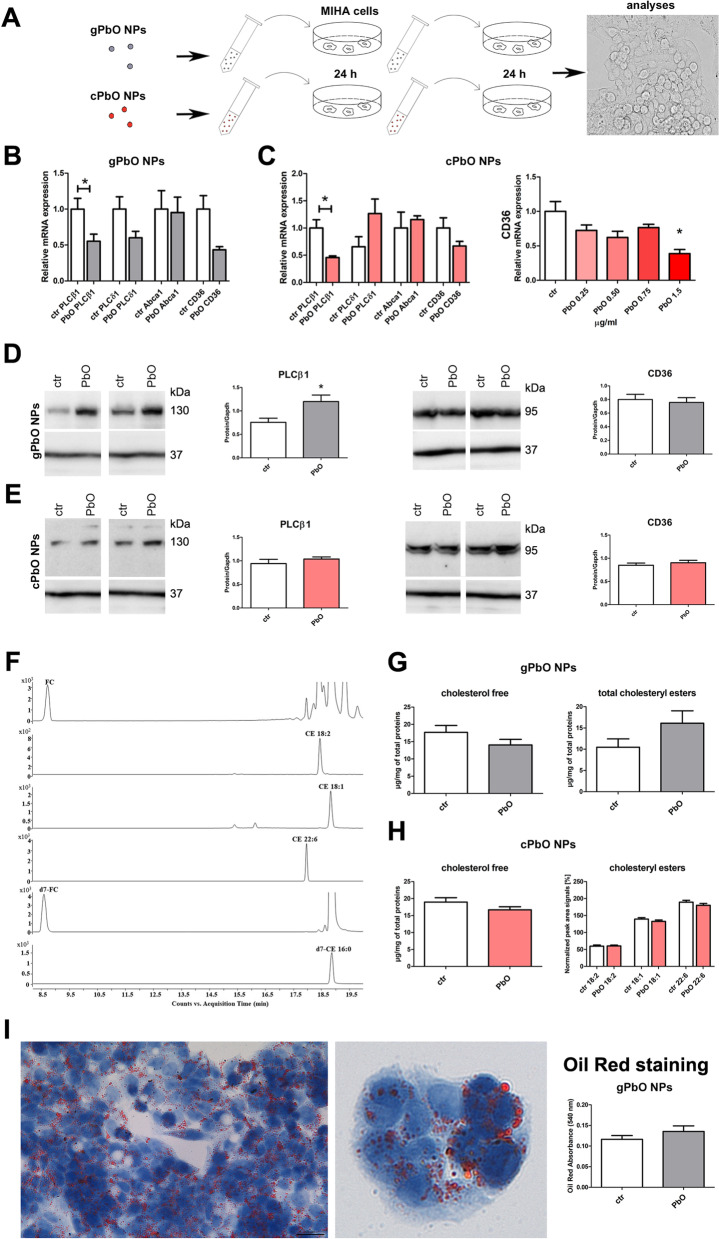
Results: The histopathological analysis of PbO NP exposed lung revealed serious chronic inflammation of lung tissues. The number of total and foam macrophages was significantly increased in lung, and they contained numerous cholesterol crystals. PbO NP inhalation induced changes in expression of phospholipases C (PLC) as enzymes linked to macrophage-mediated inflammation in lungs. In the liver, the subchronic inhalation of PbO NPs caused predominantly hyperemia, microsteatosis or remodeling of the liver parenchyma, and the number of liver macrophages also significantly was increased. The gene and protein expression of a cholesterol transporter CD36, which is associated with lipid metabolism, was altered in the liver. The amount of selected cholesteryl esters (CE 16:0, CE 18:1, CE 20:4, CE 22:6) in liver tissue was decreased after subchronic PbO NP inhalation, while total and free cholesterol in liver tissue was slightly increased. Gene and protein expression of phospholipase PLCβ1 and receptor CD36 in human hepatocytes were affected also in in vitro experiments after acute PbO NP exposure. No microscopic or serious functional kidney alterations were detected after subchronic PbO NP exposure and CD68 positive cells were present in the physiological mode in its interstitial tissues.

Conclusion: Our study revealed the association of increased cholesterol and lipid storage in targeted tissues with the alteration of scavenger receptors and phospholipases C after subchronic inhalation of PbO NPs and yet uncovered processes, which can contribute to steatosis in liver after metal nanoparticles exposure.

Keywords: Cholesterol metabolism; Inhalation; Lead oxide nanoparticles; Liver macrophages; Lung macrophages.


Conflict of interest statement

The authors declared that there is no conflict of interest.

Figures

Fig. 1
Fig. 1
Characterization of PbO NPs. A Particle number-size distribution of PbO NPs in the inhalation chambers measured by Scanning Mobility Particle Sizer (SMPS). B STEM image of PbO NPs. C Design of the inhalation experiment. Symbols of light circle indicate clean air, and symbols of dark circles indicate PbO NPs. D Surface area of PbO NP size distribution (dS/dlogDp) calculated according to the ICRP deposition model. The surface area of fractions of PbO NPs deposited in the extrathoracic (SET), tracheobronchiolar (STB) and alveolar region (SA) of lungs, ST—the total surface area of generated PbO NPs, STB+A—the lung-deposited surface area. E Analysis of Pb concentration (ng/g) in organs following 11 weeks of PbO NP inhalation. Limit of detection in the lung, liver, kidney, and spleen was 75, 13, 84, and 117 ng/g Pb, respectively. The graphs values denote average ± SD; *p < 0.05; ***p < 0.001 by unpaired t-test
Fig. 2
Fig. 2
Kidney after 11-week PbO NP inhalation. AC Kidney in overview image in HE staining (cortex, outer medulla divided into outer and inner stripe—OSOM, ISOM, inner medulla—IM) in control (A) and PbO NP exposed animals (B, C), arrow shows ureter. Scale bar in panels A-C = 1 mm. D Ureter in detail. E Kidney cortex of control animals with glomerulus (g) and proximal (pt) and distal tubules. F, G Kidney of PbO NPs treated samples exhibits metaplasia (arrow) of glomerular (g) parietal epithelium of Bowman’s capsule (F) or dilatation of proximal tubules (pt, G). H Kidney medulla without pathological alternations after exposure to PbO NPs. IL Detection of CD68-positive cells (marker of macrophages) in kidney (arrows). Scale bar in panels = 100 µm. MQ TEM images of kidney after inhalation of PbO NPs. M Renal glomerulus (glo) of characteristic apperance. N) typical podocyte (po) with pedicles, capillary with erythrocytes (er) and filtration barrier (fb) of kidney without pathological alteration. O Proximal tubule (pt) without damage. P Large lipid vacuole (li) present in blood vessel. Q Agglomerate of PbO nanoparticles in the epithelial cell of PT (arrow) next to mitochondria (mi). Scale bars are displayed individually for each picture. R Collagen fibers stained with Green Trichrome (GT) were found predominantly around blood vessels (bv). Scale bar in panels = 100 µm. S Gene expression of receptors CD36, SR-A1, Abca1, Abcg1, SR-B1, and phospholipases C after PbO NP inhalation. The graphs values indicate average ± SD; *p < 0.05 by unpaired t-test
Fig. 3
Fig. 3
Lung after 11-week PbO NP inhalation. A, D Lungs in control animals without alternations. B, C, E Exposure to PbO NPs caused remodeling of lung tissue in alveolar areas (a). There are peribronchiolar (b) or perivascular (bv) inflammatory infiltrates of leukocytes (il) after PbO NPs inhalation. Arrow shows hemosiderin. F Evaluation of histopathological changes after 11 weeks of lead oxide nanoparticle inhalation according to the Table S1. The graphs values denote average ± SD; ***p < 0.001 by unpaired t-test. GI Amount of collagen fibres (green) is not changed after inhalation of PbO NPs. Collagen fibers are around blood vessels (bv) and bronchioles (b). There are not any collagen fibers in alveolar areas despite serious remodeling. JL MPO detection in lung tissue. Arrows display myeloperoxidase-positive cells—neutrophils. MO Mastocytes (arrows) in lungs, insert displays the number of mastocytes per slide. Scale bar in all panels = 100 µm. PR The ultrastructural morphology of the lung tissue with inflammatory features. P Terminal bronchiole lined with secretory club (cl), basal (ba) and ciliated (ci) cells; macrophage (ma) with cholesterol crystals inside (arrow) the lumen. Q Numerous macrophages (ma), neutrophils (ne) and abundant cell debris (de) in lung alveoli. R Clump of plasma cells (pl) around vessel in alveolar septum. S, T, T′ Endosomes with PbO nanoparticles (nps) in pneumocyte type I. Scale bars are displayed individually for each picture
Fig. 4
Fig. 4
Detection of Pb content in lung nanoparticles by EDS. A, B STEM images of ultrathin sections collected with brightfield detector (A) with detecting angle 9.8 mrad and HAADF detector (B) detecting angle of 24.4–89.4 mrad. Alveolar macrophage (ma) with cytoplasmic processes (pr) and phagosomes (ph) with nanoparticles (arrowheads) in lung tissue after PbO NP inhalation. Cyan rectangles on (B) outline areas from which EDS spectra were recorded with ROI 1 being empty resin, ROI 2 being cytoplasm without any dense objects and NPS 1 and 2 marking phagosomes with nanoparticles. C, D EDS spectra with spectrum of cytoplasm (ROI 2) in red and spectra of NPS 1 and 2, respectively, in blue. Inserts show details of measured spectra with rectangles marking major peaks Pb Ma at 2.34 keV and Pb La at 10.55 keV. E Table summarizes estimates of relative mass of different elements in outlined regions of interest based on standard-less quantitative analysis
Fig. 5
Fig. 5
Lung macrophages after 11-week PbO NP inhalation. A, B, B′ Detection of CD68-positive cells (marker of macrophages) in lungs (arrows). Scale bar in panels = 100 µm. C CD68-positive cells labelled as typical macrophages (two upper images) or foam macrophages (two lower images) at the same magnification in the slides. Differences in size and cytoplasm morphology of typical or foam macrophages are well distinguishable. D The number of macrophages, including foam macrophages, was significantly increased compared with the control group (the graphs values indicate average ± SD; ***p < 0.001 by unpaired t-test. E Gene expression of phospholipases C, and receptor CD36 after PbO NP inhalation. The graphs values indicate average ± SD; *p < 0.05 compared with the corresponding control group (ctr) by unpaired t-test. F, G TEM images of foam alveolar macrophages with phagosomes (ph) in PbO NP group of animals. Arrow indicates cholesterol crystals in cytoplasm of macrophage. H Close interaction between phagosome (ph) with nanoparticles (nps) and cholesterol crystal (arrow). Scale bars are displayed individually for each picture. I Gene expression of receptors SR-A1, SR-B1, Abca1 and Abcg1 after PbO NP inhalation. The graphs values indicate average ± SD. J Gene expression of selected markers specific for M1 or M2 macrophage populations. The graphs values indicate average ± SD; *p < 0.05; **p < 0.01 compared with the corresponding control group (ctr) by unpaired t-test
Fig. 6
Fig. 6
Liver after 11-week PbO NP inhalation. A Ferritin agglomerate (sized 112 nm). B Hepatocyte mitochondria (mi) with agglomerates of PbO nanoparticles (arrowheads) surrounded with electron-dense matrix. C Detail of agglomerates of PbO nanoparticles (size range 10–40 nm). D Hepatocyte mitochondrion with ROI windows analyzed inside. E SEM in transmission mode, using TESCAN RSTEM detector, and energy-dispersive X-ray spectroscopy (X-EDS) of lead treated samples of liver. Data obtained from two ROI windows analyzed inside hepatocyte mitochondria (D—with and without NPs). Spectra were compared with a reference sample and analyzed using Oxford AZtec. Presence of Pb was confirmed by comparing reference Spectrum 31 (without NPs) and non-reference Spectrum 30 (with NPs, arrowhead on image D). The peak displays increased signal at a spectral position of Pb (arrow on graph E). Nickel was observed during analysis as it was issued from the grid and osmium from post-fixation. F Liver in control and PbO NP treated animals (HE staining); bv blood vessels, he hepatocytes, fn focal necrosis. Scale bar in all panels = 100 µm. G Collagen fibers (green) in liver are around blood vessel (bv) in both groups (GT staining). There is no presence of fibrosis in focal necrosis (fn). Scale bar in all panels = 100 µm. H Detection of CD68-positive cells (marker of macrophages, Kc, Kupffer cells) in liver (arrows). Scale bar in panels = 100 µm. I The number of macrophages was significantly increased compared with the control group (the graphs values indicate average ± SD; *p < 0.05). J TEM images of hepatocytes (he) with lipid droplets (arrows), Ito cell (It) with lipid droplets (arrow), and Kupffer cell (Kc) with phagosomes. Arrowhead displays cholesterol crystal in phagosome. Scale bars are displayed individually for each picture. K Gene expression of receptors CD36, SR-A1, SR-B1, Abca1, Abcg1 and phospholipases C after PbO NP inhalation. The graphs values indicate average ± SD; *p < 0.05, **p < 0.01 by unpaired t-test. L Protein expression level of receptor CD36 after PbO NP inhalation. The quantitative comparison of CD36 level was normalized to GAPDH level. M Protein expression level of phospholipase PLCβ1 after PbO NPs treatment. The quantitative comparison of PLCβ1 level was normalized to GAPDH level
Fig. 7
Fig. 7
Cholesterol and cholesteryl esters in liver after 9-week PbO NP inhalation. A Particle number-size distribution of PbO NPs in the inhalation chambers measured by Scanning Mobility Particle Sizer (SMPS) in the 2nd experiment. B Design of the inhalation experiment. One group of animals inhaled clean air (ctr) for a period up to 9 weeks, the second group inhaled air with PbO NPs (PbO), and the third group inhaled air with PbO NPs for 6 weeks and thereafter clean air for following 3 weeks (PbO/cl—clearance group). Symbols of light circle indicate clean air, and symbols of dark circles indicate PbO NPs. C Analysis of Pb concentration (µg/g) in blood. Limit of detection in the blood was 0.003 µg/g Pb. The graphs values indicate average ± SD for 5 mice/group; ***p < 0.001 compared with the corresponding control group (ctr), and †††p < 0.001 compared with the corresponding PbO NP group by unpaired t-test. D Quantification of total cholesterol, free cholesterol and total CEs analyzed in liver samples measured by Cholesterol/Cholesteryl Ester Quantitation Kit. The values in graphs indicate average ± SD for 4–5 mice/group; p < 0.05 compared with the corresponding PbO NP group by unpaired t-test. The amount of cholesterols given in µg was normalized to 1 mg of liver (wet weight). E LC–MS quantification of selected cholesteryl esters (CEs) analyzed in liver samples of control mice (ctr), mice inhaled PbO NPs (PbO) and clearance group of mice (PbO/cl). The graphs values indicate average ± SD for 4–5 mice/group; *p < 0.05; ***p < 0.001 compared with the corresponding control group (ctr), and ††p < 0.01, and †††p < 0.001 compared with the corresponding PbO NP group by unpaired t-test. The absolute abundance of free cholesterol is given in µg/mg wet weight. The value is normalized to signals of deutered internal standard and 1 mg of liver (wet weight). The relative quantitative responses of individual CEs are given as a peak area signal normalized to signal of internal standard and 1 mg of wet weight of liver (expressed as a percentage). F Representative extracted ion chromatograms (EIC-MRM) of LC-ESI MS/MS separation of selected lipids and internal deuterated standards used in all experiments. Several abundant species of CEs were extracted from livers of control mice. LC–MS data were obtained by using optimized experimental conditions as described in the "Methods" section. Retention times and typical MRM transitions used for quantification are shown for each compound
Fig. 8
Fig. 8
Effect of PbO NPs on liver cells. A Design of in-vitro experiments. Symbols of gray circle indicate in-situ generated PbO NPs (gPbO NPs), and symbols of red circles indicate commercially available PbO NPs (cPbO NPs). B Gene expression of selected phospholipases C, receptors CD36 and Abca1 in cells after gPbO NP treatment. The graphs values indicate average ± SD; *p < 0.05 compared with the corresponding control group (ctr) by unpaired t-test. C Gene expression of selected phospholipases C, receptors CD36 and Abca1 in cells after cPbO NP treatment. The graphs values indicate average ± SD; *p < 0.05 compared with the corresponding control group (ctr) by unpaired t-test. D Protein expression of phospholipase PLCβ1 and receptor CD36 after gPbO NP treatment. The quantitative comparison of protein levels was normalized to GAPDH levels. The band densities are representative of three independent experiments. The graphs values denote average ± SD; *p < 0.05 by unpaired t-test. E Protein expression of phospholipase PLCβ1 and receptor CD36 after cPbO NP treatment. The quantitative comparison of protein levels was normalized to GAPDH levels. The band densities are representative of three independent experiments. The graphs values denote average ± SD. F Representative graphs extracted ion chromatograms (EIC-MRM) of LC-ESI MS/MS separation of selected lipids and internal deuterated standards. Free cholesterol and three most abundant species of CEs were isolated from liver MIHA cells. G, H Quantification of free cholesterol and total and selected individual CEs analyzed in MIHA cells after gPbO NP or cPbO NP treatment measured by LC–MS and Cholesterol/Cholesteryl Ester Quantitation Kit. LC–MS provided information about changes of free cholesterol and three most abundant species of CEs. The total CEs and free cholesterol concentrations were obtained using the commercial kit. The abundance of free cholesterol is given in µg. The relative quantitative responses of individual CEs are given as normalized peak area signals (expressed as a percentage). All obtained values were normalized to the signals of deuterated internal standards and 1 mg of total proteins in the sample. The statistical significance was evaluated by unpaired t-test. I Oil Red staining of lipids in MIHA cells and measuring of their absorbance to quantify oil content after gPbO NP treatment

Similar articles

Cited by

References

    1. Aleksiichuk V, Omelchuk S, Sokurenko L, Kaminsky R, Kovalchuk O, Chaikovsky Y. The influence of lead nanoparticles on the morpho-functional changes of rat liver during the postexposure period. Microsc Res Technol. 2018;81(7):781–788. doi: 10.1002/jemt.23036. - DOI - PubMed
    1. Areecheewakul S, Adamcakova-Dodd A, Haque E, Jing X, Meyerholz DK, O’Shaughnessy PT. Time course of pulmonary inflammation and trace element biodistribution during and after sub-acute inhalation exposure to copper oxide nanoparticles in a murine model. Part Fibre Toxicol. 2022;19:40. doi: 10.1186/s12989-022-00480-z. - DOI - PMC - PubMed
    1. Asgharian B, Price OT, Oldham M, Chen LC, Saunders EL, Gordon T, Mikheev VB, Minard KR, Teeguarden JG. Computational modeling of nanoscale and microscale particle deposition, retention and dosimetry in the mouse respiratory tract. Inhal Toxicol. 2014;26(14):829–842. doi: 10.3109/08958378.2014.935535. - DOI - PMC - PubMed
    1. Bae YS, Lee HY, Jung YS, Lee M, Suh PG. Phospholipase Cγ in Toll-like receptor-mediated inflammation and innate immunity. Adv Biol Regul. 2017;63:92–97. doi: 10.1016/j.jbior.2016.09.006. - DOI - PubMed
    1. Bide RW, Armour SJ, Yee E. Allometric respiration/body mass data for animals to be used for estimates of inhalation toxicity to young adult humans. J Appl Toxicol. 2000;20(4):273–290. doi: 10.1002/1099-1263(200007/08)20:4<273::AID-JAT657>3.0.CO;2-X. - DOI - PubMed

Publication types

LinkOut - more resources