

The impacts of viral infection and subsequent antimicrobials on the microbiome-resistome of growing pigs
- PMID: 35922873
- PMCID: PMC9351240
- DOI: 10.1186/s40168-022-01312-0
The impacts of viral infection and subsequent antimicrobials on the microbiome-resistome of growing pigs
Abstract
Background: Antimicrobials are used in food-producing animals for purposes of preventing, controlling, and/or treating infections. In swine, a major driver of antimicrobial use is porcine reproductive and respiratory syndrome (PRRS), which is caused by a virus that predisposes infected animals to secondary bacterial infections. Numerous antimicrobial protocols are used to treat PRRS, but we have little insight into how these treatment schemes impact antimicrobial resistance (AMR) dynamics within the fecal microbiome of commercial swine. The aim of this study was to determine whether different PRRS-relevant antimicrobial treatment protocols were associated with differences in the fecal microbiome and resistome of growing pigs. To accomplish this, we used a metagenomics approach to characterize and compare the longitudinal wean-to-market resistome and microbiome of pigs challenged with PRRS virus and then exposed to different antimicrobial treatments, and a group of control pigs not challenged with PRRS virus and having minimal antimicrobial exposure. Genomic DNA was extracted from pen-level composite fecal samples from each treatment group and subjected to metagenomic sequencing and microbiome-resistome bioinformatic and statistical analysis. Microbiome-resistome profiles were compared over time and between treatment groups.
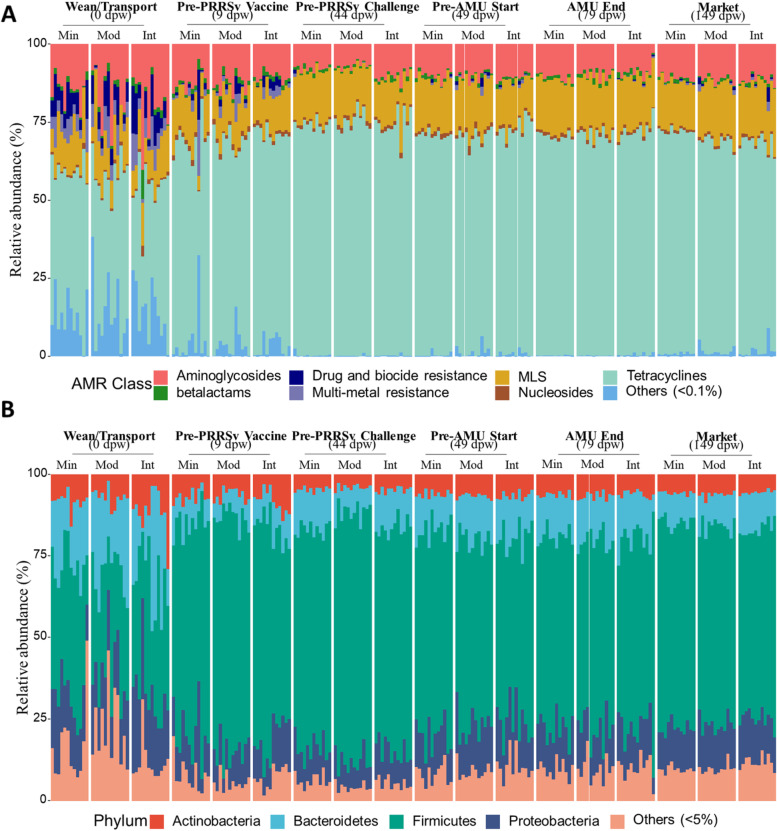
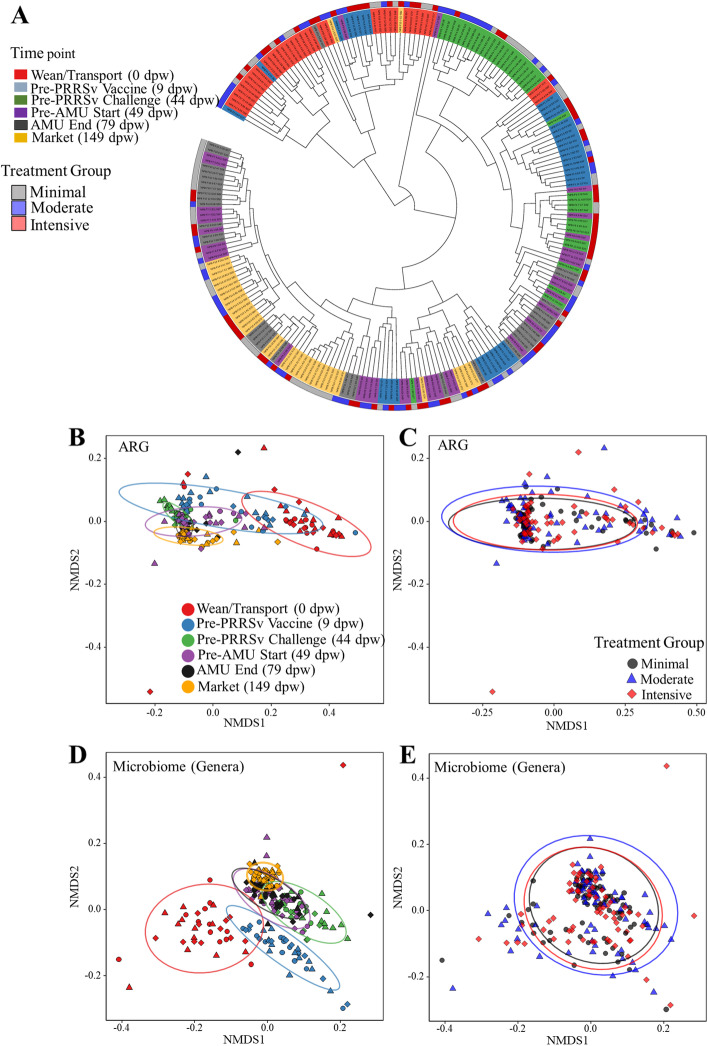
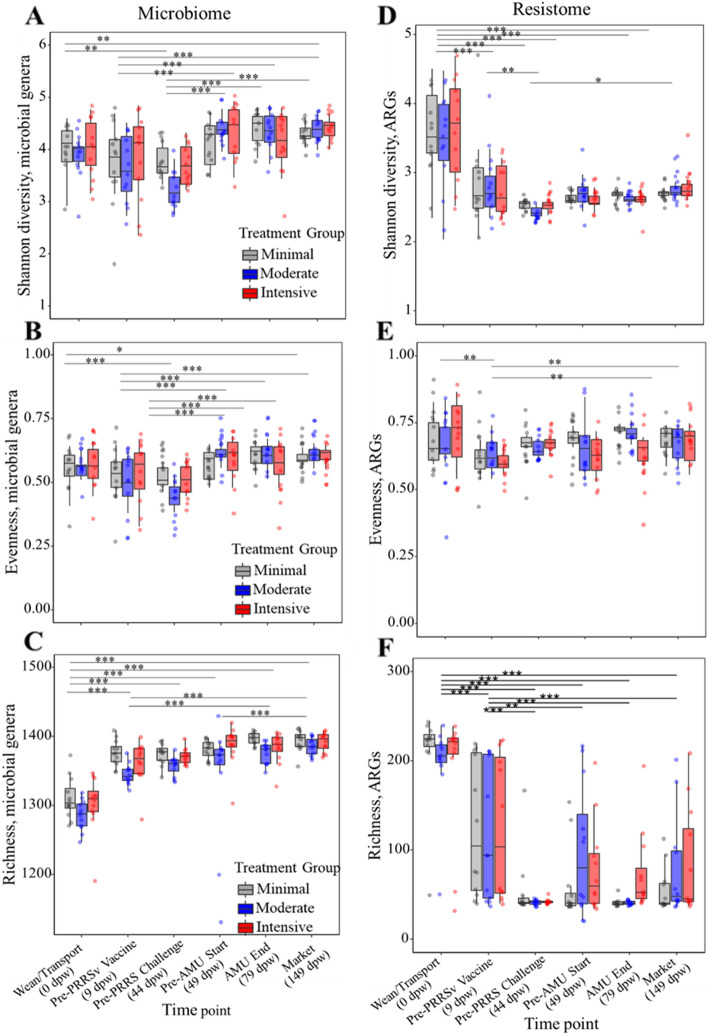
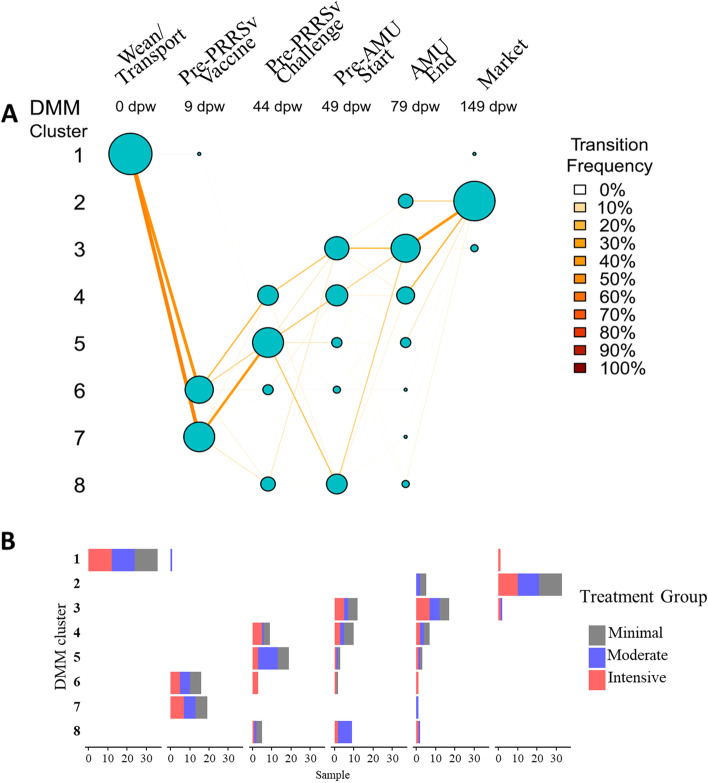
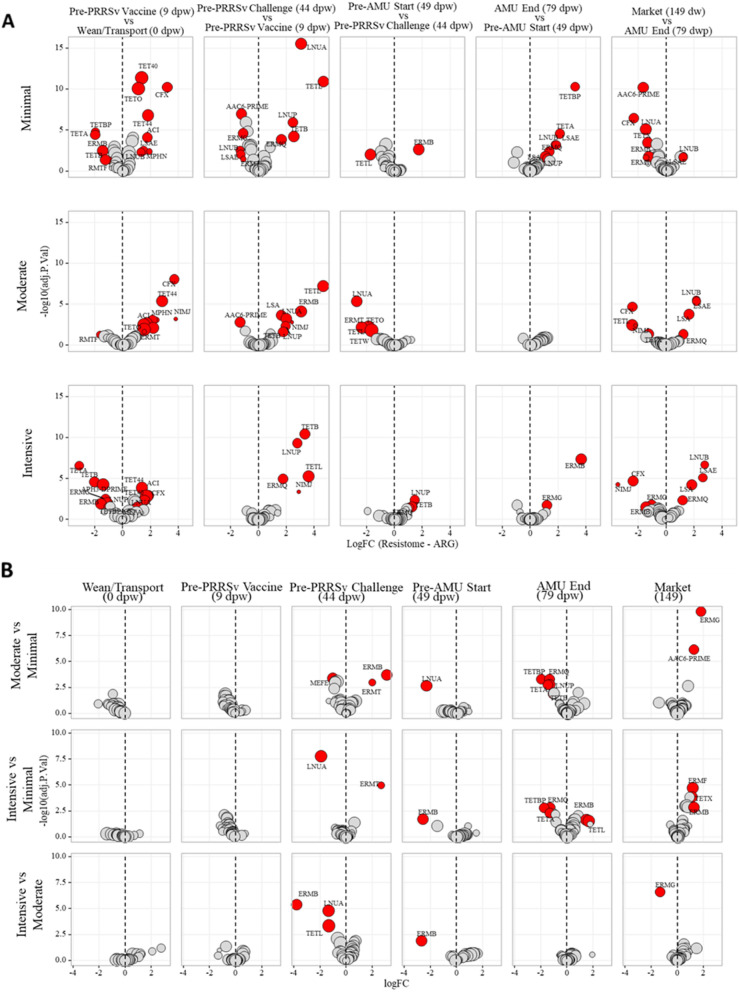
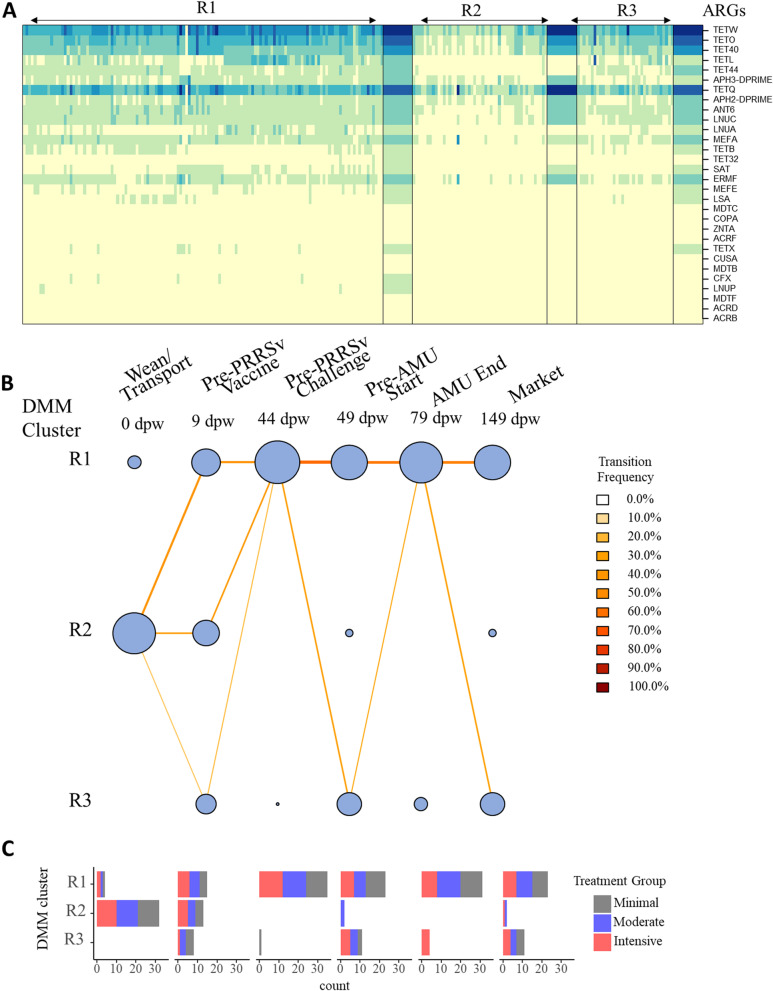
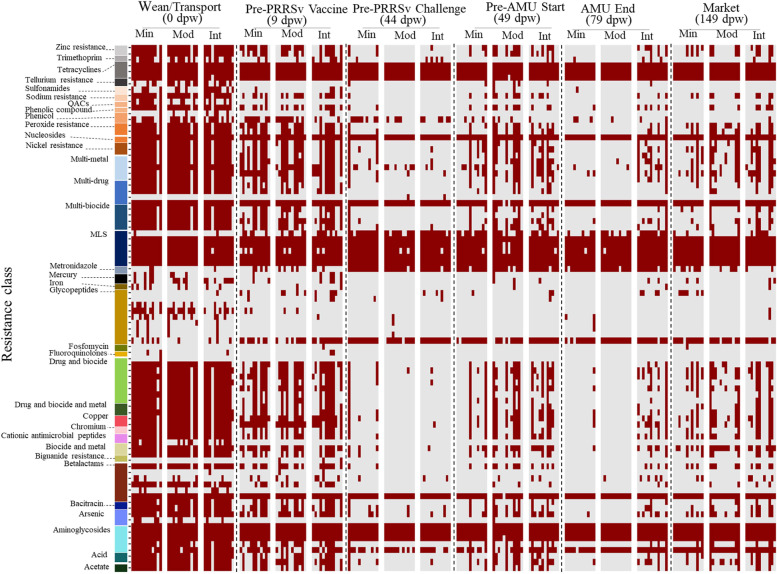
Results: Fecal microbiome and resistome compositions both changed significantly over time, with a dramatic and stereotypic shift between weaning and 9 days post-weaning (dpw). Antimicrobial resistance gene (ARG) richness and diversity were significantly higher at earlier time points, while microbiome richness and diversity were significantly lower. The post-weaning shift was characterized by transition from a Bacteroides-dominated enterotype to Lactobacillus- and Streptococcus-dominated enterotypes. Both the microbiome and resistome stabilized by 44 dpw, at which point the trajectory of microbiome-resistome maturation began to diverge slightly between the treatment groups, potentially due to physical clustering of the pigs. Challenge with PRRS virus seemed to correspond to the re-appearance of many very rare and low-abundance ARGs within the feces of challenged pigs. Despite very different antimicrobial exposures after challenge with PRRS virus, resistome composition remained largely similar between the treatment groups. Differences in ARG abundance between the groups were mostly driven by temporal changes in abundance that occurred prior to antimicrobial exposures, with the exception of ermG, which increased in the feces of treated pigs, and was significantly more abundant in the feces of these pigs compared to the pigs that did not receive post-PRRS antimicrobials.
Conclusions: The fecal microbiome-resistome of growing pigs exhibited a stereotypic trajectory driven largely by weaning and physiologic aging of the pigs. Events such as viral illness, antimicrobial exposures, and physical grouping of the pigs exerted significant yet relatively minor influence over this trajectory. Therefore, the AMR profile of market-age pigs is the culmination of the life history of the individual pigs and the populations to which they belong. Disease status alone may be a significant driver of AMR in market-age pigs, and understanding the interaction between disease processes and antimicrobial exposures on the swine microbiome-resistome is crucial to developing effective, robust, and reproducible interventions to control AMR. Video Abstract.
Keywords: Antimicrobial resistance; Metagenomics; Microbiome; Porcine reproductive; Respiratory syndrome; Swine.
© 2022. The Author(s).
Conflict of interest statement
The authors declare that they have no competing interests.
Figures
Similar articles
-
Evaluation of the Impact of Antimicrobial Use Protocols in Porcine Reproductive and Respiratory Syndrome Virus-Infected Swine on Phenotypic Antimicrobial Resistance Patterns.Appl Environ Microbiol. 2022 Jan 11;88(1):e0097021. doi: 10.1128/AEM.00970-21. Epub 2021 Oct 13. Appl Environ Microbiol. 2022. PMID: 34644164 Free PMC article.
-
Gut microbiome associations with outcome following co-infection with porcine reproductive and respiratory syndrome virus (PRRSV) and porcine circovirus type 2 (PCV2) in pigs immunized with a PRRS modified live virus vaccine.Vet Microbiol. 2021 Mar;254:109018. doi: 10.1016/j.vetmic.2021.109018. Epub 2021 Feb 16. Vet Microbiol. 2021. PMID: 33639341
-
A longitudinal investigation of the effects of age, dietary fiber type and level, and injectable antimicrobials on the fecal microbiome and antimicrobial resistance of finisher pigs.J Anim Sci. 2022 Sep 1;100(9):skac217. doi: 10.1093/jas/skac217. J Anim Sci. 2022. PMID: 35700748 Free PMC article.
-
Role of the microbiome in swine respiratory disease.Vet Microbiol. 2017 Sep;209:97-106. doi: 10.1016/j.vetmic.2017.02.017. Epub 2017 Mar 2. Vet Microbiol. 2017. PMID: 28318782 Review.
-
Good microbes, bad genes? The dissemination of antimicrobial resistance in the human microbiome.Gut Microbes. 2022 Jan-Dec;14(1):2055944. doi: 10.1080/19490976.2022.2055944. Gut Microbes. 2022. PMID: 35332832 Free PMC article. Review.
Cited by
-
Age influences the temporal dynamics of microbiome and antimicrobial resistance genes among fecal bacteria in a cohort of production pigs.Anim Microbiome. 2023 Jan 10;5(1):2. doi: 10.1186/s42523-022-00222-8. Anim Microbiome. 2023. PMID: 36624546 Free PMC article.
-
A first characterization of the microbiota-resilience link in swine.Microbiome. 2024 Mar 15;12(1):53. doi: 10.1186/s40168-024-01771-7. Microbiome. 2024. PMID: 38486255 Free PMC article.
-
The gut microbiome and resistome of conventionally vs. pasture-raised pigs.Microb Genom. 2023 Jul;9(7):mgen001061. doi: 10.1099/mgen.0.001061. Microb Genom. 2023. PMID: 37439777 Free PMC article.
-
Massive expansion of the pig gut virome based on global metagenomic mining.NPJ Biofilms Microbiomes. 2024 Aug 29;10(1):76. doi: 10.1038/s41522-024-00554-0. NPJ Biofilms Microbiomes. 2024. PMID: 39209853 Free PMC article.
-
The impact of pooling on the observed microbiome profile of preweaned piglet feces.FEMS Microbiol Ecol. 2025 May 20;101(6):fiaf058. doi: 10.1093/femsec/fiaf058. FEMS Microbiol Ecol. 2025. PMID: 40478755 Free PMC article.
References
-
- Holtkamp DJ. Assessment of the economic impact of porcine reproductive and respiratory syndrome virus on United States pork producers. J Swine Health Prod. 2013;21:72–84.
Publication types
MeSH terms
Substances
LinkOut - more resources
Full Text Sources
