

Serum lipidomic determinants of human diabetic neuropathy in type 2 diabetes
- PMID: 35923113
- PMCID: PMC9463947
- DOI: 10.1002/acn3.51639
Serum lipidomic determinants of human diabetic neuropathy in type 2 diabetes
Abstract
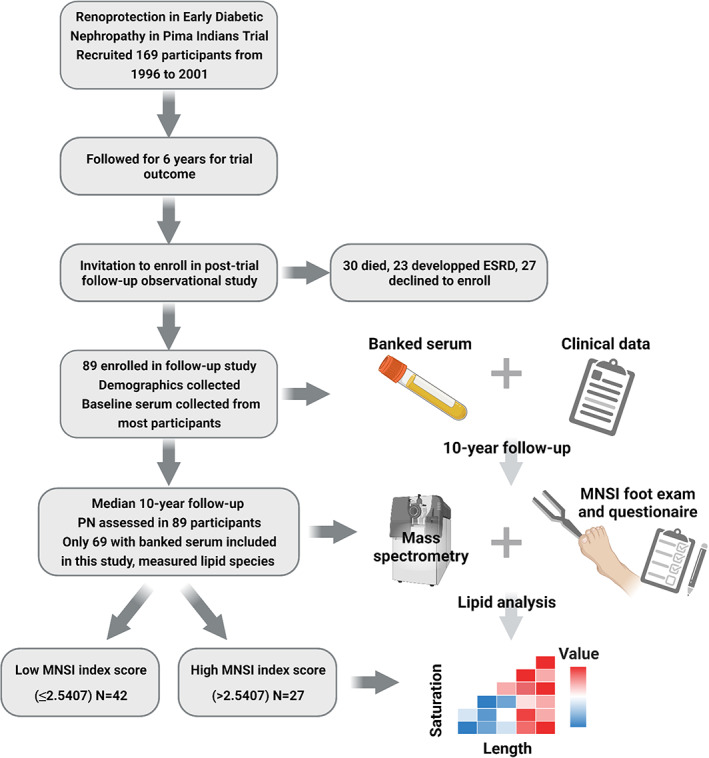
Objective: The serum lipidomic profile associated with neuropathy in type 2 diabetes is not well understood. Obesity and dyslipidemia are known neuropathy risk factors, suggesting lipid profiles early during type 2 diabetes may identify individuals who develop neuropathy later in the disease course. This retrospective cohort study examined lipidomic profiles 10 years prior to type 2 diabetic neuropathy assessment.
Methods: Participants comprised members of the Gila River Indian community with type 2 diabetes (n = 69) with available stored serum samples and neuropathy assessment 10 years later using the combined Michigan Neuropathy Screening Instrument (MNSI) examination and questionnaire scores. A combined MNSI index was calculated from examination and questionnaire scores. Serum lipids (435 species from 18 classes) were quantified by mass spectrometry.
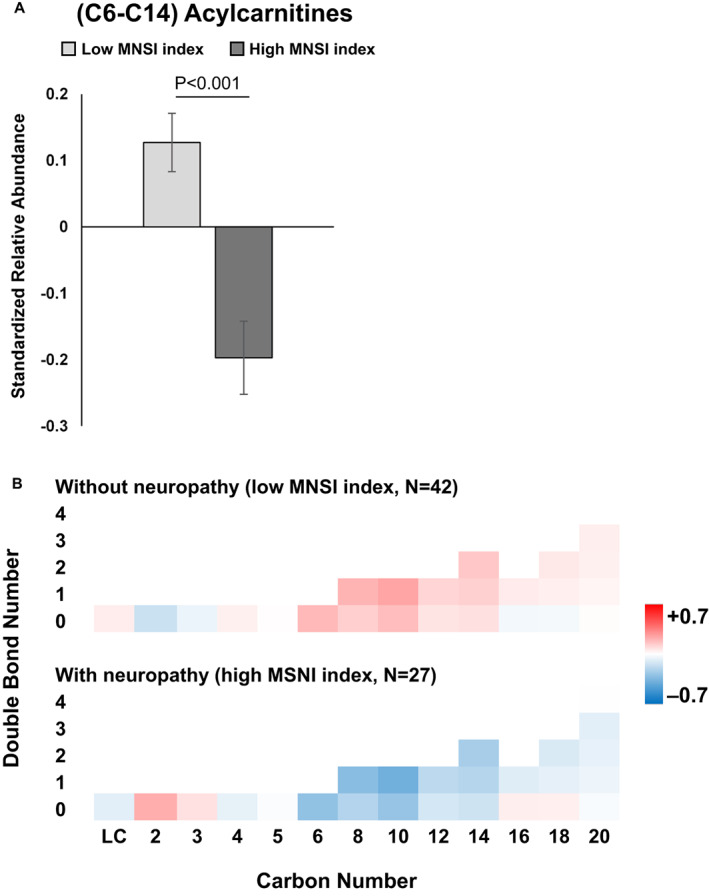
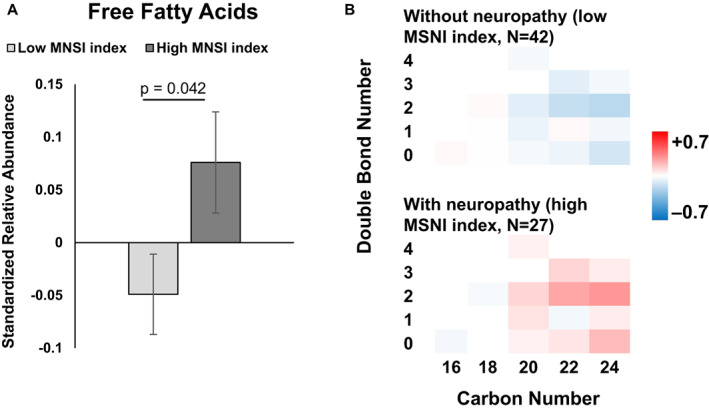
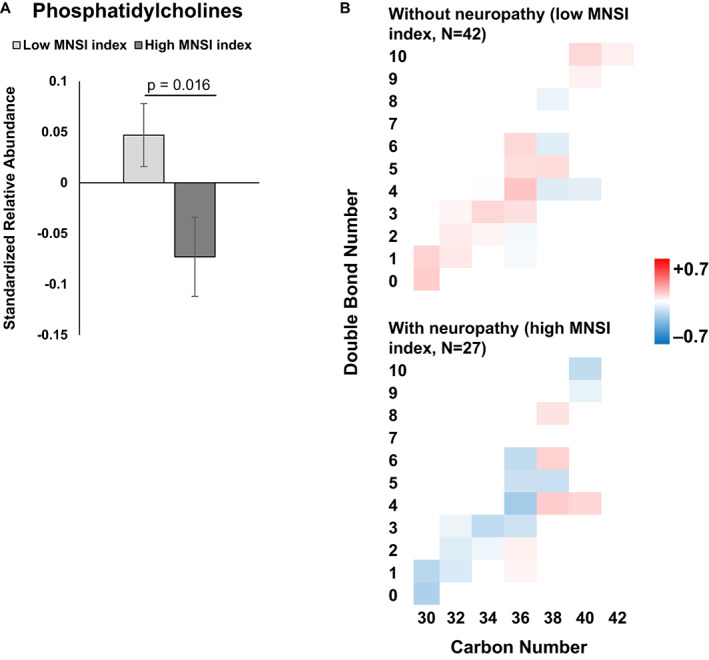
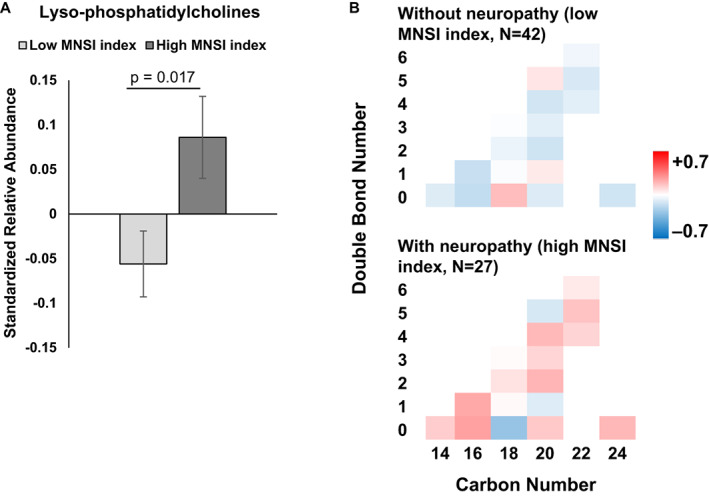
Results: The cohort included 17 males and 52 females with a mean age of 45 years (SD = 9 years). Participants were stratified as with (high MNSI index score > 2.5407) versus without neuropathy (low MNSI index score ≤ 2.5407). Significantly decreased medium-chain acylcarnitines and increased total free fatty acids, independent of chain length and saturation, in serum at baseline associated with incident peripheral neuropathy at follow-up, that is, participants had high MNSI index scores, independent of covariates. Participants with neuropathy also had decreased phosphatidylcholines and increased lysophosphatidylcholines at baseline, independent of chain length and saturation. The abundance of other lipid classes did not differ significantly by neuropathy status.
Interpretation: Abundance differences in circulating acylcarnitines, free fatty acids, phosphatidylcholines, and lysophosphatidylcholines 10 years prior to neuropathy assessment are associated with neuropathy status in type 2 diabetes.
© 2022 The Authors. Annals of Clinical and Translational Neurology published by Wiley Periodicals LLC on behalf of American Neurological Association.
Conflict of interest statement
BCC declares consulting fees from Dynamed. All other authors have nothing to disclose.
Figures
Similar articles
-
Association of cardiac autonomic dysfunction with higher levels of plasma lipid metabolites in recent-onset type 2 diabetes.Diabetologia. 2021 Feb;64(2):458-468. doi: 10.1007/s00125-020-05310-5. Epub 2020 Oct 21. Diabetologia. 2021. PMID: 33084971 Free PMC article.
-
Effects of a long-term lifestyle modification programme on peripheral neuropathy in overweight or obese adults with type 2 diabetes: the Look AHEAD study.Diabetologia. 2017 Jun;60(6):980-988. doi: 10.1007/s00125-017-4253-z. Epub 2017 Mar 27. Diabetologia. 2017. PMID: 28349174 Free PMC article. Clinical Trial.
-
Use of the Michigan Neuropathy Screening Instrument as a measure of distal symmetrical peripheral neuropathy in Type 1 diabetes: results from the Diabetes Control and Complications Trial/Epidemiology of Diabetes Interventions and Complications.Diabet Med. 2012 Jul;29(7):937-44. doi: 10.1111/j.1464-5491.2012.03644.x. Diabet Med. 2012. PMID: 22417277 Free PMC article. Clinical Trial.
-
Diminished retinal complex lipid synthesis and impaired fatty acid β-oxidation associated with human diabetic retinopathy.JCI Insight. 2021 Oct 8;6(19):e152109. doi: 10.1172/jci.insight.152109. JCI Insight. 2021. PMID: 34437304 Free PMC article.
-
Diabetic Peripheral Neuropathy is Associated With Diabetic Kidney Disease and Cardiovascular Disease: The Silesia Diabetes-Heart Project.Curr Probl Cardiol. 2023 Aug;48(8):101726. doi: 10.1016/j.cpcardiol.2023.101726. Epub 2023 Mar 24. Curr Probl Cardiol. 2023. PMID: 36967071 Review.
Cited by
-
Inter-organ crosstalk during development and progression of type 2 diabetes mellitus.Nat Rev Endocrinol. 2024 Jan;20(1):27-49. doi: 10.1038/s41574-023-00898-1. Epub 2023 Oct 16. Nat Rev Endocrinol. 2024. PMID: 37845351 Review.
-
Chewing the fat: How lipidomics is changing our understanding of human health and disease in 2022.Anal Sci Adv. 2023 May 10;4(3-4):104-131. doi: 10.1002/ansa.202300009. eCollection 2023 May. Anal Sci Adv. 2023. PMID: 38715925 Free PMC article. Review.
-
New perspectives in diabetic neuropathy.Neuron. 2023 Sep 6;111(17):2623-2641. doi: 10.1016/j.neuron.2023.05.003. Epub 2023 May 31. Neuron. 2023. PMID: 37263266 Free PMC article. Review.
-
Advanced Mass Spectrometry-Based Biomarker Identification for Metabolomics of Diabetes Mellitus and Its Complications.Molecules. 2024 May 27;29(11):2530. doi: 10.3390/molecules29112530. Molecules. 2024. PMID: 38893405 Free PMC article. Review.
-
Lipidome characterisation and sex-specific differences in type 1 and type 2 diabetes mellitus.Cardiovasc Diabetol. 2024 Mar 29;23(1):109. doi: 10.1186/s12933-024-02202-5. Cardiovasc Diabetol. 2024. PMID: 38553758 Free PMC article.
References
-
- Feldman EL, Callaghan BC, Pop‐Busui R, et al. Diabetic neuropathy. Nat Rev Dis Primers. 2019;5(1):41. - PubMed
-
- Andersen ST, Witte DR, Dalsgaard EM, et al. Risk factors for incident diabetic polyneuropathy in a cohort with screen‐detected type 2 diabetes followed for 13 years: ADDITION‐Denmark. Diabetes Care. 2018;41(5):1068‐1075. - PubMed
Publication types
MeSH terms
Substances
Grants and funding
LinkOut - more resources
Full Text Sources
Medical